Highlights
Appalachia is a byword for poverty, backwardness, rurality, whiteness, coal, and any number of other less-than-cosmopolitan things. This characterization is old, going back to at least the 1870s. But even earlier than this popularization of Appalachian stereotypes is Appalachian poverty itself: as early as 1850, Appalachia was substantially behind neighboring areas economically, and by most measures, Appalachia is more similar economically to other parts of the US than it was in 1850, 1900, or even 1970.
But there’s one piece of Appalachian life that goes back a long time: family. If you read JD Vance’s memoir Hillbilly Elegy, stories of family—and family instability—come thick and fast. But interestingly, one thing we see quite clearly is a nostalgia for a time when Appalachian families weren’t so unstable. Vance and others seem to present a story of cultural decay; once upon a time, Appalachia was functional, but now, the cultural engine has broken down.
We have some data that should allow us to explore this theory. For this post, I’ll talk about some key family demographic indicators for Central Appalachia, which I define as the Appalachian Regional Commission areas of Central, South Central, and North Central Appalachia. Loosely, that’s the mountainous counties of Tennessee, North Carolina, Virginia, Kentucky, and West Virginia. This is the heartland of the old Scotch-Irish settlement, the core of what people think of when they talk about Appalachia.
The very earliest data we have that can tell us much about Appalachia comes from the 1850 Census, where we find that crude birth rates were higher and crude death rates lower than the rest of the country, suggesting a younger, and probably more fertile, population. By the turn of the 20th century, we begin to get much more interesting data.
For example, we have data on lifetime births for women in Appalachia in 1900, 1910, 1940, and 1950. Averaging together 1900-1910 and 1940-1950 helps us smooth a little bit (each pair of decades is very similar). Essentially, we get a broad estimate of turn-of-the-century completed fertility by age, and mid-century completed fertility by age, as shown in the figure below.
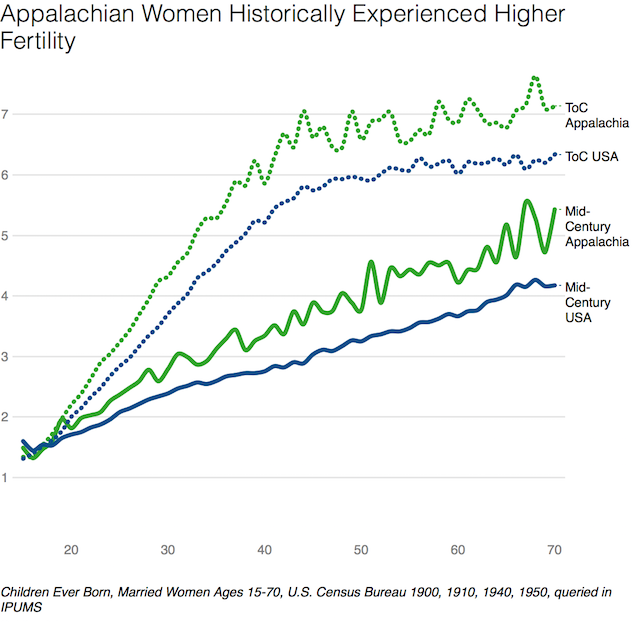
As you can see, completed fertility has fallen sharply for both Appalachia and the nation as a whole, but in both the turn-of-the-century and mid-century years, Appalachia’s fertility was higher for all ages. Since fertility is higher for all ages, this isn’t just about demographics. This is something cultural or social. Appalachian women started having babies younger, and, ultimately, ended up having about one more child on average than women elsewhere in the nation. That was as true in 1900 as it was in 1950.
Unfortunately, we don’t have geographically specific completed fertility data for more recent years. We can get age-specific births in the last year from the American Community Survey, however, which we see in the figure below.
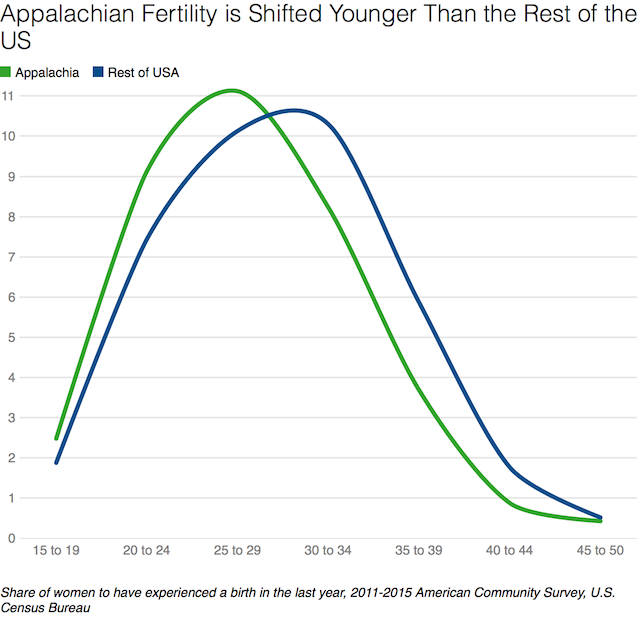
As you can see, Appalachia today has higher fertility early in life, but lower fertility later in life. When we calculate out a Total Fertility Rate, Appalachia comes out behind the nation on the whole, at 1.82 vs. 1.93, with non-Appalachian women catching up around their late thirties. While Appalachian women today have kids younger, much like their forebears in the 1900s or 1940s, they have not kept up with higher late-in-life fertility. This could reflect poorer health, worse economic conditions, different desired fertility, timing differences, or simply less access to the reproductive technologies that make later fertility possible.
Given Appalachia’s high poverty levels, one might expect the rate of unplanned pregnancy to be high. But then again, maybe not. While I don’t have data about unplanned pregnancy for Appalachia, we can look at unmarried women, who are probably more likely to reflect unplanned births. Unmarried childbearing accounts for 37.5% of births in Appalachia, versus 35.2% in the rest of the US. The difference is almost entirely accounted for by a higher share of Appalachian women experiencing births with an unmarried partner in the household (12.5% vs. 10.4% nationally); births to women with no partner present are essentially identical within and outside of Appalachia (25.1% vs. 24.8%). In other words, though Appalachian women start having kids earlier, the unpartnered births that are probably the best proxy for unplanned births aren’t actually any more common in poverty-stricken Appalachia than elsewhere, which would suggest that unplanned pregnancies might not be all that much more common either. One reason Appalachia may seem to outsiders like a place with a great deal of unplanned pregnancy could be racially-coded expectations. While its overall rates of unmarried pregnancy are not exceptional, Appalachia does have anomalously high white rates of unmarried pregnancy (35.8% vs. 29.2% nationally).
But, on some level, it’s possible that what we’re really seeing is just a different life cycle for women in Appalachia. For example, marriage happens earlier, too. We have age at first marriage data for Appalachia in 1930 and 1940, shown below.
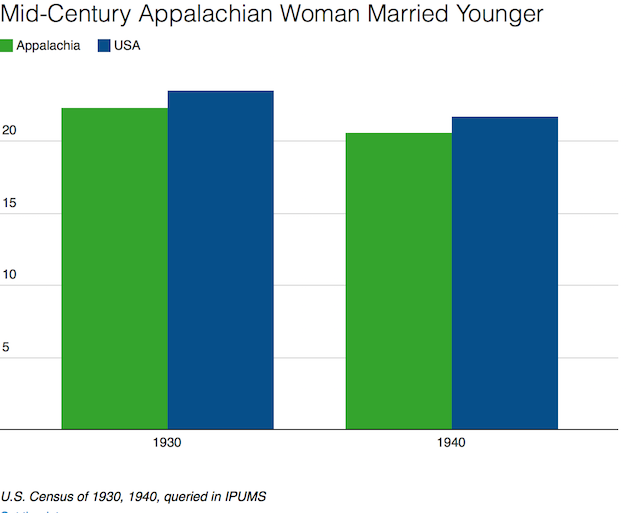
As you can see, women in Appalachia got married about a year earlier than women outside of Appalachia. Unfortunately, I don’t have age at first marriage data for Appalachia today, but we can see the proportion ever married by age in the figure below.
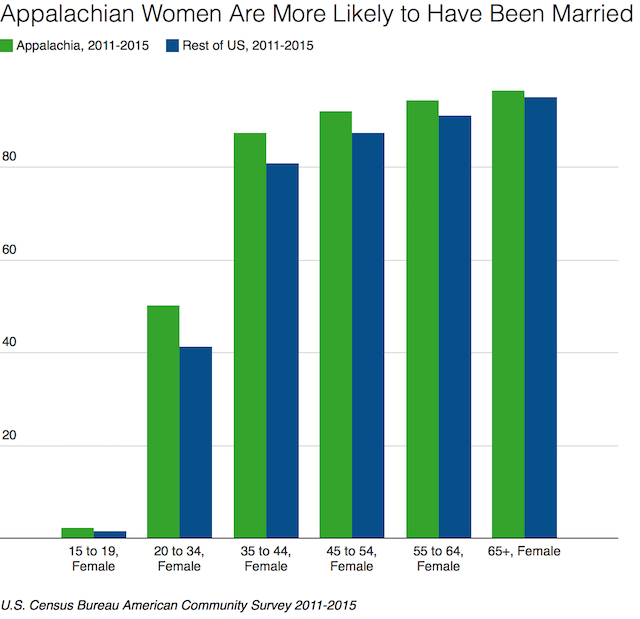
As one might expect, Appalachian women experience their first marriage earlier, but women in the rest of the US ultimately catch up to them. It’s worth noting that the ever-married share is falling for all age groups in Appalachia and the rest of the nation. The ever-married share is falling especially quickly for women under 34, and is falling faster in Appalachia than in the rest of the US; that is, Appalachian marriage-age habits are converging with the rest of the nation.
However, these Appalachian marriages are often troubled. And, in fact, they’ve been that way for a long time. In the figure below, I show the share of women who have been married multiple times, by age, for Appalachia and the US on the whole in 1910, the 1940-1950 average, and 2008-2011 average (note: dates selected due to data availability).
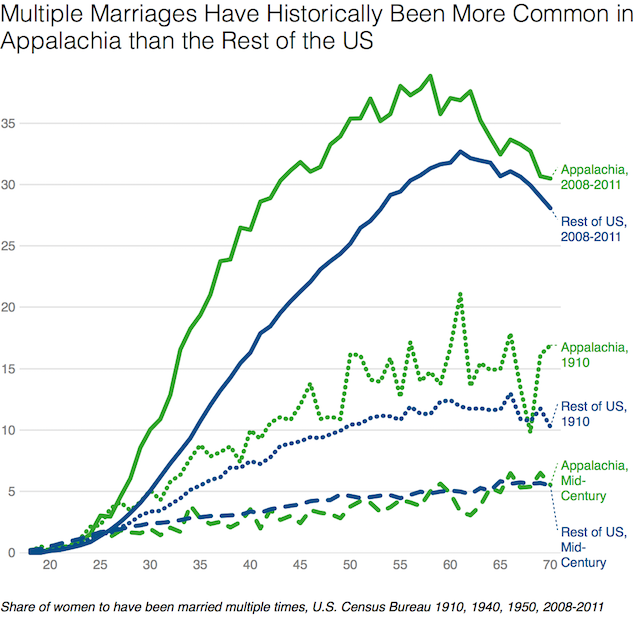
In 1910, Appalachian women were substantially more likely to have had multiple marriages in their life than women throughout the rest of the US. Whether this was due to divorce or higher mortality, I can’t say, but it’s clear that a greater degree of Appalachian marital flux was present as far back as 1910. But by the mid-century period, Appalachia had achieved a slightly greater degree of marital stability than the nation as a whole, a remarkable accomplishment given it was much poorer than the rest of the country. Unfortunately, it wouldn’t last: by 2008-2011, Appalachian women were again more likely to have had multiple marriages.
The point here is simple: Appalachian marital instability only looks truly new for people not aware of pre-WWII Appalachian social history. Appalachia in the late 19th and early 20th centuries already exhibited the early marriage, high marital separation, early-fertility social model we observe today. It briefly escaped that model in the middle of the century thanks to explosive growth in coal and military employment: low-skill jobs that gave comparatively good wages and, crucially, where the employer tightly regulated the lifestyle and living conditions of Appalachian workers. Now, coal companies were not beneficent overlords—far from it—and their long-run impact is a story of violence and corruption in the region. But they did run company towns that forced a degree of social uniformity and created a kind of engineered society for Appalachians. Certainly, since the middle of the century, Appalachia has been harder-hit than the rest of the country with a wave of divorce and family instability, reflecting its shift from slightly better-than-average marital stability to substantially worse-than-average: a shift that may reflect the different impact of liberalized divorce laws by income level.
When Appalachians look back, they see what they’ve lost since the middle of the century as a story of outside forces wreaking havoc on a region. There’s some truth to that account. But Appalachia has been riven by instability, guerrilla warfare, assassination, family instability, substance abuse, and cultural chaos since at least the tumults of the American Civil War, and it shows in the data we have on family demographics. And now today, the share of Appalachians who have divorced in the last year is higher for most age groups, especially the young (see figure below).
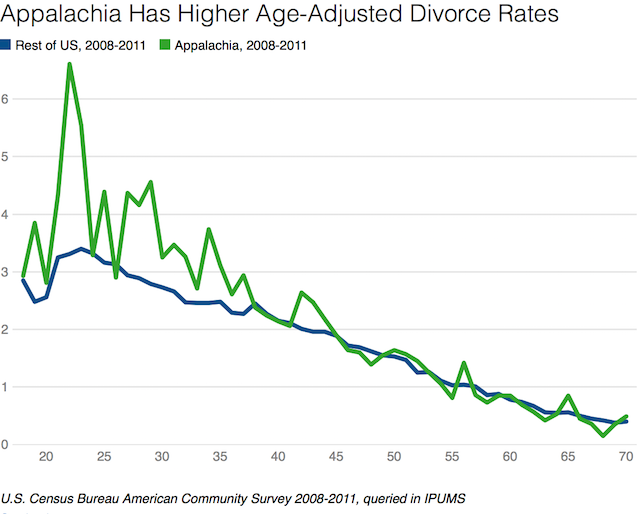
Even with these higher divorce rates, the share of Appalachian women currently married is nonetheless higher than women in the rest of the US. But if we calculate a “total lifetime divorce risk” the same way we would calculate a total fertility rate, then it turns out the average Appalachian women who is 17 today can expect to be divorced more than once in her life (1.16), vs. just under once for women elsewhere in the US (0.96).
This is a hard reality Appalachians must deal with. But it’s not, properly speaking, a totally new phenomenon. For those of us who care for the region, and our friends and families who live there, considering a solution is challenging. If this were new, we might just be able to undo a few bad influences. But we’re wrestling with a larger cultural logic, a deeper untethering of the Appalachian family than just the present troubles with opioids, disability payments, environmental degradation, and lost coal jobs. At the very peak of its coal-boom, Appalachia only just managed to edge out the rest of the US in terms of family stability. Whatever makes Appalachia hard on families, whether it’s an old Scotch-Irish set of cultural norms, geographic isolation, or bad governance, it goes back a long time, and it seems like fixing it might take more than a few tweaks to this or that program.
Lyman Stone is an economist who blogs at In a State of Migration, and a proud Kentuckian. Lyman also works as an agricultural economist at USDA. His views are not endorsed by, supported by, or in any way reflective of the US government.


