Highlights
- At least around the industrialized world, the brief interlude of civilization in which richer people had fewer children is ending. Post This
- Cultural norms (especially related to marriage, timing of childbearing, and desired number of children) are the most powerful in shaping fertility behavior, not societal income levels. Post This
- Before the 1990s, GDP per capita had a very modest and plausibly negative effect on fertility. But today, there’s a positive effect. Post This
In two previous posts (here and here), I argued that the link between income and fertility is not nearly as negative as is commonly believed. I may sound like I’m being contrarian, but the finding that income and fertility are not necessarily negatively correlated is a widespread finding in recent demographic research. In this post, I’ll lay out some additional evidence showing that the relationship between income and fertility may be quite positive in many cases.
The income-fertility relationship is important because if rising income inevitably causes falling fertility, then there’s no way to achieve higher fertility and modern living standards. If the only way to have higher fertility is to become Amish, probably not many people will make that choice, and societal fertility is doomed to keep falling. But if—as I believe to be the case—there is no necessary and inevitable negative link between fertility and income, and if in many cases income and fertility may be positively connected, then pronatal policies (whether cash transfers or more symbolic cultural interventions) are likely worth trying. If the income-fertility relationship is not inherently negative, then there’s a chance we can make a world where people have the families they want to have, while also enjoying modern standards of living. But if the income-fertility relationship is inherently negative, then there’s no such hope.
Positive Income-Fertility Correlations Within Countries
To begin with, let’s lay out the international research. A recent study using tens of millions of Dutch administrative records found that men and women with higher personal incomes had higher birth rates, and that this effect grew over time (from 2008 to 2022). In fact, the highest-earning Dutch women had 60% higher birth rates than the poorest!
A somewhat older study using a similar method in Norway (from 1995 to 2010) found that higher earning women there had more babies, too.
A recent study from Sweden, which also controls for IQ and numerous other factors, found that for men born 1951-1967 with an IQ of 96-104, the richest 20% of men had nearly double the fertility of the poorest 20 percent.
Another study, covering Swedish men and women born 1940-1970, found that there was basically no correlation between women’s lifetime disposable income and their fertility, but for men, there was a strong positive relationship. Similar to what I’ve shown for the U.S., women’s lifetime accumulated earnings did have a negative relationship with their fertility, but this effect was far weaker for the women born in 1960 than in 1940, and for men, earnings positively predicted fertility.
And a study used panel data on seven countries (Australia, Germany, Korea, Russia, Switzerland, the UK, and the U.S.) and found that in every country for both men and women, more income predicted higher birth probabilities in the next two years.
And finally, I’ve shown elsewhere that in Canada, fertility has already become strongly income correlated.
I could go on. But the conclusion is simple: at least around the industrialized world, the brief interlude of civilization in which richer people had fewer children is ending. We are returning to the ancient human historic norm of higher-status people having more babies. This is often hard for people to believe because the belief that “poor people have more kids” is deeply entrenched: so deeply entrenched, in fact, that there’s an entire academic field of research (“developmental idealism”) devoted to studying how this notion came to be so widely believed. But nonetheless, richer people are having more babies, so much so that cross-country fertility correlations showing negative fertility gradients are starting to fall apart. As just one very fun example, I like to remind people that today, Nepal and France have about the same fertility rates: 1.85, despite France having about 10-30 times higher GDP per capita (depending on how it’s measured).
Cultural norms (especially related to marriage, timing of childbearing, and desired number of children) are the most powerful force shaping fertility behavior, not societal income levels.
Explaining Negative Correlations
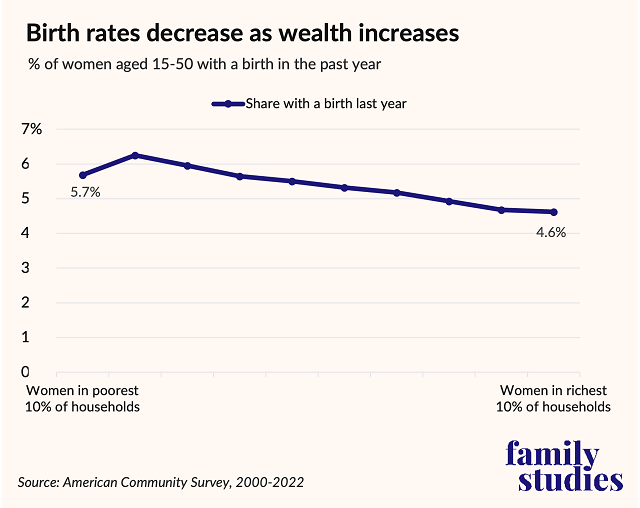
Now, most of us have probably seen graphs purporting to show fertility by income, with a negative gradient. Like this one I produced from the American Community Survey, just measuring: what percent of women ages 15-50 in each income bracket had a baby in the last year?

How can this graph exist, if rich people are really having more kids?
Those who’ve read the prior two posts on this topic may have a sense of the answer, which is that the above figure is based on women’s household incomes after they have the baby, i.e. when they are likelier to have quit their jobs. But the studies I mentioned earlier use data on women’s incomes before they have a baby, or on their entire lifetime income. Analyzing fertility based on income after having a baby is obviously not correct if the goal is to understand how income influences fertility, since having a baby tends to reduce women’s incomes.
To understand how income influences fertility, we need to observe income before birth occurs, and, on that basis, more income means more babies. Conventional cross-sectional surveys just can’t produce this kind of data.
Cross-national Correlation is Not Causation
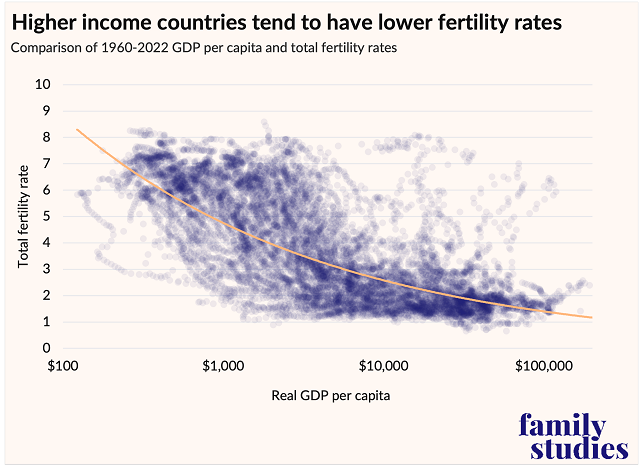
Finally, it’s worth taking a moment to address another kind of graph many people have probably seen, which convinces them that low fertility is an inevitable result of high incomes. This figure plots total fertility rates in every country in the UN and World Bank databases, comparing the total fertility rate to inflation-adjusted GDP per capita, from 1960-2023.

That’s a very negative slope to that line! Now, it’s worth noting, it’s also a very kinked line. If you squint a bit, you can see that fertility falls persistently from GDP per capita of $100 to around $9,000, then has a much more modest decline after that. But in general, yes, the line has a negative slope.
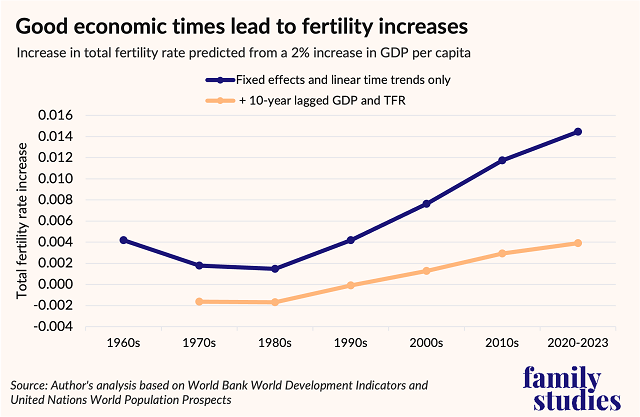
But as the old adage says: correlation is not causation. Let’s cut this data another way. We’ll use what’s called a panel model with fixed effects.1 This is a fancy way of saying instead of just lumping a bunch of countries together, we are going to ask, “Within an individual country’s history, what tends to happen to TFR when GDP per capita rises or falls?” This is a way of capturing effects over time, not just the cross-sectional effects. Here’s the effect of a 2% increase in GDP per capita on fertility estimated by the model:

As the figure illustrates, before the 1990s, GDP per capita had a very modest and plausibly negative effect on fertility. But today, there’s a positive effect! A 2% increase in GDP per capita could be expected to boost fertility by perhaps as little as 0.003 children born per woman, or perhaps as much as 0.015.
Those are small effects. But the point is, they’re positive effects, and getting more positive over time. Bad economic times cause people to delay or avoid having kids. That’s true if the bad economic times are a famine due to lack of rain in agricultural economies, a short recession due to business cycle dynamics, or the grueling decades-long recession Puerto Rico has endured since the early 2000s, which has pushed fertility there below one child per woman. On the other hand, when economic times are good, people tend to get married, buy homes, and feel confident about having kids. Economic chaos is bad for baby making.
Now, a critic might respond: annual changes in income are too short to influence fertility. That’s a fair concern! But if instead I use something like the economic growth rate over the last 10 years, the effect of GDP growth is still positive. More money, more babies.
So how is it possible that more money can have these modestly positive associations on fertility individually and over time, but such a negative cross-sectional relationship? Simple, as I discussed in a prior post: cultural stratification. In a dataset of almost 1500 surveys of fertility preferences around the world, desired family size can explain 73% of the observed variation in actual fertility rates. Meanwhile, GDP per capita can explain just 27% of the observed variation. Cultural norms have spread in ways correlated with but not identical to economic growth around the world, and it is cultural norms (especially related to marriage, timing of childbearing, and desired number of children) that are the most powerful in shaping fertility behavior, not societal income levels.
The relationship between income and fertility is complex: yes, sometimes negative but also often positive—and increasingly so in the 21st century.
Conclusion
Rising incomes are one of the most important social forces of the last 200 years. Virtually the whole of humanity has transitioned out of isolated subsistence agriculture towards economic interconnectedness. Even subsistence farmers in isolated rural parts of poor countries often wear factory-made clothes or use cell phones. It’s tempting to believe this vast change has also, through some inevitable process, incontrovertibly suppressed fertility. But this is not so. The relationship between income and fertility is complex: yes, sometimes negative but also often positive, and increasingly so in the 21st century. There is simply no intrinsic tension between being a prosperous society and being a society where people achieve their fertility goals.
The world-historic “whale” of economic growth has brought with it various cultural barnacles riding in its wake. Some of these are very good: basic human rights for women, the abolition of slavery in most of the world, democratization, etc. But other parts of the modern global culture have had decisively negative effects on fertility: treating motherhood as a low-status vocation, smaller family size norms, delayed and devalued marriage. It is not remotely clear what policies will be most effective at fixing these challenges, and because countries have different cultures and economic systems, there’s no reason to imagine the same policies will work everywhere. But since we know that low fertility is not an inevitable consequence of modern economic growth, and in fact economic prosperity is even modestly pronatal, there is good reason to believe modern societies can be made meaningfully more compatible with family life.
Governments can change cultures. The American South was a slave-society, not just legally but culturally. And yet, today, four of the five states with the highest rates of interracial marriage are former slave-states. In the 1700s, religious minorities like Quakers and Baptists and Lutherans faced open, violent persecution by Anglican and Congregationalist state churches; today, the idea of a war between Anglicans and Baptists is preposterous. Changes in laws about religion were part of how that peace came into being. In France, nearly a century of pronatal policy has boosted French population today by millions of Frenchmen, but it has taken a century of policy to get that result. The project of pronatalism is no different. Achieving a pronatal cultural change will take many decades of trying different policies, refining them, and trying again. We’ve got some ideas about where to start in 2025.
Lyman Stone is Senior Fellow and Director of the Pronatalism Initiative at the Institute for Family Studies.
1. I use a standard model with fixed effects for country, for year, and also a control variable for linear country time trends: if a country has a long-run drift up or down in fertility unrelated to its income, I control for that. I also re-estimate the model a second time with extra variables controlling for a country’s TFR and GDP per capita 10 years previously. Results are coefficients after accounting for these controls.


