Highlights
- A major driver of child care chaos and cost is how it is regulated in the United States. Post This
- Using the Child Care Regulation Index, we can see that a one-point increase in the index score, which represents more child care freedom, predicts a decrease of $774 per year in infant center-based child care costs, according to 2023 data. Post This
- The unintended consequences of restrictive child care regulations include less transparency with parents, fewer new child care businesses, less flexibility in program hours, and of course, higher prices. Post This
With an average cost of $16,000 per year and an average waitlist length of over 200 children, child care accessibility is an issue that transcends any single election. The task of “fixing” child care has proven extremely difficult, as Andrea Mrozek showed in her analysis of Canada’s $10/day program. Political promises to make child care affordable miss the root issues of rising costs, which in some cases could be an easier target for change.
A major driver of child care chaos and cost is how it is regulated in the United States. That is why Clara Piano, Vincent Geloso, IFS’s Lyman Stone, and myself constructed a Child Care Regulation Index in order to study the relationship between child care regulation and fertility gaps in states across the country. The index, published by the Knee Regulatory Research Center at West Virginia University, illustrates the central role that regulations play in shaping child care affordability and accessibility in various markets.
The Child Care Regulation Index was constructed using a standard approach for scoring regulation. Higher scores represent more openness in the child care market, what we call “child care freedom.” The Index summarizes state-level data on group sizes, child-to-staff ratios, required annual training hours, and minimum educational requirements for teachers and center directors. The data includes age group specifications for each regulatory category and is publicly available online through state licensing boards.
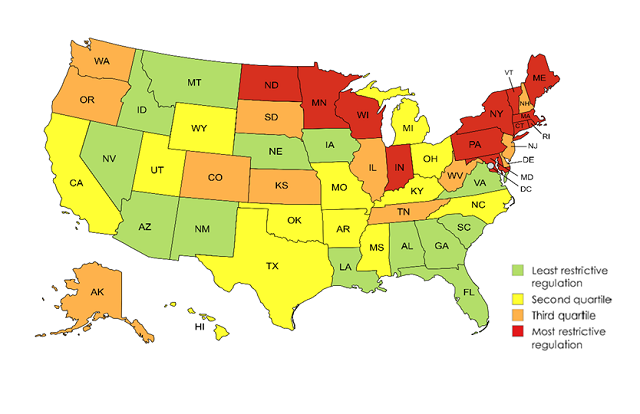
Figure 1 shows variation in the regulatory environment of child care across states. For example, in Maryland, the maximum staff-child ratio is 1:3 for 12 to 18-month-olds and 1:10 for three to four-year-olds. In Arizona, the maximum staff-child ratio is 1:6 for 12 to 18-month-olds and 1:15 for three to four-year-olds. These states have Child Care Regulation Index scores of 2.27 (Maryland) and 7.9 (Arizona), reflecting their relative position among all 50 states. Educational requirements are scored on a scale. For example, Idaho, Iowa, and others allow those with no high school diploma or GED to work in child care facilities. At the other extreme, Rhode Island requires applicants to have a bachelor’s degree in early childhood education or a closely related field.
Figure 1: Child Care Regulation Quartiles

As can be seen, the most restrictive quartile (red) is clustered in the high population states of New England and the Great Lakes. In contrast, the least restrictive quartile (green) is dominated by Southeast and Western states. After averaging all relevant variables, Louisiana's child care regulations rank in the 90th percentile for child care freedom, while Massachusetts's regulations rank in the 17th percentile. None of the scores are a perfect zero or 10, meaning some states may have more extreme regulations than Louisiana or Massachusetts in certain aspects of their code, but not in all variables.
Table 1: Child Care Regulation Rankings—Least to Most Restrictive

It is difficult to infer true quality of care from child care regulation scores. Regulatory measures aiming to enforce safety and quality in child care facilities are merely proxies for what happens in practice. The unintended consequences of restrictive regulations include less transparency with parents, fewer new child care businesses, less flexibility in program hours, and of course, higher prices.
Diana Thomas and Devon Gorry showed that an increase in group sizes and educational requirements could have significant effects on child care prices. Using the Child Care Regulation Index, we can see that a one-point increase in the index score, which represents more child care freedom, predicts a decrease of $774 per year in infant center-based child care costs, according to 2023 data. This is nearly a 5% reduction in prices per index point. The differences between Louisiana and Massachusetts in terms of child care freedom result in a price difference of over $5,600 annually for infant care.
States can learn from one another’s diverse approaches as they consider the trade-offs between restrictive regulations, quality, and affordability. It is important that researchers continue to explore questions of quality and affordability when it comes to increasing regulatory burdens on care providers. Parents want the best for their children, but they need to know what the true trade-offs are.
Anna Claire Flowers is an economics PhD Fellow with the Mercatus Center and a Graduate Fellow with the F.A. Hayek Program for Advanced Study in Philosophy, Politics, and Economics.


