
Executive Summary
Most Americans have a general sense of which states are rich or poor, urban or rural, “Red” or “Blue.” But a “map of parenting” is more mysterious: there is very little credible, comparable data about what parenting and childhood is like around the United States. As a result, when parents talk to each other about the challenges of parenting, or when policymakers consider what policies will support families, these conversations often happen “in the dark.” In this new Institute for Family Studies report based on a survey of almost 24,000 parents of over 40,000 children, including 2,600 teenagers, we remedy that gap. By sampling parents around the country, this new research shows how parenting varies around the country on several key axes.
Overall, we find large, and surprising, regional differences in parenting nationwide. Parents give the most positive evaluations of parenting in the Southeast and New England, followed by the Southwest and Midwest. But the trend in parenting approaches is quite different. Using a composite score that measures the extent to which children have independent, playful, socially-diverse, and technology-lite childhoods, we find that kids in the Great Plains, Mountain states, and New England have the highest scores, while a cluster of states around Southern Appalachia are where children have the least independent, least socially-diverse, most technologically-dependent childhoods.
Our parenting measures do not fit neatly into the other “maps” of America that readers might imagine; they are not a map of cities vs. rural areas, politics, wealth, or even family structure. Rather, they represent different, often barely visible axes of cultural differences in America when it comes to parenting experiences and styles. In general, parents choosing to give their kids independent and tech-lite childhoods report greater difficulty in parenting, despite achieving positive outcomes such as better mental health. These parents face widespread cultural norms in favor of helicopter parenting, intensive supervision, and unlimited screen time. If Americans want the next generation to grow up to be independent, free-spirited, resilient adults, this will require us to consider a major overhaul of American parenting, and it is long past time for policymakers to start listening to parents about what kinds of support they need.
Key Findings
- The states with the top marks in our Resilient Childhood Score (i.e., where kids have the most diverse social lives and independent play, and use digital technology least) are Hawaii, Maine, Maryland, North Dakota, Rhode Island, and Utah. The states with the bottom scores are Kentucky, Louisiana, North Carolina, Virginia, and West Virginia.
- The states with the top marks in our Parental Experience Score (i.e., where parents feel parenting is most pleasant and where they feel most supported in their parenting) are Alabama, Alaska, Georgia, Illinois, New Hampshire, and South Carolina. The states with the bottom scores are Delaware, Kansas, Nebraska, North Dakota, and Utah.
- In general, states with a better Resilient Childhood Score tend to have a worse Parental Experience Score. Where parents are creating autonomous, independent, social, screen-lite childhoods, parenting is harder and feels more isolating.
- For American children to have childhoods that create the independence and self-reliance that have long typified American culture, parents will need more societal support and reinforcement to create resilient childhoods. Families can’t do it alone.
Introduction
Over the last several decades, parenting in the United States has radically changed, as screens and social mediahave reached into the tenderest years of children’s lives. According to conventional wisdom, parents should accommodate this new normal and learn to raise “digital natives.” In practice, this approach reduces exercising one’s parental duty to reliance on the “parental controls” that Big Tech companies provide, often only after extraordinary public pressure.
Parents across the country are silently struggling en masse, having learned that these paltry settings are unfit to address the dangers that their kids encounter online. Whether smartphones in schools, social media accounts for children, infinite-scroll pornography, or school-distributed tablets with minimal safeguards, parents have haplessly wrestled with powerful technological forces. Unable to keep their children safe, American parents have turned to state lawmakers for help. Today, dozens of states have passed laws to make the internet, app stores, and screens safer for kids, as well as to remove smartphones from schools, with the appetite for more regulation only growing among lawmakers and parents alike.
At the same time, particularly through the work of scholars like Jonathan Haidt, a consensus has emerged that, though much good might be accomplished by getting kids off screens and delaying the introduction of social media, this is not sufficient on its own to reestablish a healthy childhood. As digital engagement among kids has increased, the unsupervised activity of children in real life has dramatically decreased. Distances that children once walked beyond their yard have been shortened; the hours kids spend in-person with friends have been reduced; decisions and challenges kids once faced alone have become subject to parental oversight; and the time kids spend beyond the parental eye has decreased.
Hence, Haidt’s summary of the state of children and parenting in his bestselling book on the subject: “overprotection in the real world and underprotection in the virtual world—are the major reasons why children born after 1995 became ‘the anxious generation.’”
Haidt’s observations about the reduction of free play for children build upon several decades of similar concerns. For example, organizations like the Alliance for Childhood were established in the late 1990s and early 2000s to help society recall the benefits of childhood freedom and to advance these prerogatives socially and politically. Yet it was the publication of The Anxious Generation—with the covid lockdowns and school by screen still visible in the rearview mirror—that really struck a nerve and accelerated the movement already underway.
For all the apparent changes to childhood and parenting trends (both the radical technological changes, as well as the new social movement to rescue childhood), we still know very little about the baseline practices of parenting in the United States. How do Americans parent? What is it like to try and protect children online and allow kids a life of free play in, say, Texas, California, North Dakota, Virginia, Florida, or any other state for that matter? How much unsupervised play can children expect to have, and how does that vary around the country? To find out which states are the most conservative, or the richest, or have the highest divorce rates, all we need to do is look that up—but if we want to know where kids receive smartphones at the youngest age, there is shockingly little data.
Because we believe raising children is one of the most important tasks of a society, and to gauge the state of the cultural changes that are underway around the country, we decided to fill this knowledge gap. In November and December 2025, we surveyed almost 24,000 parents about parenting. Each parent completed household roster surveys answering detailed questions, ultimately covering almost 40,000 children. About 2,400 teenagers in these households also directly answered survey questions for themselves. As a result, we have collected an unprecedented amount of information on various concerns and practices in modern parenting.
With this report, our goal is not to present a systematic account of parenting in the United States across every demographic subgroup, but to “draw the map” of parenting practices.
We wanted to understand how parenting varies across states and regions, as a first step to answering, “What is it like to parent in America today?” Moreover, while we asked about many topics, it was not possible to ask about every single issue that interested us. Nonetheless, we tried to capture a range of parenting topics for which other data sources do not exist or are difficult to access, in order to provide a textured view of modern parenting in America.
The customary output of IFS surveys and analyses are statistics and graphs of varying complexity. Because this report is concerned with parenting culture and with gauging differences between places, the findings below will be presented, with a few key exceptions, in the forms of scores and maps, though future publications will explore these results in more detail.
Overall, we find significant differences from state to state, but at the highest level, one broad trend stands out: in states where children get more independent play, have more varied social lives, and use digital technology less frequently, parents are exhausted. The parents still holding the line on giving their children a childhood not governed by algorithms feel that they are swimming upstream, even as their children enjoy better outcomes. In our view, this underscores the need for policies to help support these parents in their commitment to raise healthy children.
Technology in the Family
As we note in the Introduction, the rise of technological and mass media devices in the home has been a defining feature of modern life. First the radio and telephone, then the television, then computers and video game consoles, now cell phones, tablets, wearables—devices are increasingly prevalent at home.
Rather than ask about every single kind of gadget a child might use, we chose to focus on only interactive, internet-enabled devices, as these are the “cutting edge” of new devices that parents are contending with (yet have had limited, and typically no, experience with). We did not ask about television viewership or listening to the radio (nor internet radio or podcasts), and we did not ask about children’s audio devices like the Yoto, Storypod, or Jooki. We focused, instead, on smartphones, gaming consoles, tablets, internet-enabled wearables, and handheld gaming devices like the Nintendo Switch.
On the interactive maps at the top of this page, we’ve provided maps of many technology indicators in the household, but here we focus on just two.
First, we assessed smartphone usage time (adjusted for the intensity of parental controls) as an objective measure of unregulated access to apps and the internet for children.
Second, we asked parents to subjectively report which of these statements better describes their parenting: "engagement with technology and encouragement of online exploration," as opposed to "little or no technology, lots of free play, especially outside.”
Here is what we find.
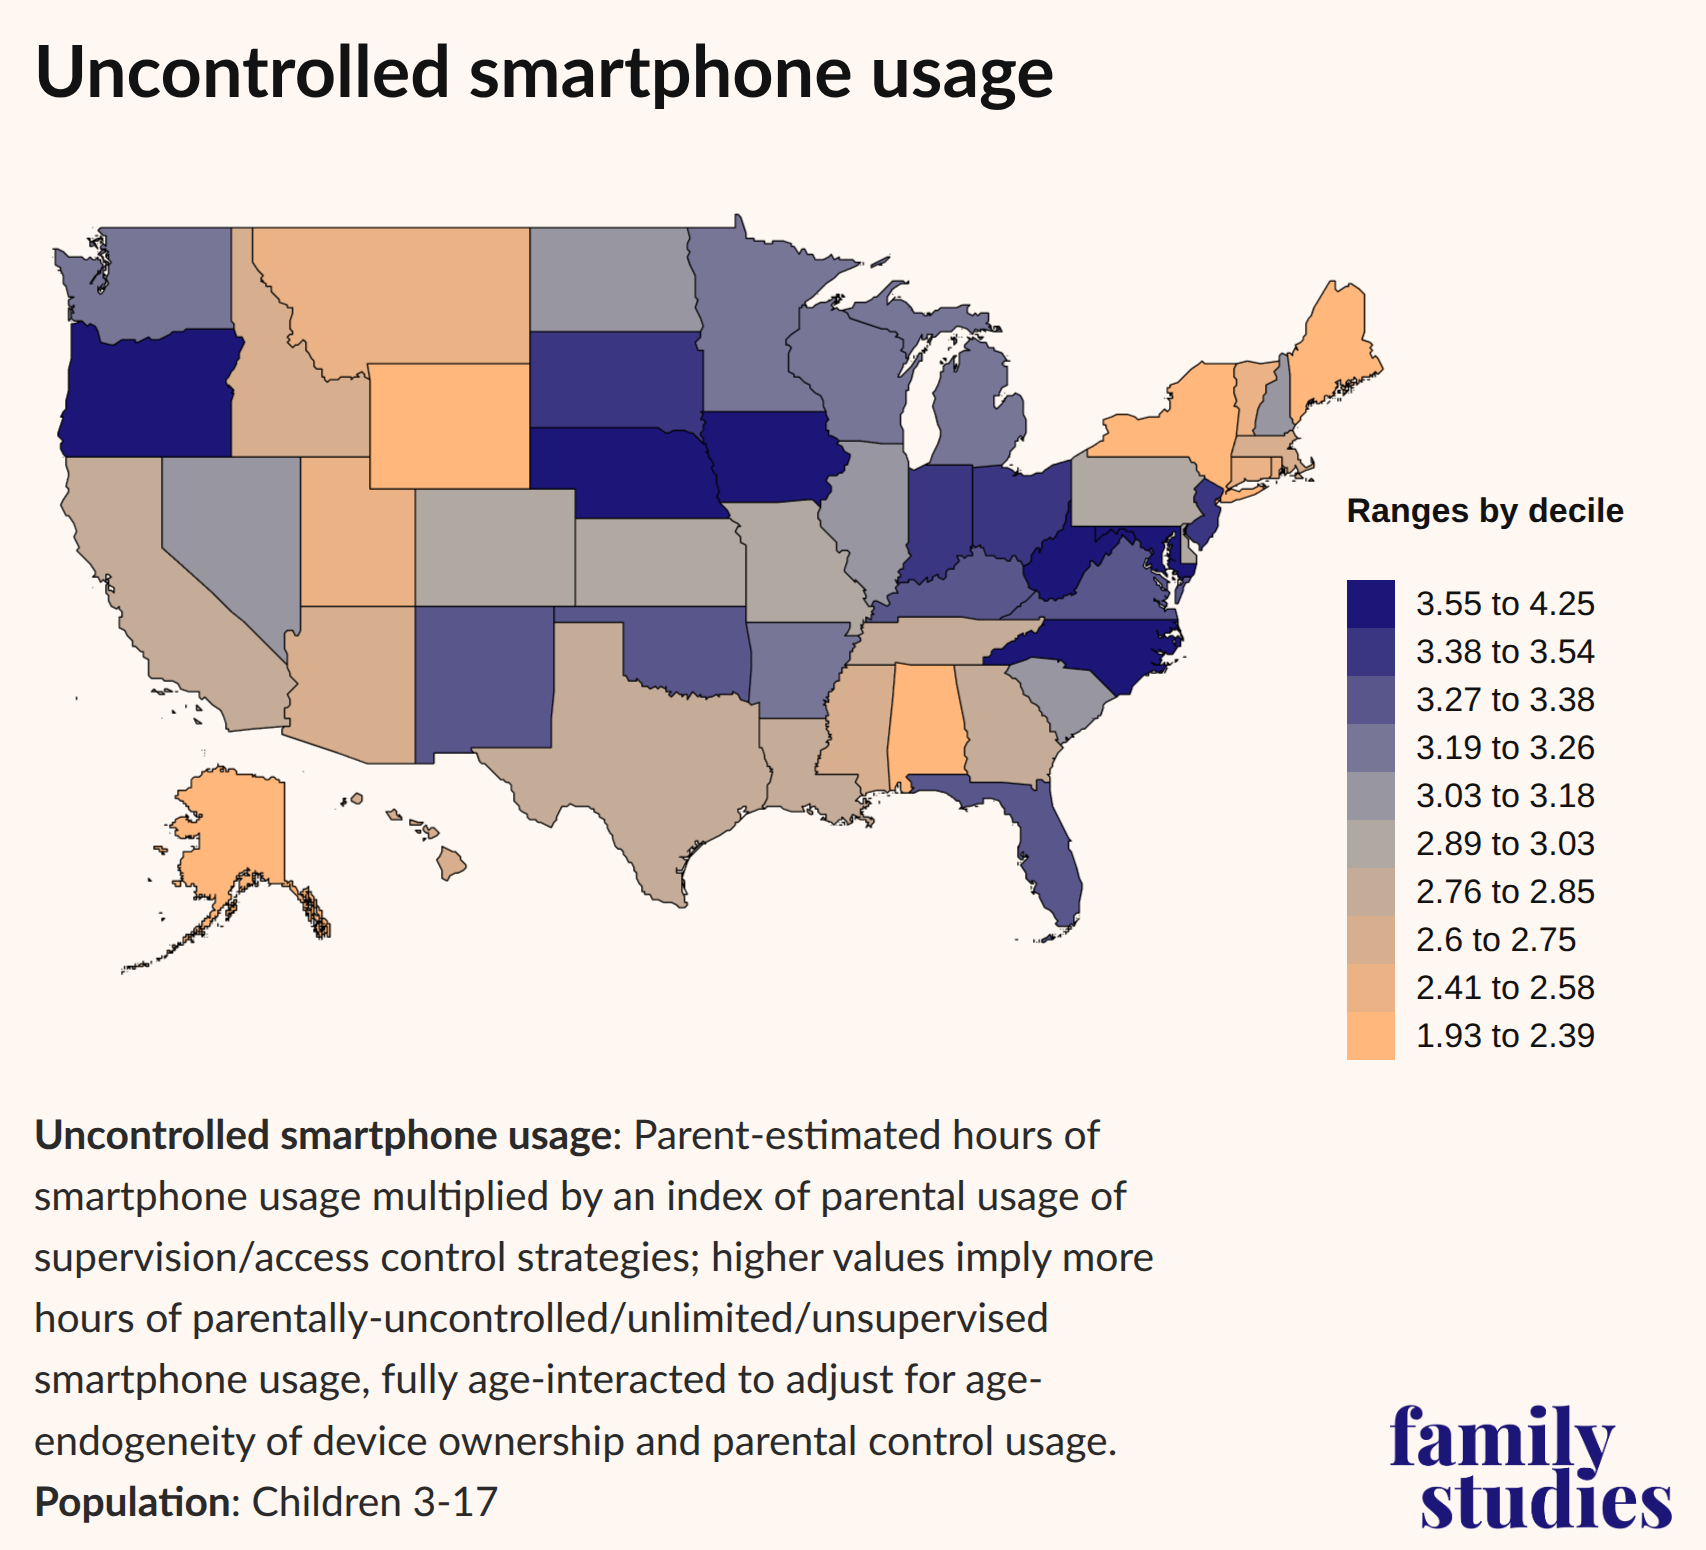
This map displays uncontrolled smartphone use by state. As kids get older, their parents are likelier to allow them uncontrolled smartphone use, and so our estimates for each state are the average estimate across each age group. In other words, we are eliminating any bias due to the age mix of children in the families we surveyed.
Based on these results and assumptions, we find an arc of states—running from South Dakota to Indiana to North Carolina—in which children are allowed the most smartphone usage with the least mitigation through various parental controls. Meanwhile, kids’ access to smartphones in New England, the Mountain West, and the South is somewhat more controlled. Put differently, in the warm-orange states, a parent who is seriously limiting smartphone use or at least applying parental controls is more likely to meet other parents with similar values and approaches, whereas in the cold-blue states, their peers are more likely to be less serious about applying parental controls.
While our survey cannot identify exact causal mechanisms, when we asked our teen respondents to self-report on the quality of their mental health and subjective well-being across a range of different questions, those with many hours of uncontrolled smartphone access had noticeably worse mental health scores.
We also find a strong connection between the subjective well-being scores of parents and the mental health consequences for kids who use their smartphones heavily. If a child’s parent had low self-reported well-being scores, then the consequences for heavy smartphone use are intensified.
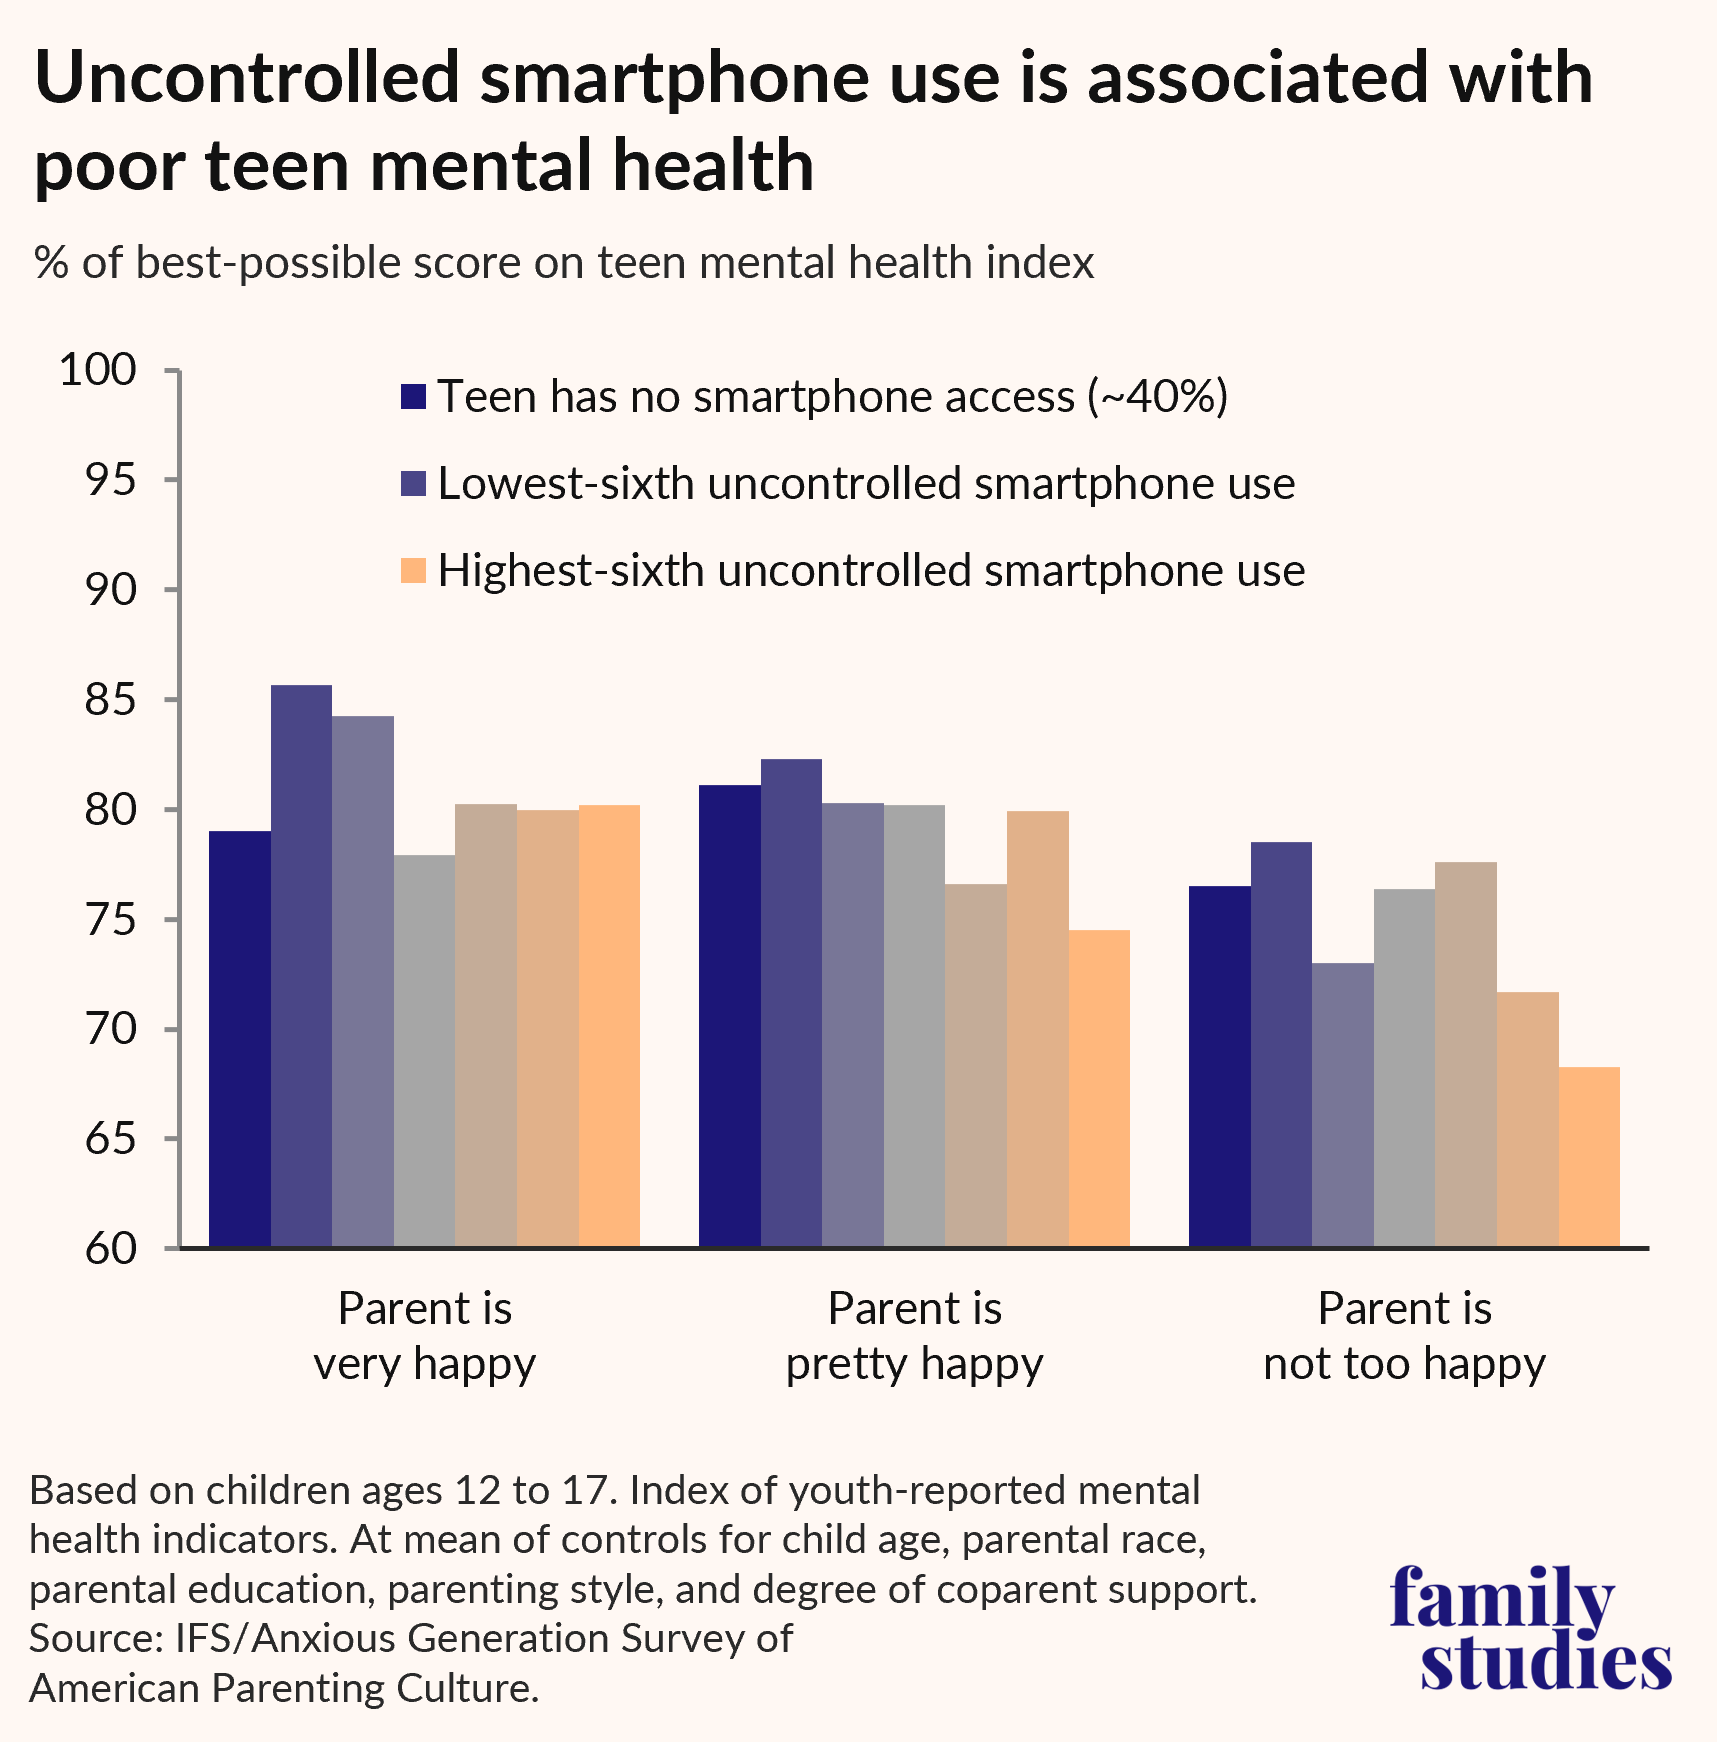
This suggests that uncontrolled smartphone use may exacerbate problems in households that are already struggling, while households with very happy parents may have buffering effects that limit harms.
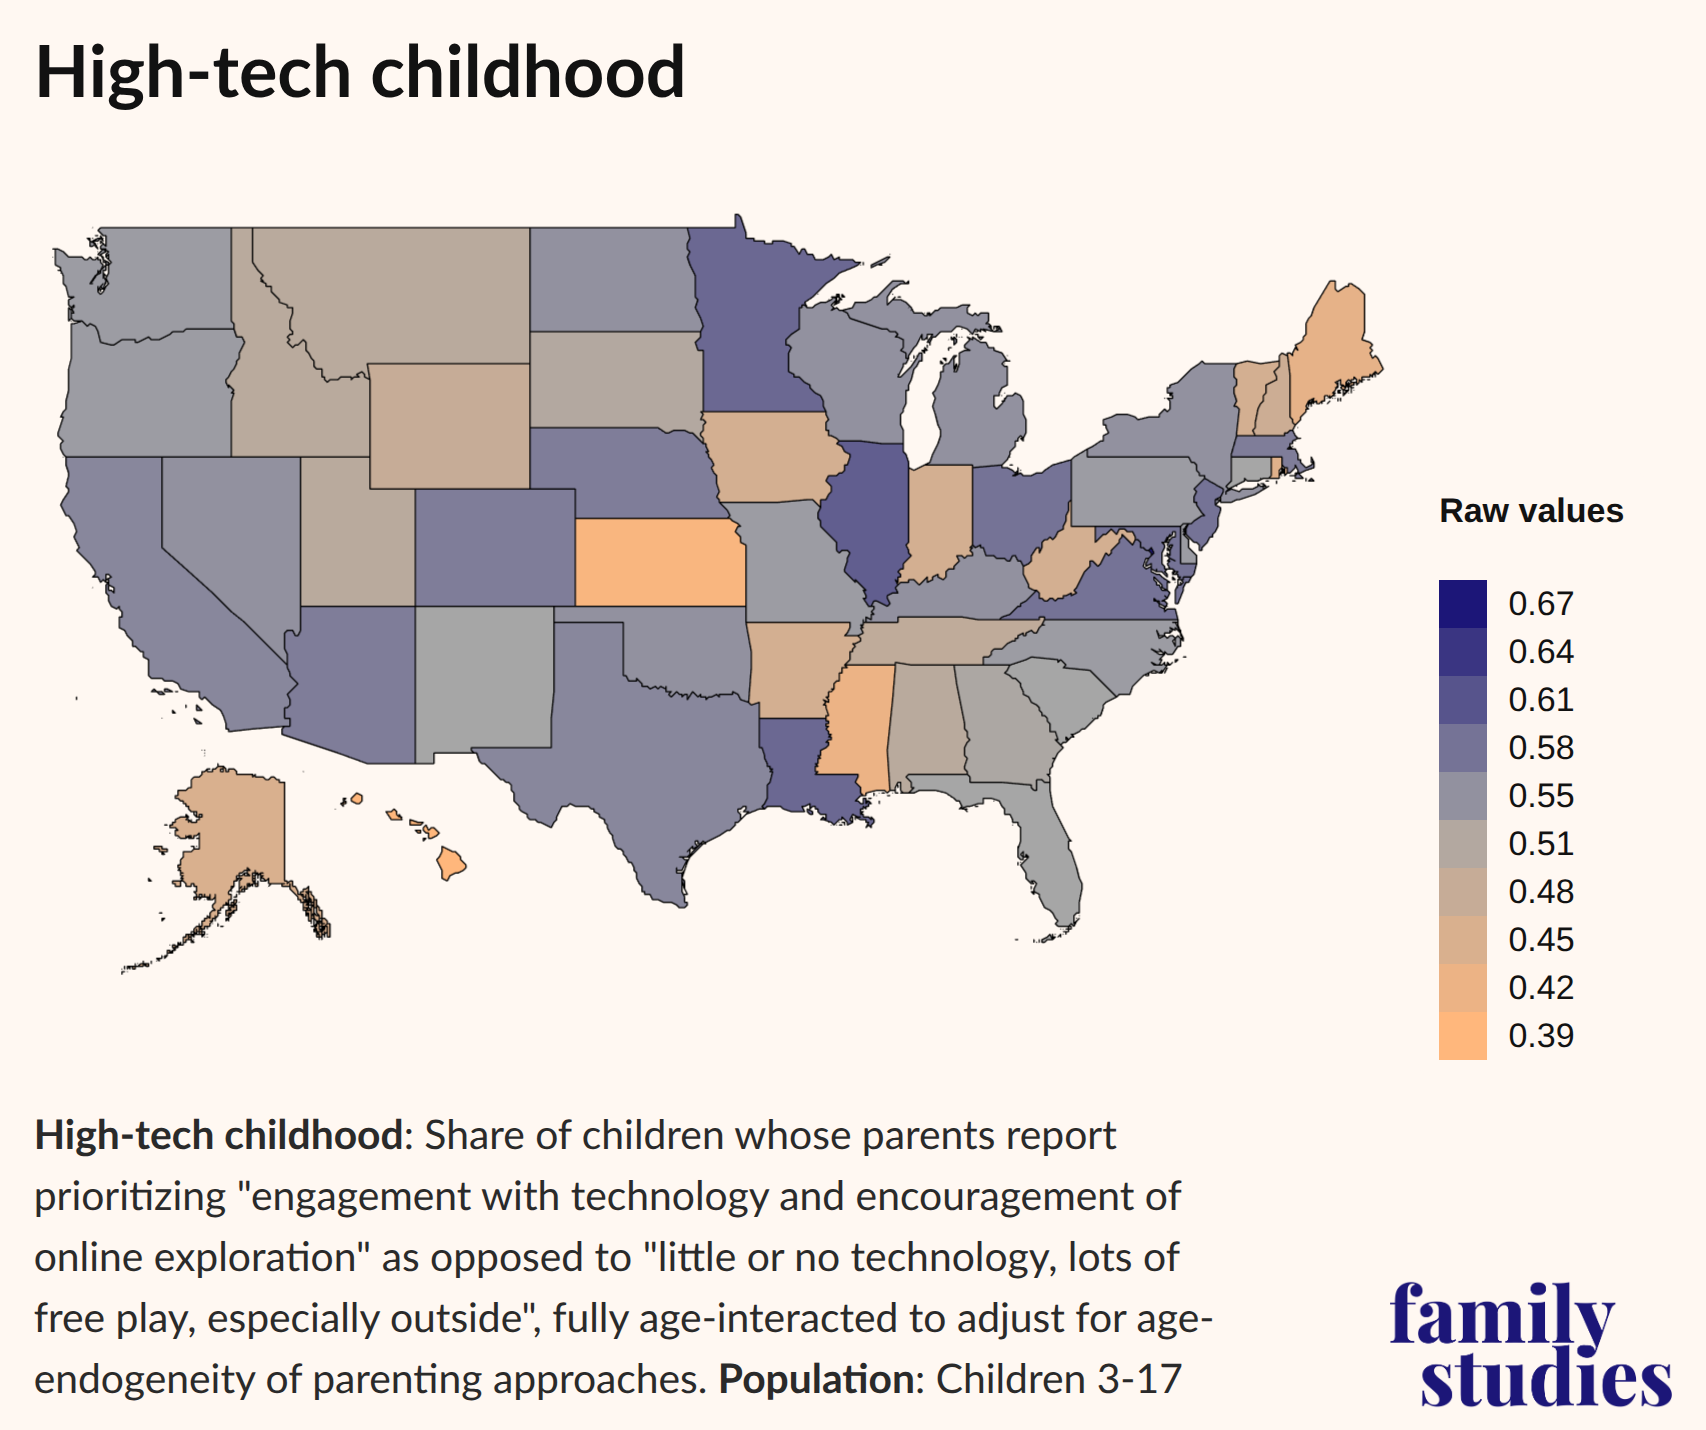
But can we identify localities where high-tech childhoods (places where children are encouraged to engage with technology and explore online) and low-tech childhoods (places with "little or no technology, lots of free play, especially outside”) are concentrated? This analysis yields weaker regional trends, and we find much more variation by state. The Mountain states, the South, and New England (as well as Alaska and Hawaii) still show up as places where families are trying to foster “low-tech childhoods.” However, the states with the most pro-technology parents are not very regionally clustered—e.g., Minnesota, Illinois, Louisiana, Ohio, New Jersey, and Virginia—except for the whole Southwest, where parents appear to broadly exude a relatively pro-tech approach to raising children.
Independent Play
As we describe above, this survey also explores childhood independence and play as a broad theme. While we surveyed many topics, here we focus on three findings: namely, 1) the hours per week that parents estimate that their children play outdoors; 2) the distances children are permitted to walk without parental oversight; and 3) how parents feel about 8- to 12-year-old children having more (or less) unsupervised playtime.
The first two questions establish objective measures of behavior, whereas the third gauges parental attitudes. Starting with outdoor play, here is what we find (with the warm-orange colors indicating lower scores and the cold-blue colors showing higher scores).
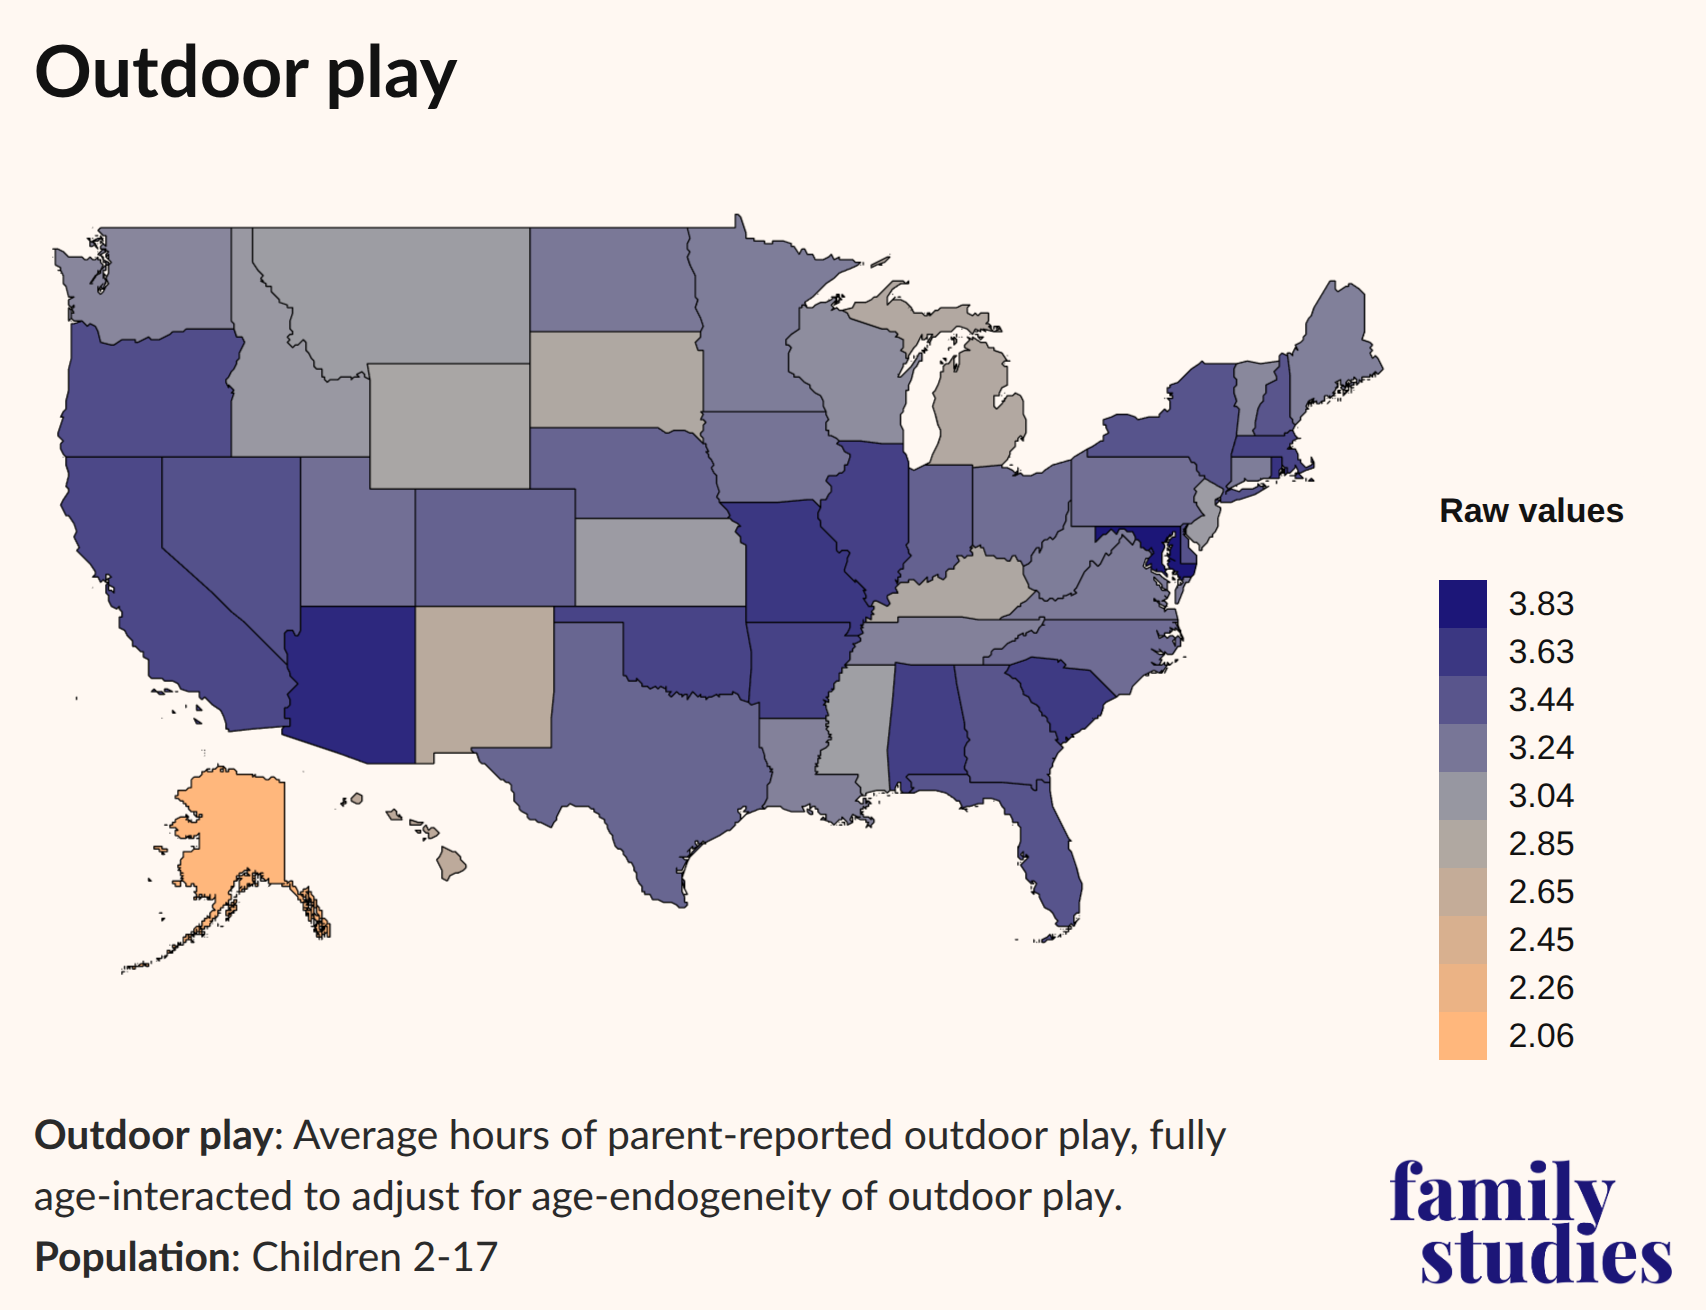
We find lower outdoor playtime in many of the more northern states, especially Alaska, Michigan, or South Dakota, and more outdoor playtime in many of the more southern states, like Arizona, South Carolina, Missouri, or Alabama, as well as Maryland.
Our survey reveals a strong association between time spent outdoors and teen mental health. Teens who play more outside, we find, are happier. This is very likely to remain true even if indoor play is weather-related (and not a result of parenting style): rainy days cooped up inside are simply no fun for kids. Thus, even if our overall results for outdoor play are shaped by weather and season, we expect that the implied effects on kids would still materialize.
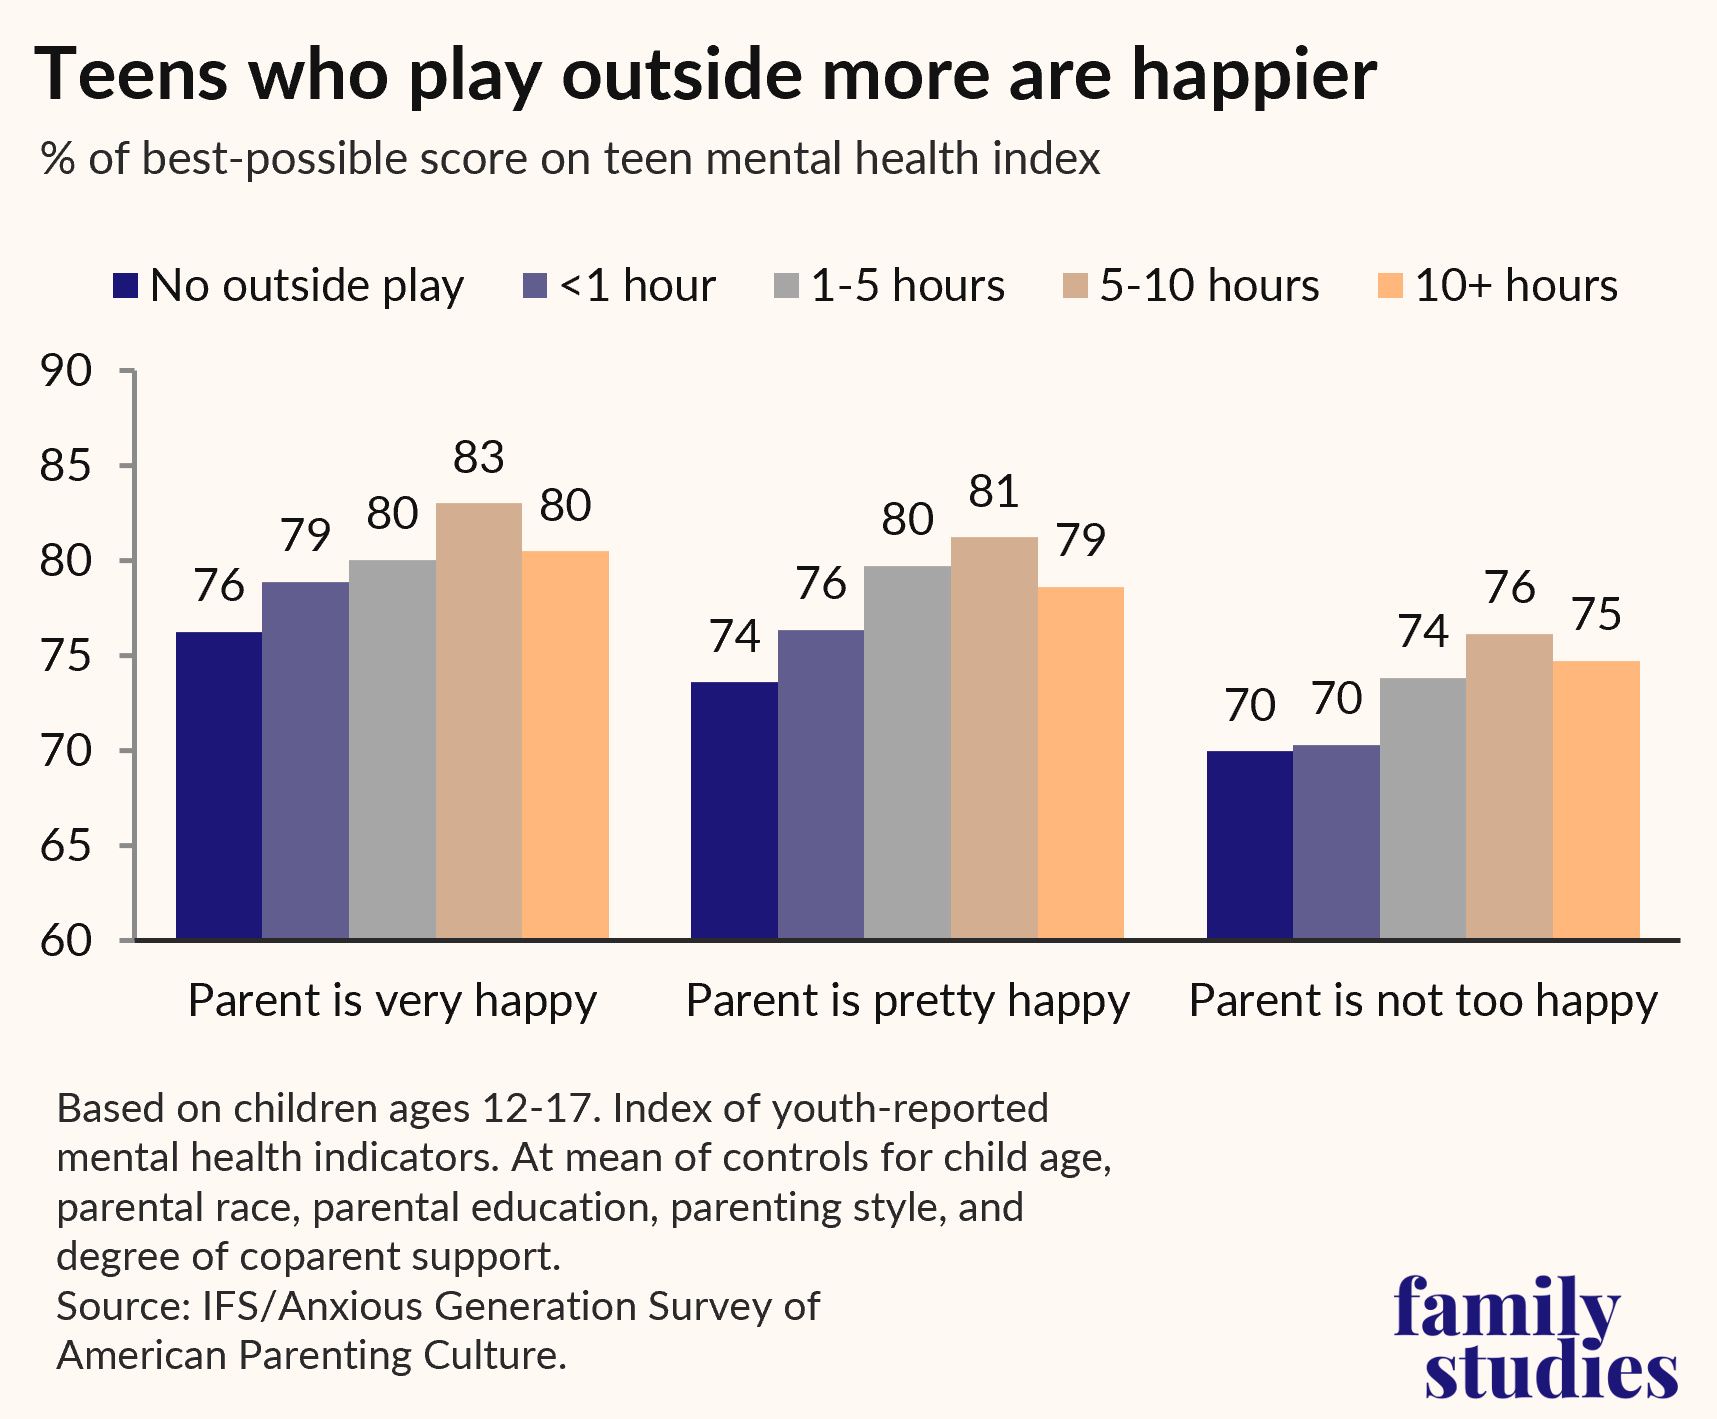
We find, once again, that the relative benefits of outdoor play to child happiness are strongly influenced by the well-being scores of their parents. Parents who are happy have children who are made happier by outdoor play compared to parents of children who are not too happy.
Next, we wanted to visualize how far parents across the country allow their children to travel unsupervised. These approximate distances are converted from answers supplied by parents themselves in which they estimate the permissible range of their child’s mobility. But since these values are approximate, our map below shows broad state ranks. Because, again, the distances children are allowed to walk are highly variable by age, we fully control for age.
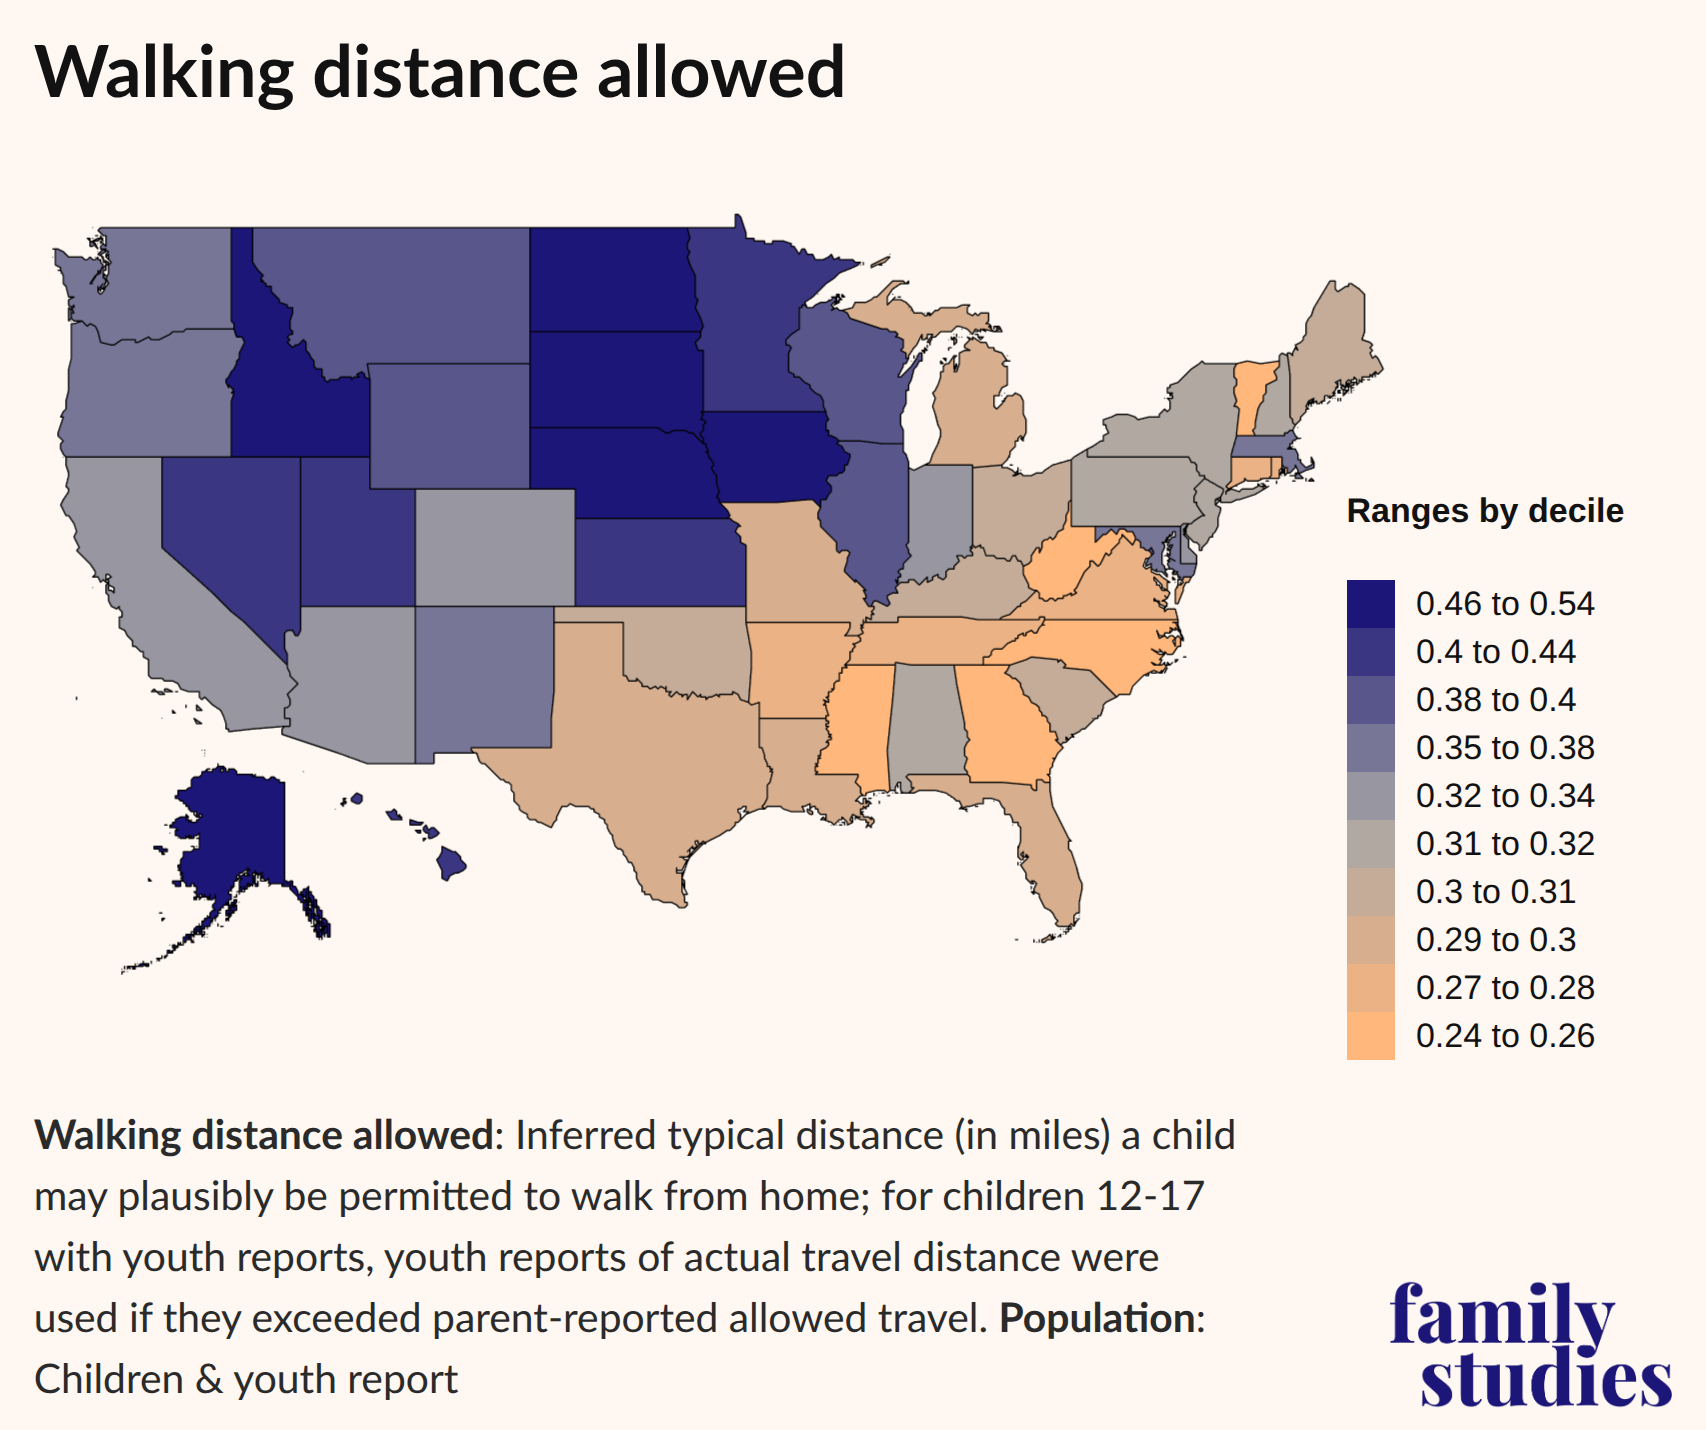
Clearly, there are strong regional patterns, with the mobility of children in the Southeast being highly restricted, children in the Northeast and Midwest somewhat less restricted, and children in the Upper Midwest and West permitted to walk farthest. This map presents some interesting contrasts with the earlier map of estimated outdoor play. For instance, in some northwestern states—at least at the time of the survey—we see that kids do not have much outdoor play, but their parents nonetheless afford them considerable freedom to move around.
When looking at our national sample as a whole, we show in the figure below the typical number of miles from home that American children at each age are permitted to walk or bike without an adult accompanying them:
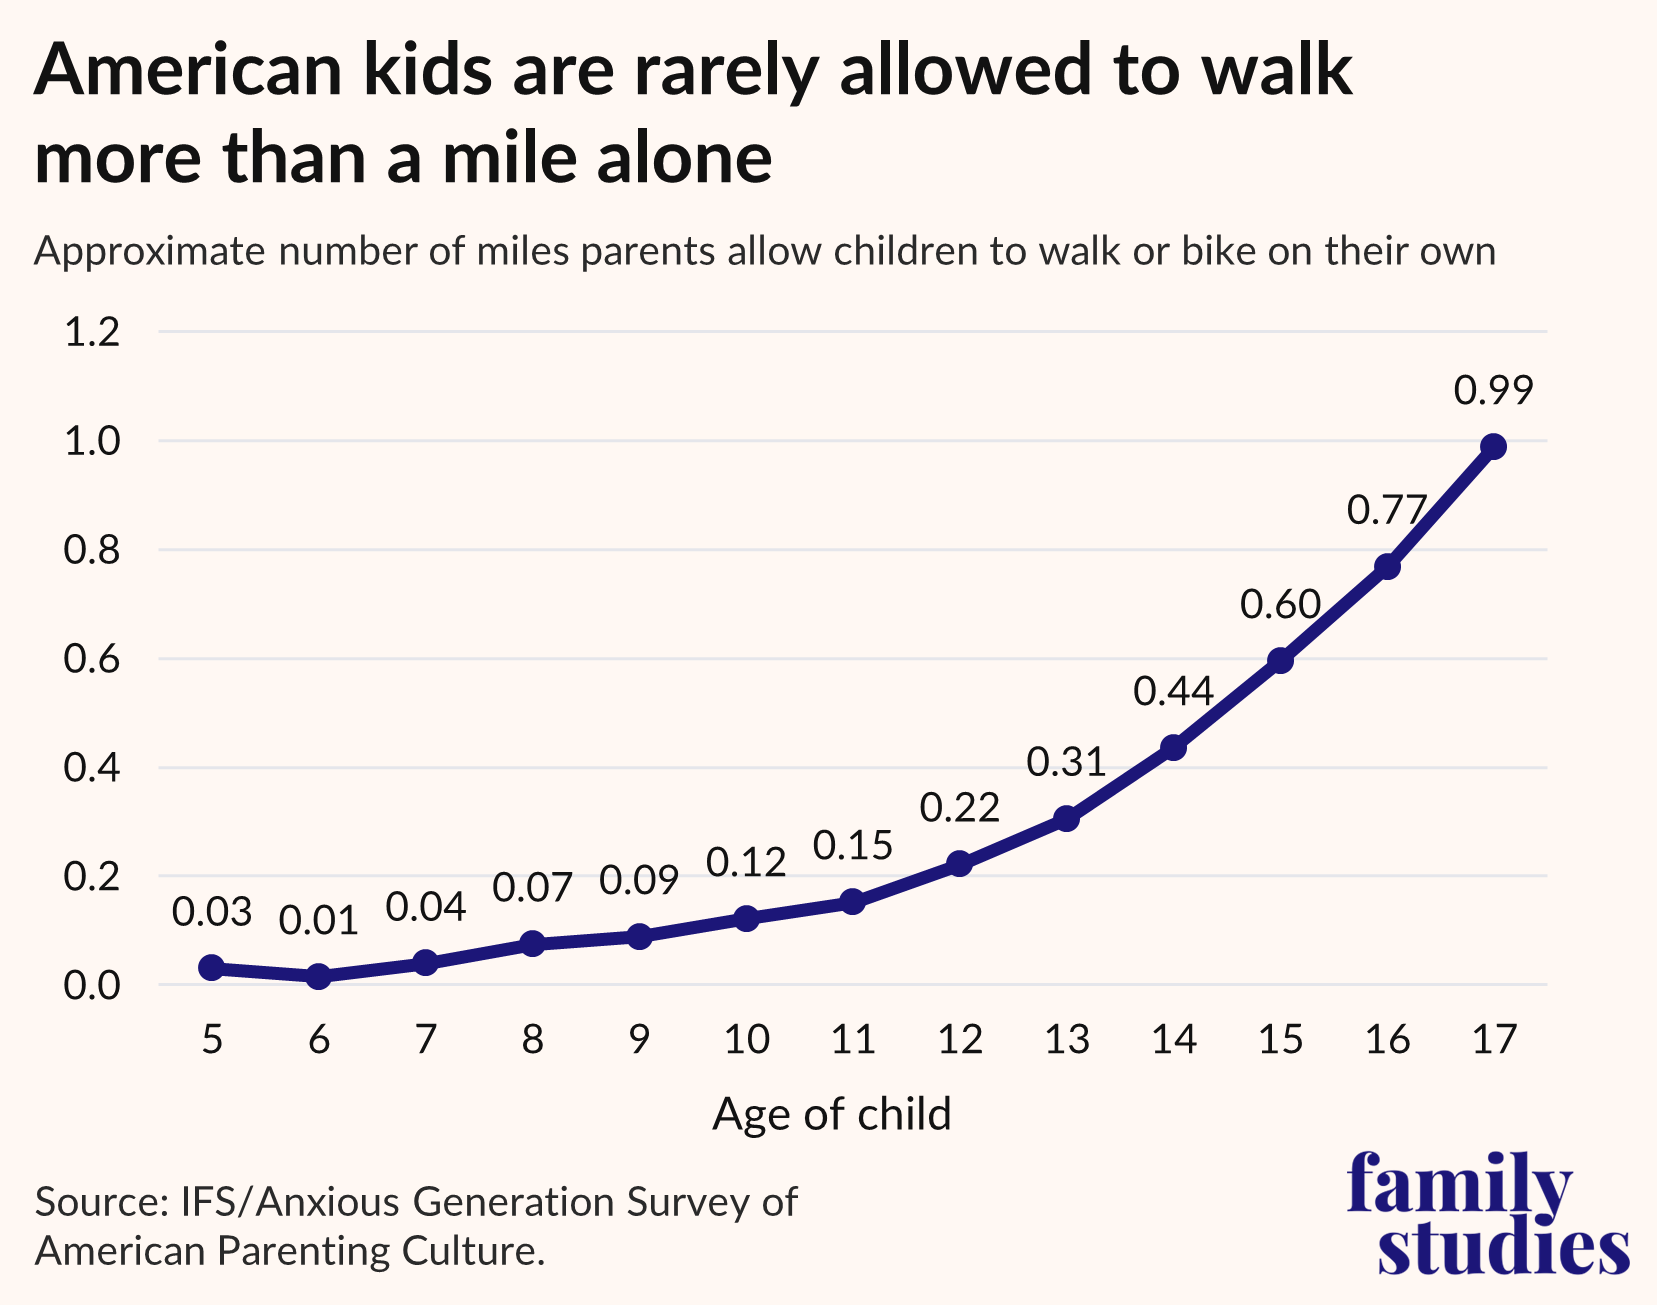
It’s not until age 8 or 9 that the average American family allows a child to go more than 100 yards from his or her house, and by age 17, practically adulthood, large shares of parents still report that they place limits on how far from the house their kid can walk or bike alone.
Finally, we tested whether there are regional or state-level differences in how parents feel about the amount of unsupervised play for children ages 8 to 12. Do parents feel that children should have more time with unsupervised play, or do they believe they need more parental supervision? This question is designed to measure the extent to which parents across the country support higher or lower levels of autonomy for children.
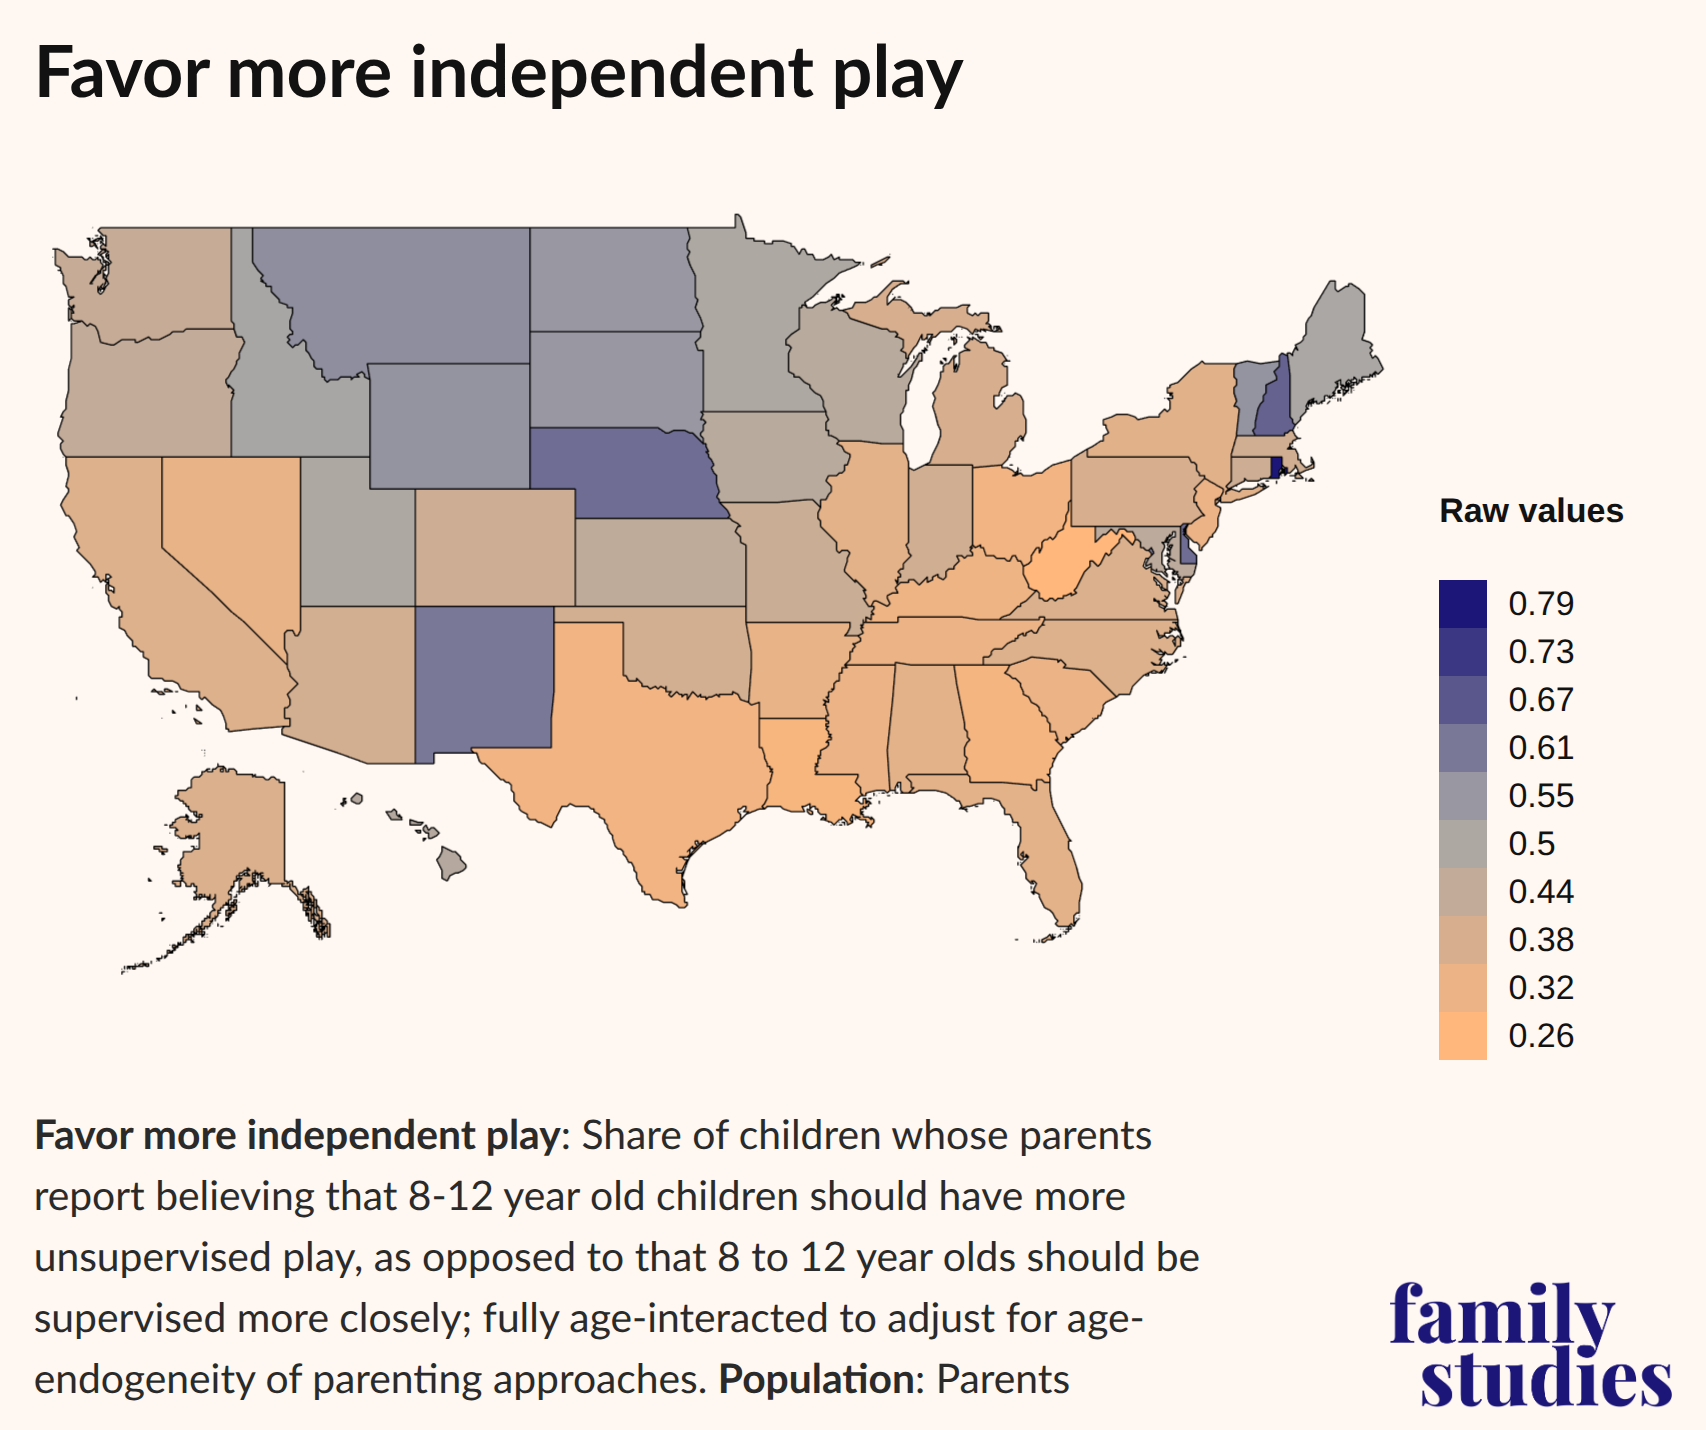
These patterns are surprising. In most of the country, parents actually believe that 8- to 12-year-olds need more hands-on adult supervision, rather than less. Being close observers of parental attitudes toward play and technology, our sense of the national mood is that parents are hungry for fundamental change. But, at least on the question of increasing supervised play, that seems to largely not be so. In fact, states where parents desire more unsupervised play appear to be the exceptional cases. Time will tell if these states turn out to be cutting edge on the issue; but as can be seen, in much of the Plains and Mountains region, and in Upper New England, parents tend to think 8- to 12-year-olds should be given more autonomy. But throughout the South, the Pacific, the Midwest, and even some of the Northeast, parents believe 8- to 12-year-olds need more intense supervision than they currently have. In other words, outside of exceptional pockets, parents who wish to cultivate independent children can expect to face headwinds in much of the country.
Children’s Social Lives
Recently, in an interview, Meta CEO Mark Zuckerberg offered the company’s rationale for offering AI companions to consumers. The “average American has fewer than three friends,” Zuckerberg said, whereas the “average person has demand for meaningfully more—I think it’s like 15 friends.” Artificial Intelligence, Zuckerberg implies, will fill in that gap.
There are all these things that are better about physical connections when you can have them…. I think that a lot of these things that today there might be a little bit of a stigma around [such as AI girlfriends, therapists, and friends], I would guess that over time we will find the vocabulary as a society to be able to articulate why that is valuable.
While Zuckerberg’s words are shocking, he points to a profoundly important social reality: Americans have fewer friends than ever before. They are also spending less time in-person with friends overall.
We wanted to use our sample to learn more about this social trend and see whether there are important regional or state-level differences in how often children socialize.
It turns out there are. For this study, we limited our discussion to data on children’s time spent in-person socializing with friends (not including school) as reported by parents, and their time spent engaged in competitive sports. In the interactive maps, readers can view data on friend counts by state, but our findings suggest that the number of close friends that teenagers report having increases from 3.1 at age 12 to 3.8 by age 17. Friendship networks may be most robust at the end of high school before deteriorating in adulthood, thus producing the “fewer than three friends” measure Zuckerberg noted.
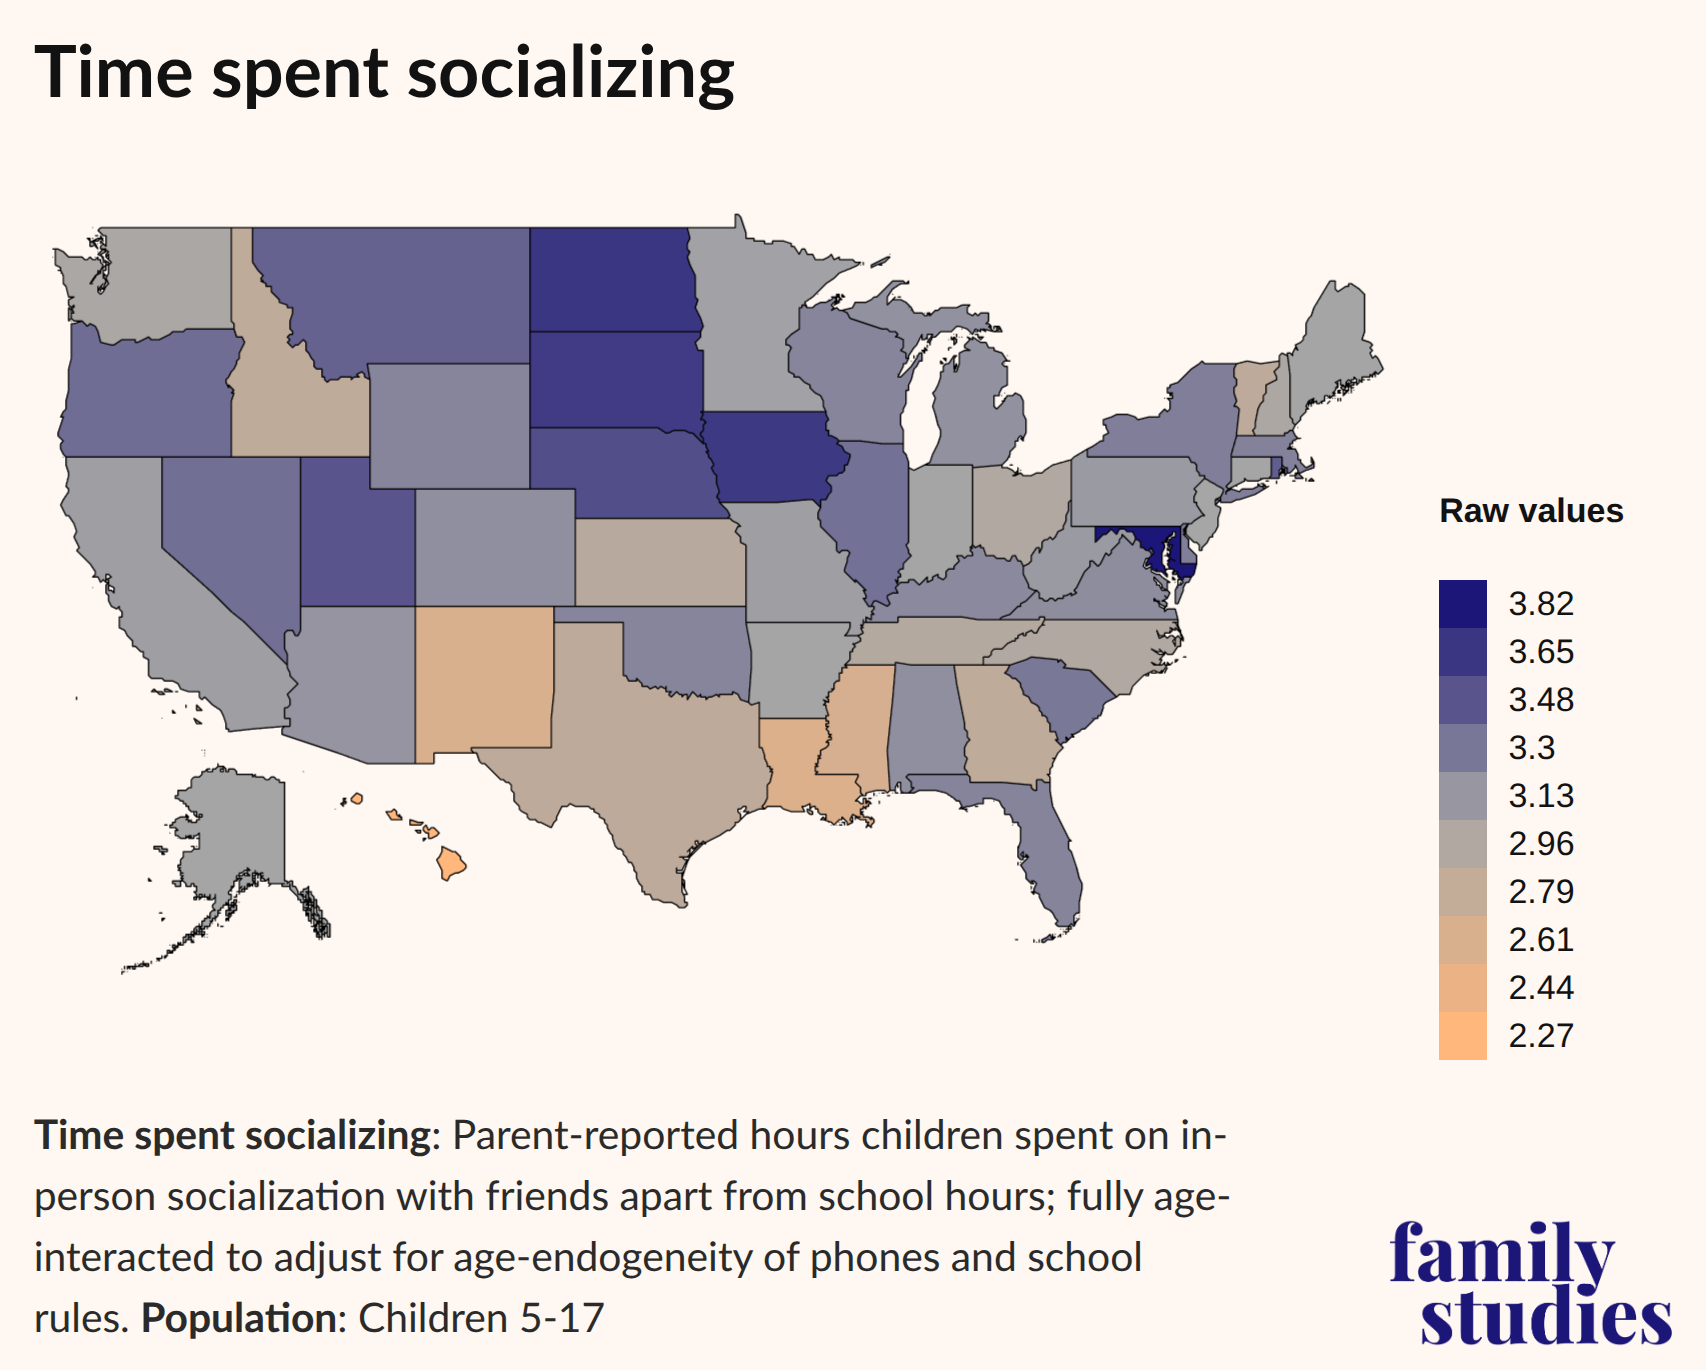
Like the previous map (i.e., “Favor more independent play”), we see that parents in the Plains and Mountain states tend to report that their children spend relatively more time with their friends. It is perhaps important that the states that foster the most in-person time among children (more than three hours per week) are also the same states that most strongly believe that children need more autonomous play and allow children the most freedom of movement.
There is also an interesting overlap between states that report that children spend less time socializing and those that believe they need more supervised play. Children in the South, in other words, have considerably lower levels of time spent socializing, and parents there also tend to believe that children should get less autonomy. But much of the Midwest and Northeast show up as relatively “high socializing” places, too, at least compared to the very low rates of socializing in the South.
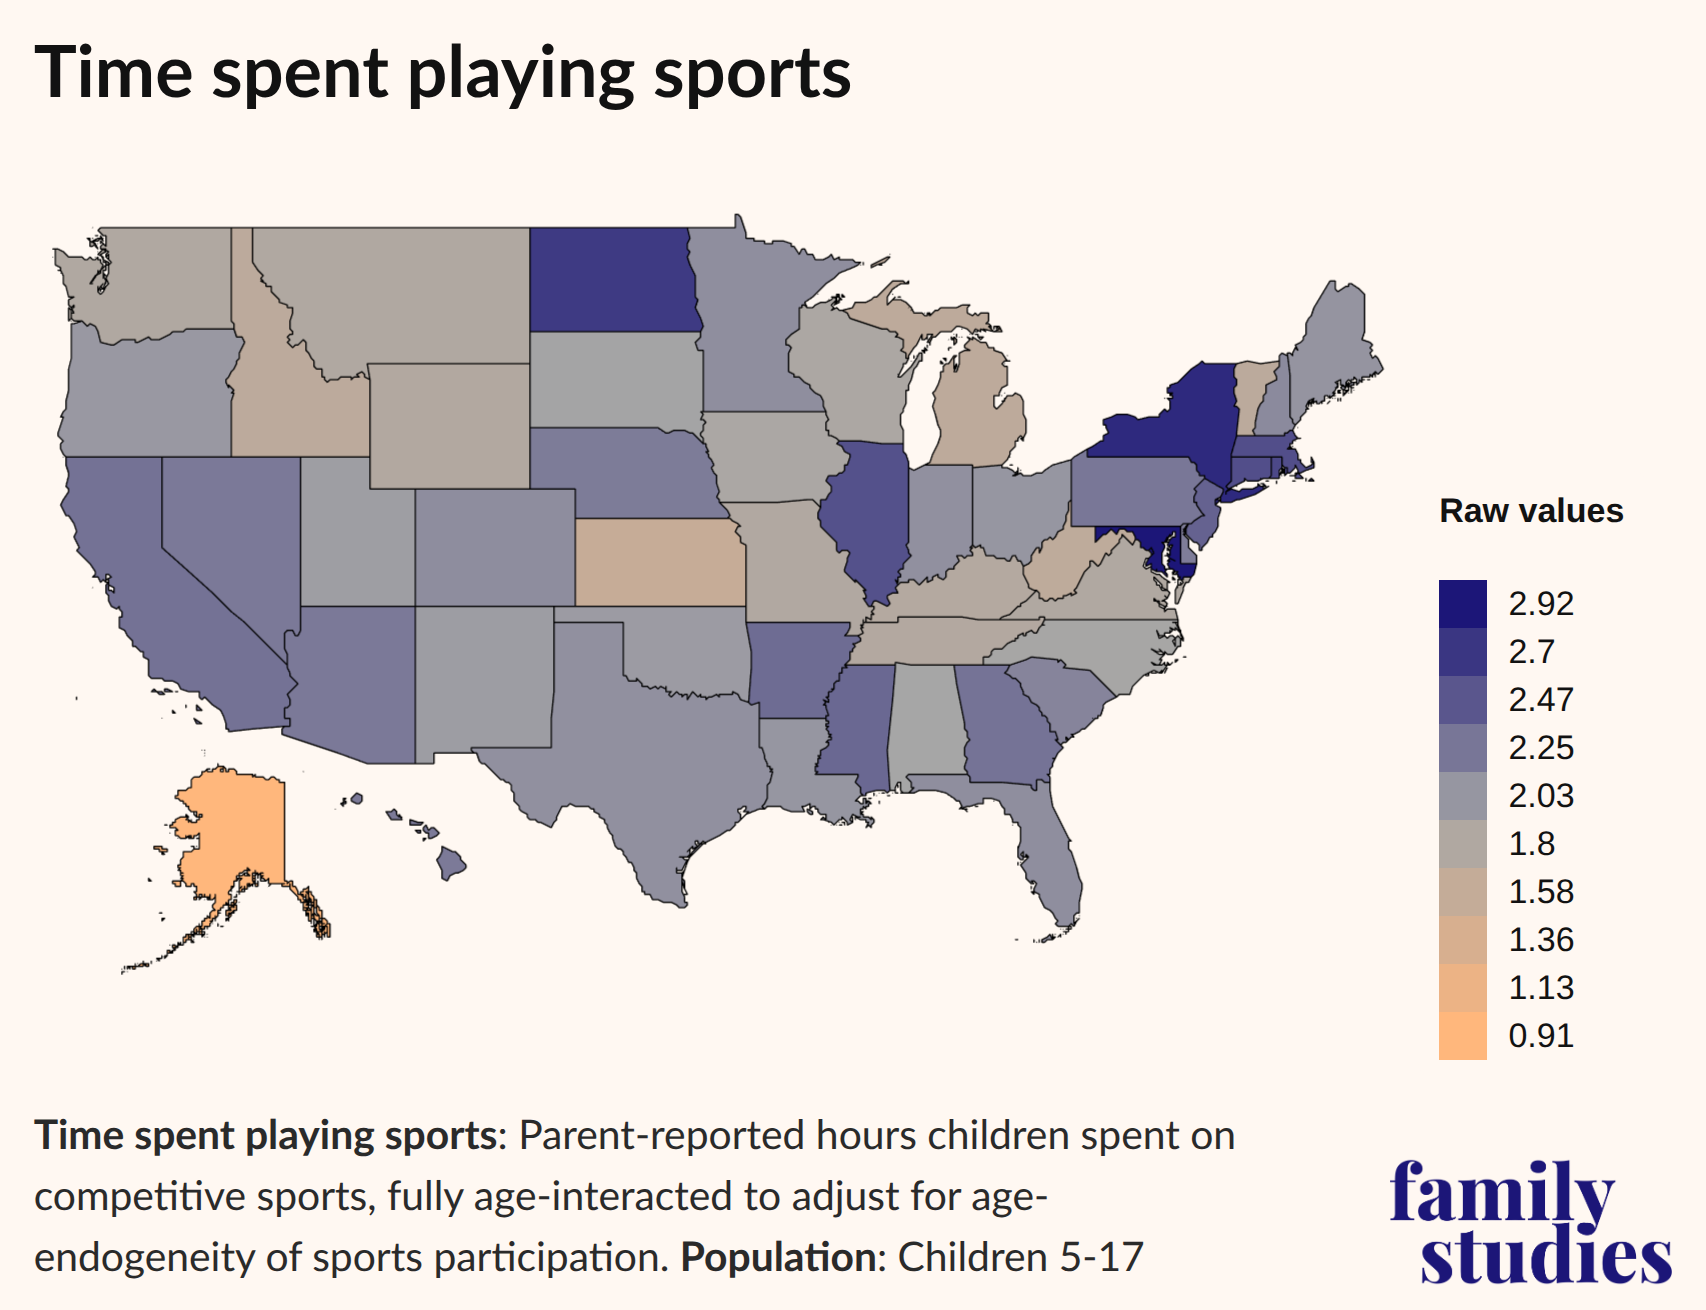
Finally, our examination of athletic activity presents some new patterns, when compared with the two previous maps. The Northeast, which also favors more independent play, stands out, with children there being highly engaged with sports. North Dakota, likewise, which scores high on time spent socializing and favoring more independent play, also scores high on time spent playing sports. But the deep South—which scores low for the variables covering independent play and time spent socializing—shows elevated levels of competitive sports. The Eastern Seaboard, as a whole, favors children spending time on sports. The Eastern Seaboard is not known as a locus of childhood athletics, but it’s worth noting that this is especially true for sports among kids in elementary and middle school, with less extreme gaps (compared with other regions) for high school sports.
Resilient Childhood
To get a picture of the overall experience of childhood in America, we created the “Resilient Childhood Score” (RCS). In the RCS, states score higher if their children have more independent activity and more outdoor play, report a broader range of life experiences, have more social time with friends, and receive less adult supervision. States score lower if kids have more devices, more social media accounts, spend more time online, or if the family (for a variety of reasons) does not limit screen time.
Across the dozens of indicators measured, some were correlated with each other, others were not. And, of course, some states had large samples allowing us to make very confident statements about our results (New York, California, Texas, Florida, etc.), while other results may be less reliable due to small sample sizes (Rhode Island, North Dakota, Hawaii, Wyoming, etc.). Nonetheless, given our overall large sample sizes and the wide range of indicators measured, we are confident that the broad contours shown for the RCS are correct.
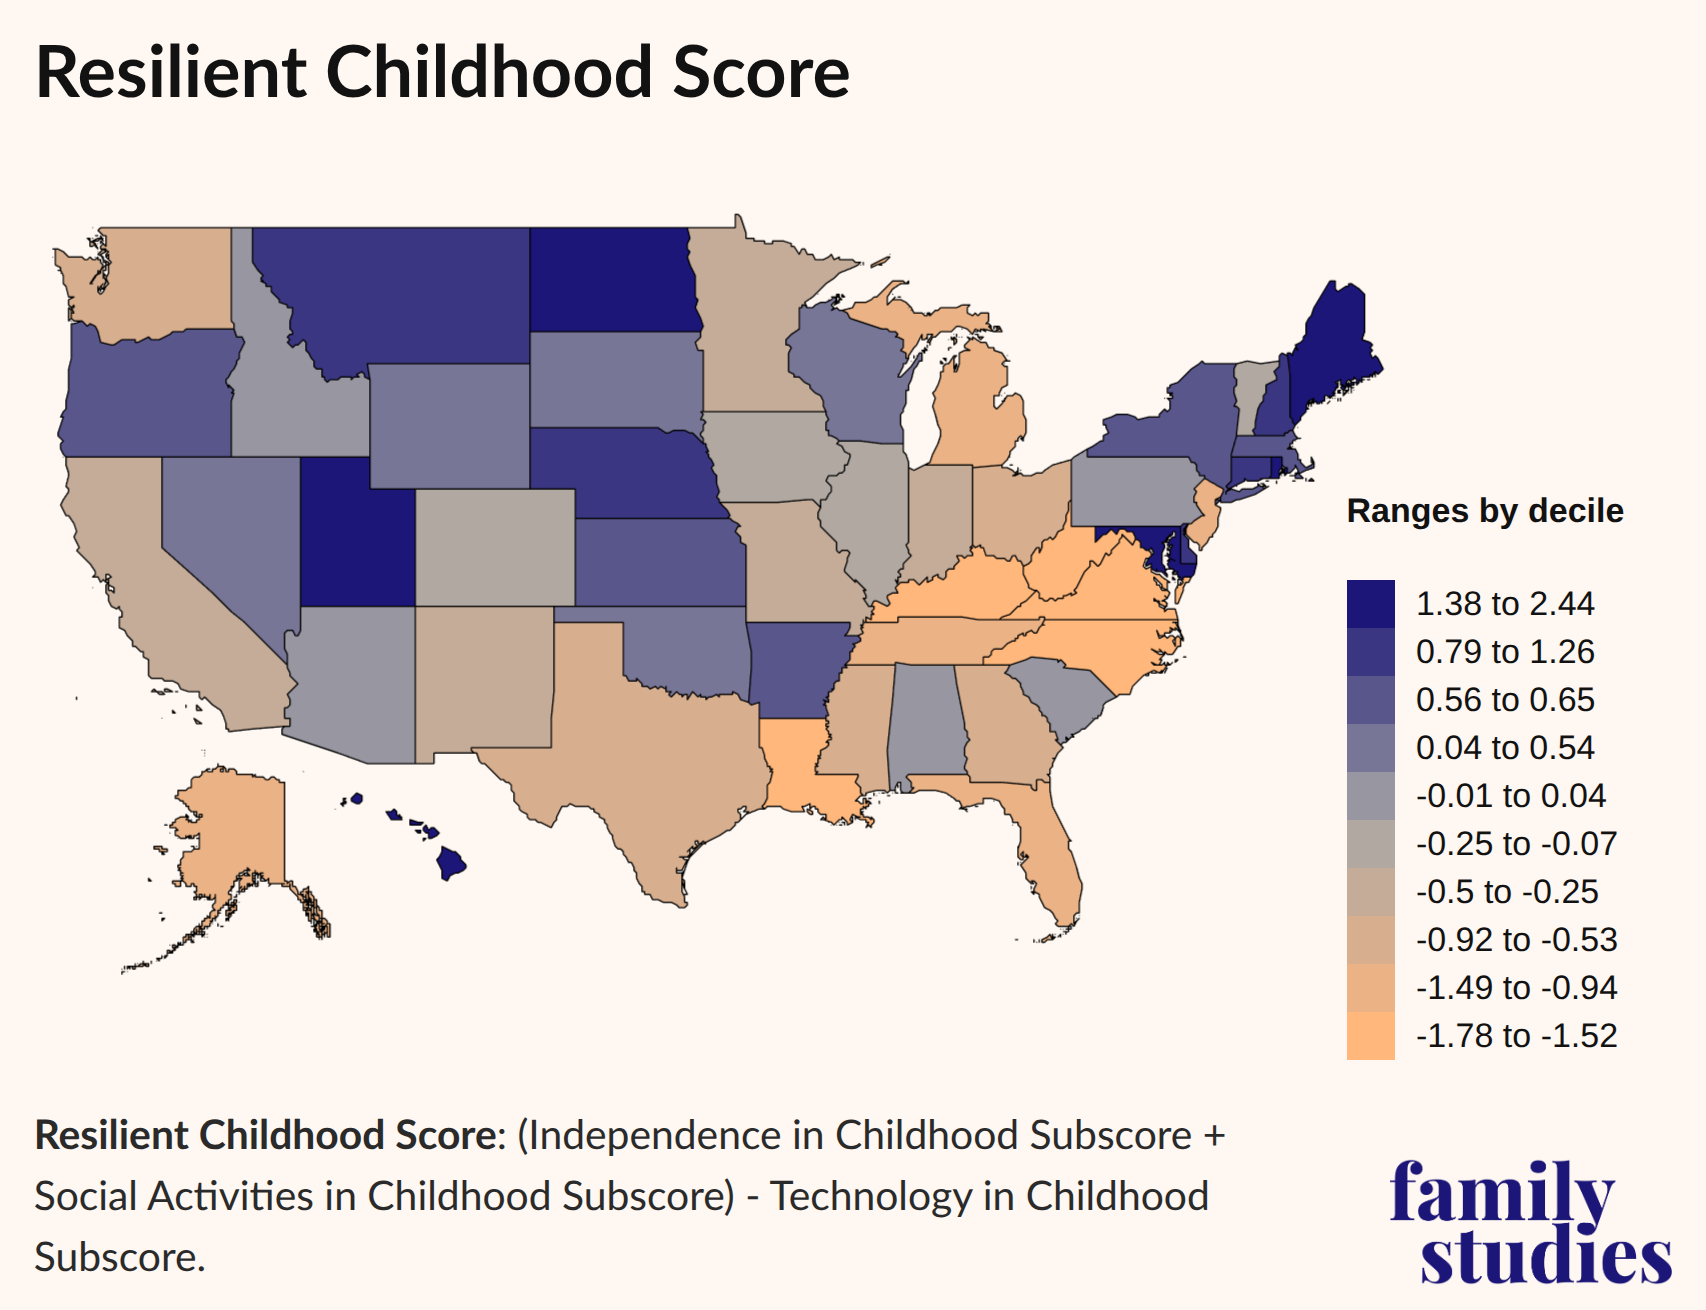
We must admit that we did not anticipate the results of the RCS. The red-state heartlands on the Great Plains, as well as Utah, stand out for their high RCS. But so do the blue states of the Northeast as well as Hawaii. The states where children have the least independence, least diverse social lives, and most tech use, are also hard to typify in regional terms: Louisiana, Kentucky, West Virginia, Virginia, North Carolina, New Jersey, Michigan, Florida, and Alaska. Some of those may reflect small or unrepresentative sample sizes (especially Alaska), but the broad trends are likely to be correct. For reasons that are beyond the focus of this report, the states around Southern Appalachia typify parental norms that fail to foster resilient children. The same is true for several other states in the South and Midwest.
To briefly summarize, the RCS gives us a view into the various parenting and childhood cultures of states and regions in the United States. If parents want to raise their kids to be “high play and low tech,” what degree of resistance from their surroundings will they experience? Will they face strong opposition, modest opposition, or is there even the possibility that the current might move with them? Our broad read of American culture is that every community (save a few shining examples) can be doing better and more for their kids—and many places are seeking to do that very thing. But what these findings tell us is that there are some localities where the work of “doing more” as parents may be harder than others.
The Experience of Parenting
One of the broad findings of this report is that the experience of parenting resilient children is rather challenging in much of the country, despite the fact that there are some regions that are less resistant to it. In this section, we will explore parents’ experiences as well. How do parents evaluate the challenges of their own parenting styles? Do they find their approaches (whatever they may be) to be “very easy” or “very hard”? We asked them.
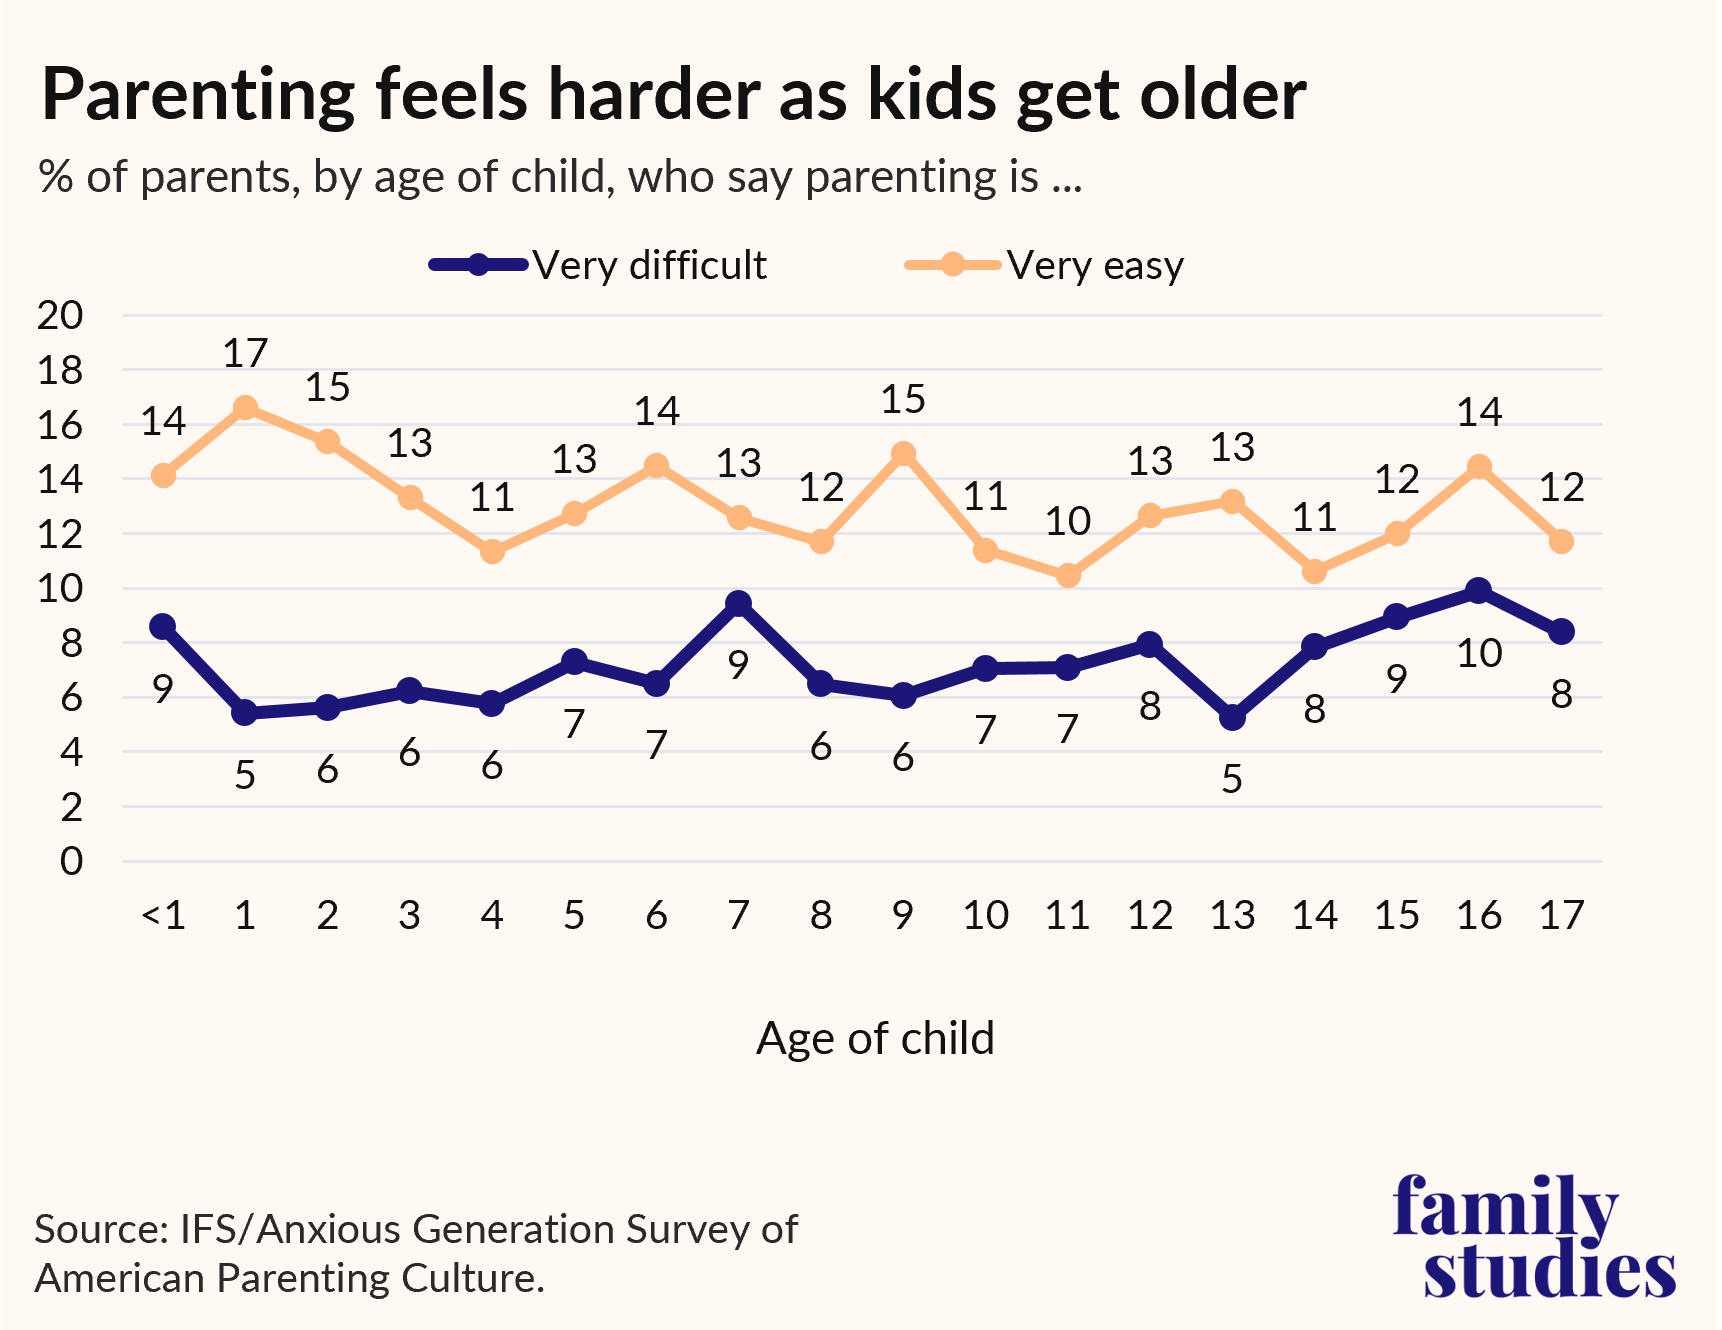
Here, we show an overall view of how parents nationwide feel about parenting by children’s ages. American parents perceive the difficulty of raising children to peak in infancy, then they feel the difficulty decline, before it rises again as children grow older. Contrary to some popular narratives that parenting toddlers is the most difficult, parents tend to describe those early years as being “as easy as it gets.” But where do parents feel that parenting is easiest and where do they feel it is hardest?
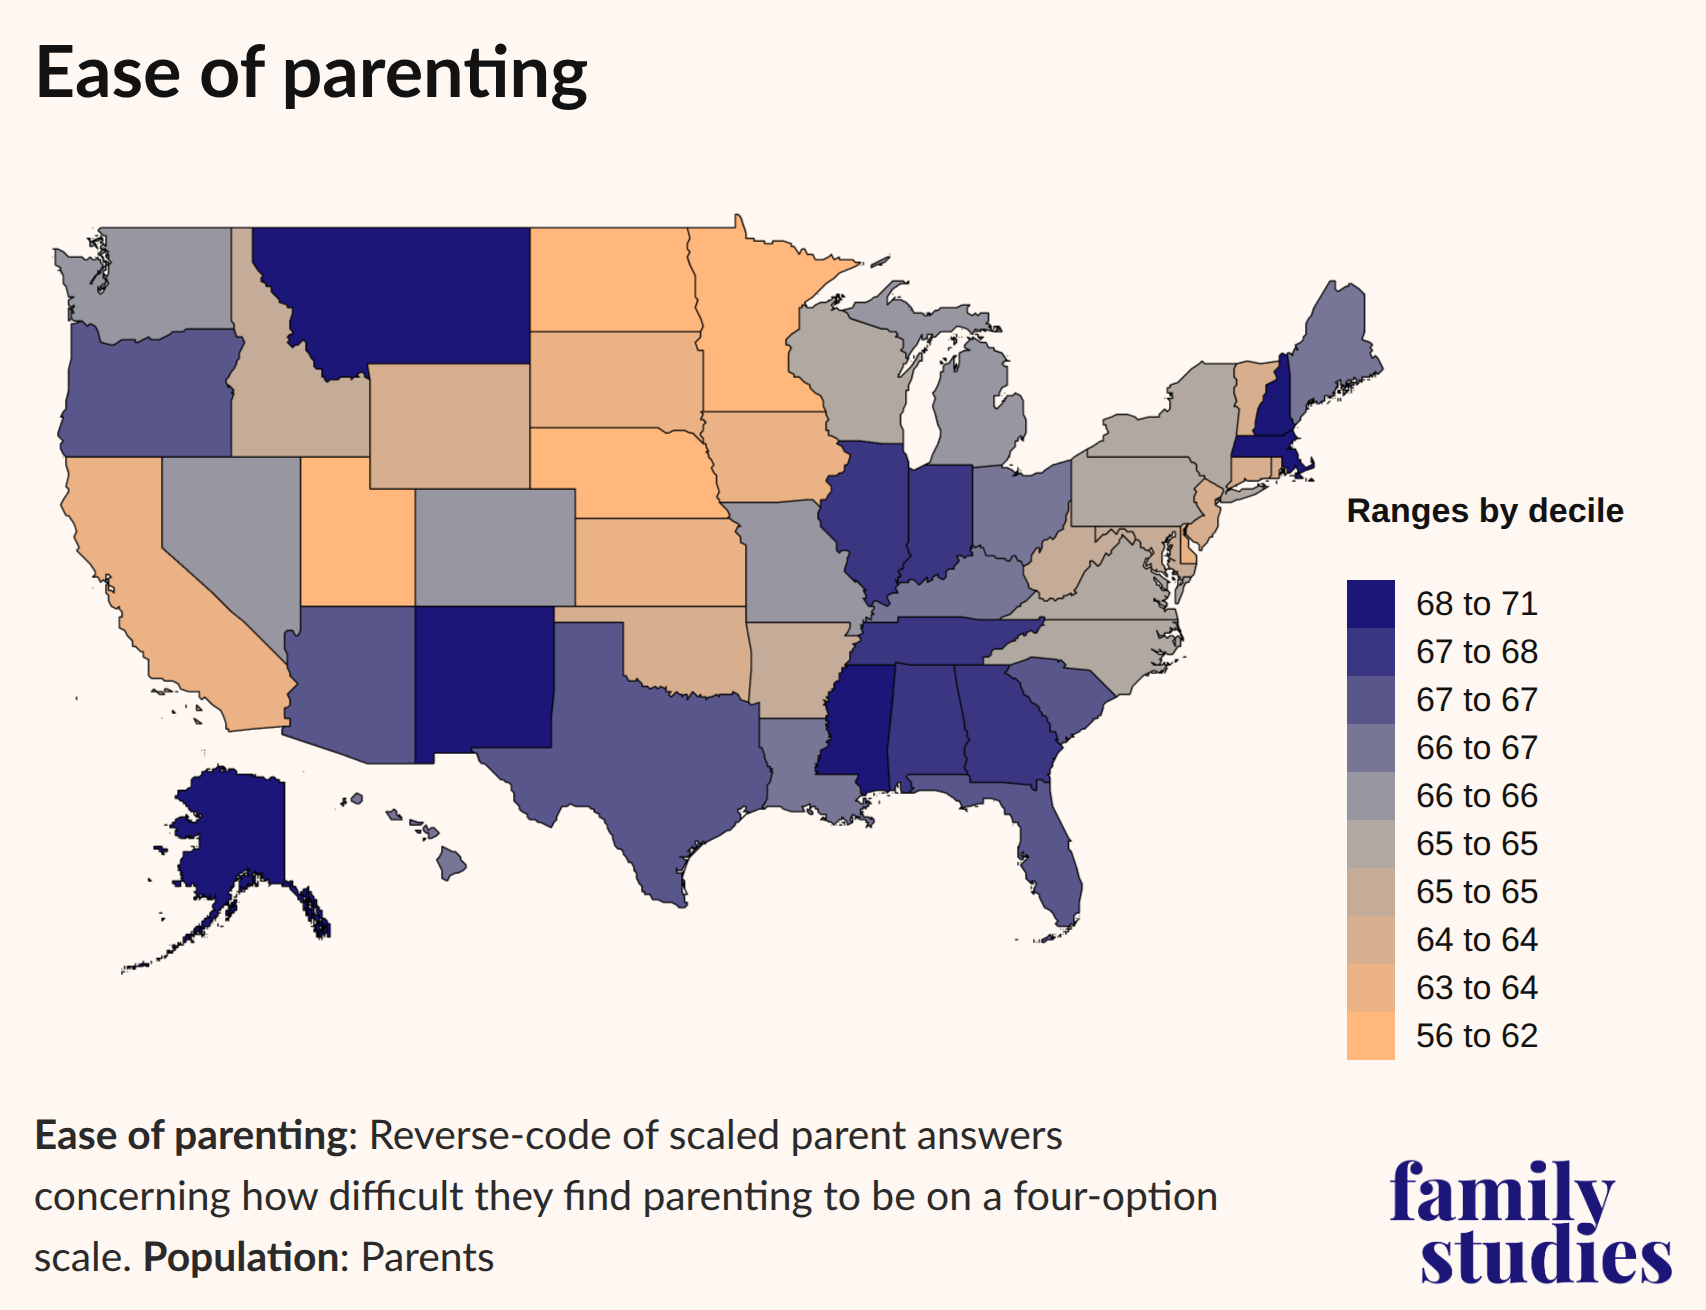
Parents feel that the work of raising children is easiest in Upper New England, the Deep South, the Midwest, and the Southwest. Parenting feels hardest along the Eastern Seaboard and in the Great Plains, while the Mountain states provide a mixed experience.
When compared with our Resilient Childhood Score, some interesting patterns emerge. What particularly stands out is that many of the states and regions that placed high on the RCS tend to score low on ease of parenting. The inverse is also true. States that ranked low on the RCS tend to rank more highly on ease of parenting. The simplest explanation for this is that raising resilient children is immensely challenging even if your community might be home to more parents that share your values.
Community, as it happens, is another way to analyze the experience of parenting to get a better grasp of how one family’s parenting approach integrates (or fails to integrate) into the wider community. We directly asked whether parents feel that they receive support from their community in raising their kids or not, as well as a series of other questions about the extent to which they feel criticized or judged for their parenting.
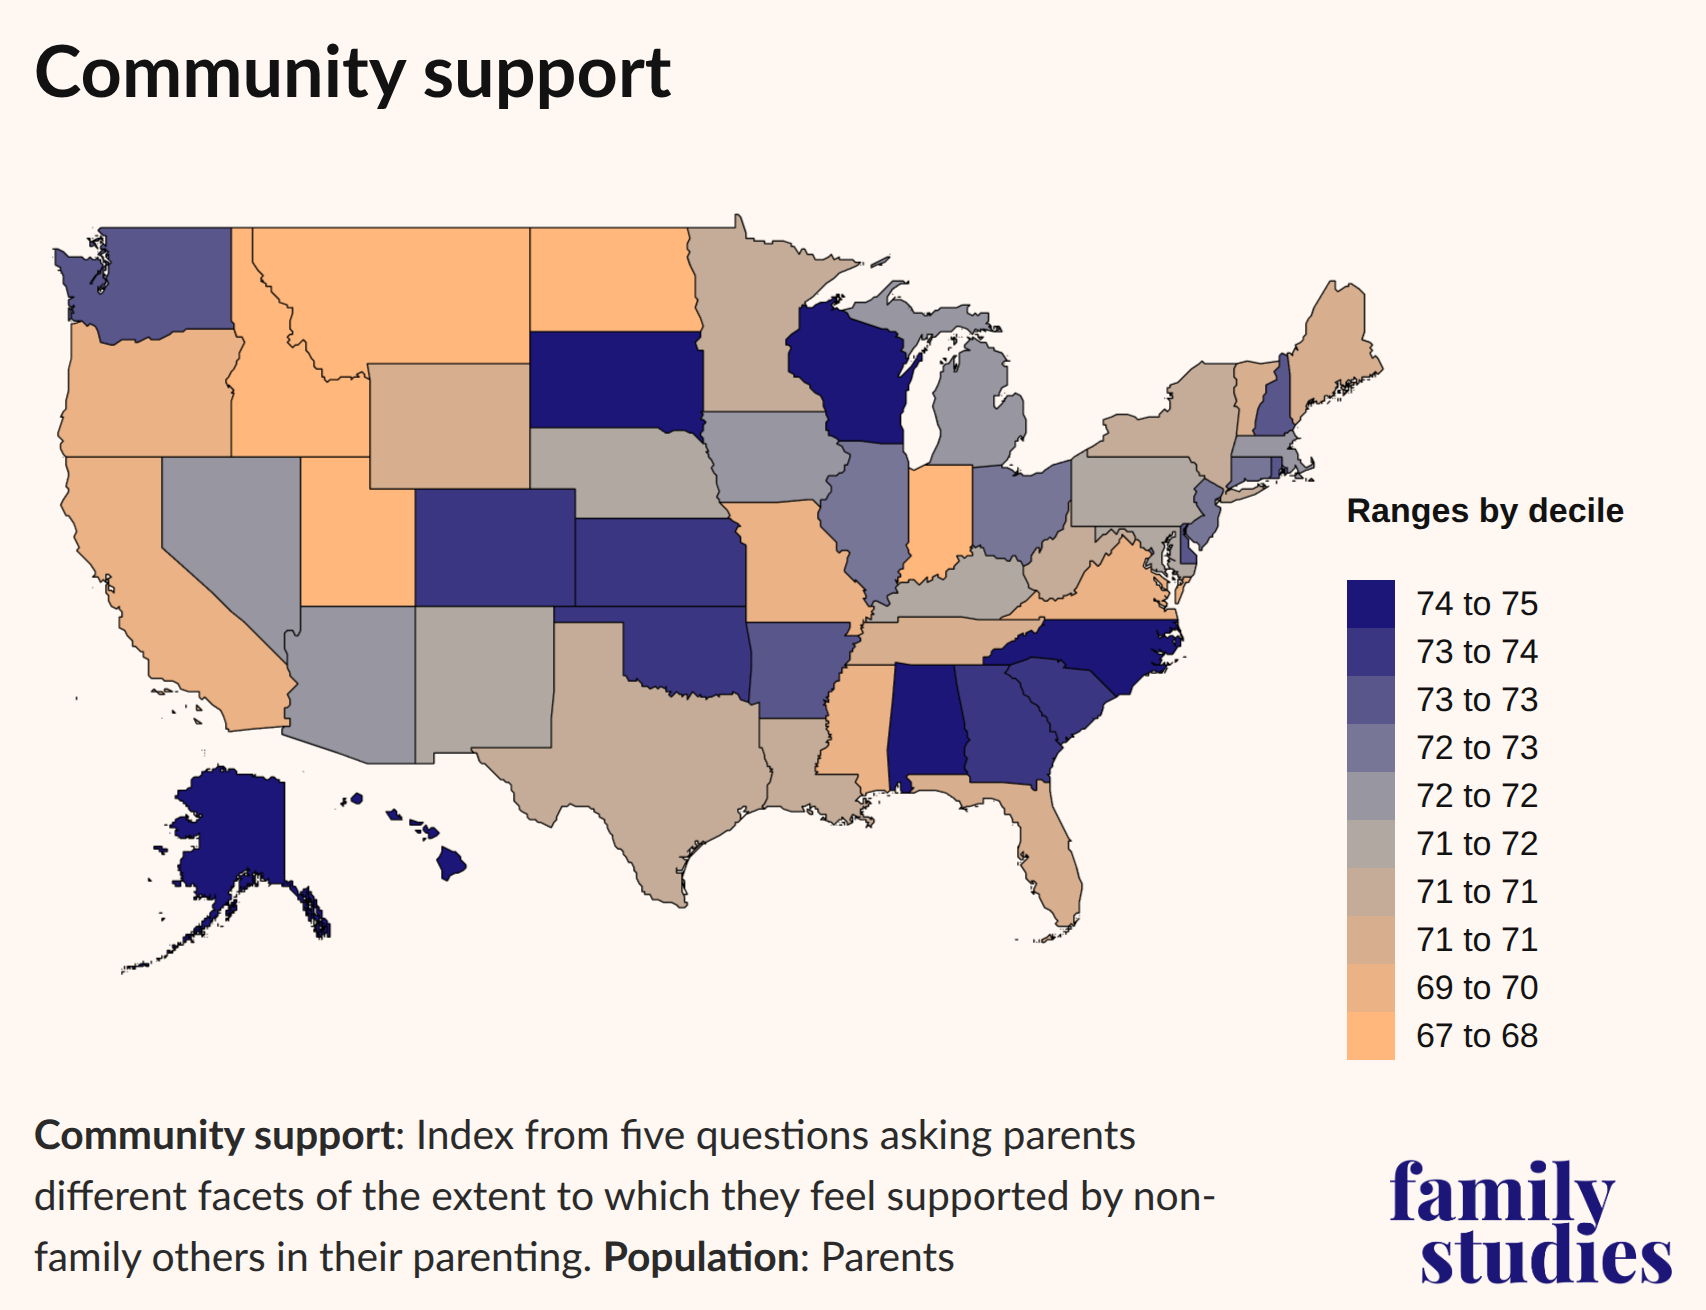
Here, comparisons with earlier analyses are less neat. Some places, such as in the Southeast, report strong community support and that parenting is relatively easy (it also received a low RCS). But other areas, such as the Southwest, which scored high on ease of parenting, are much more mixed on community support. The Northeast, furthermore, scored low on community support, but high on the RCS. In sum, while community support is certainly important in making parenting easier, it’s not a silver bullet. Some parents get a lot of support and thus parenting is easier, but some parents get little support and still feel parenting is easy; the opposite relationships occur, too.
But is it possible to get a sense of the overall parenting experience across America? We think so. Using these above indicators alongside many others (such as a score of how many topics parents worry about; the extent to which their partner is supportive of parenting; the extent to which they see parenting as a joy vs. a burden, etc.), we can combine a wide range of such questions about the joys and challenges of parenting. With these variables, we created a “Parental Experience Score” (PES), which measures the extent to which parents in a state report positive experiences as a parent with various communal supports.
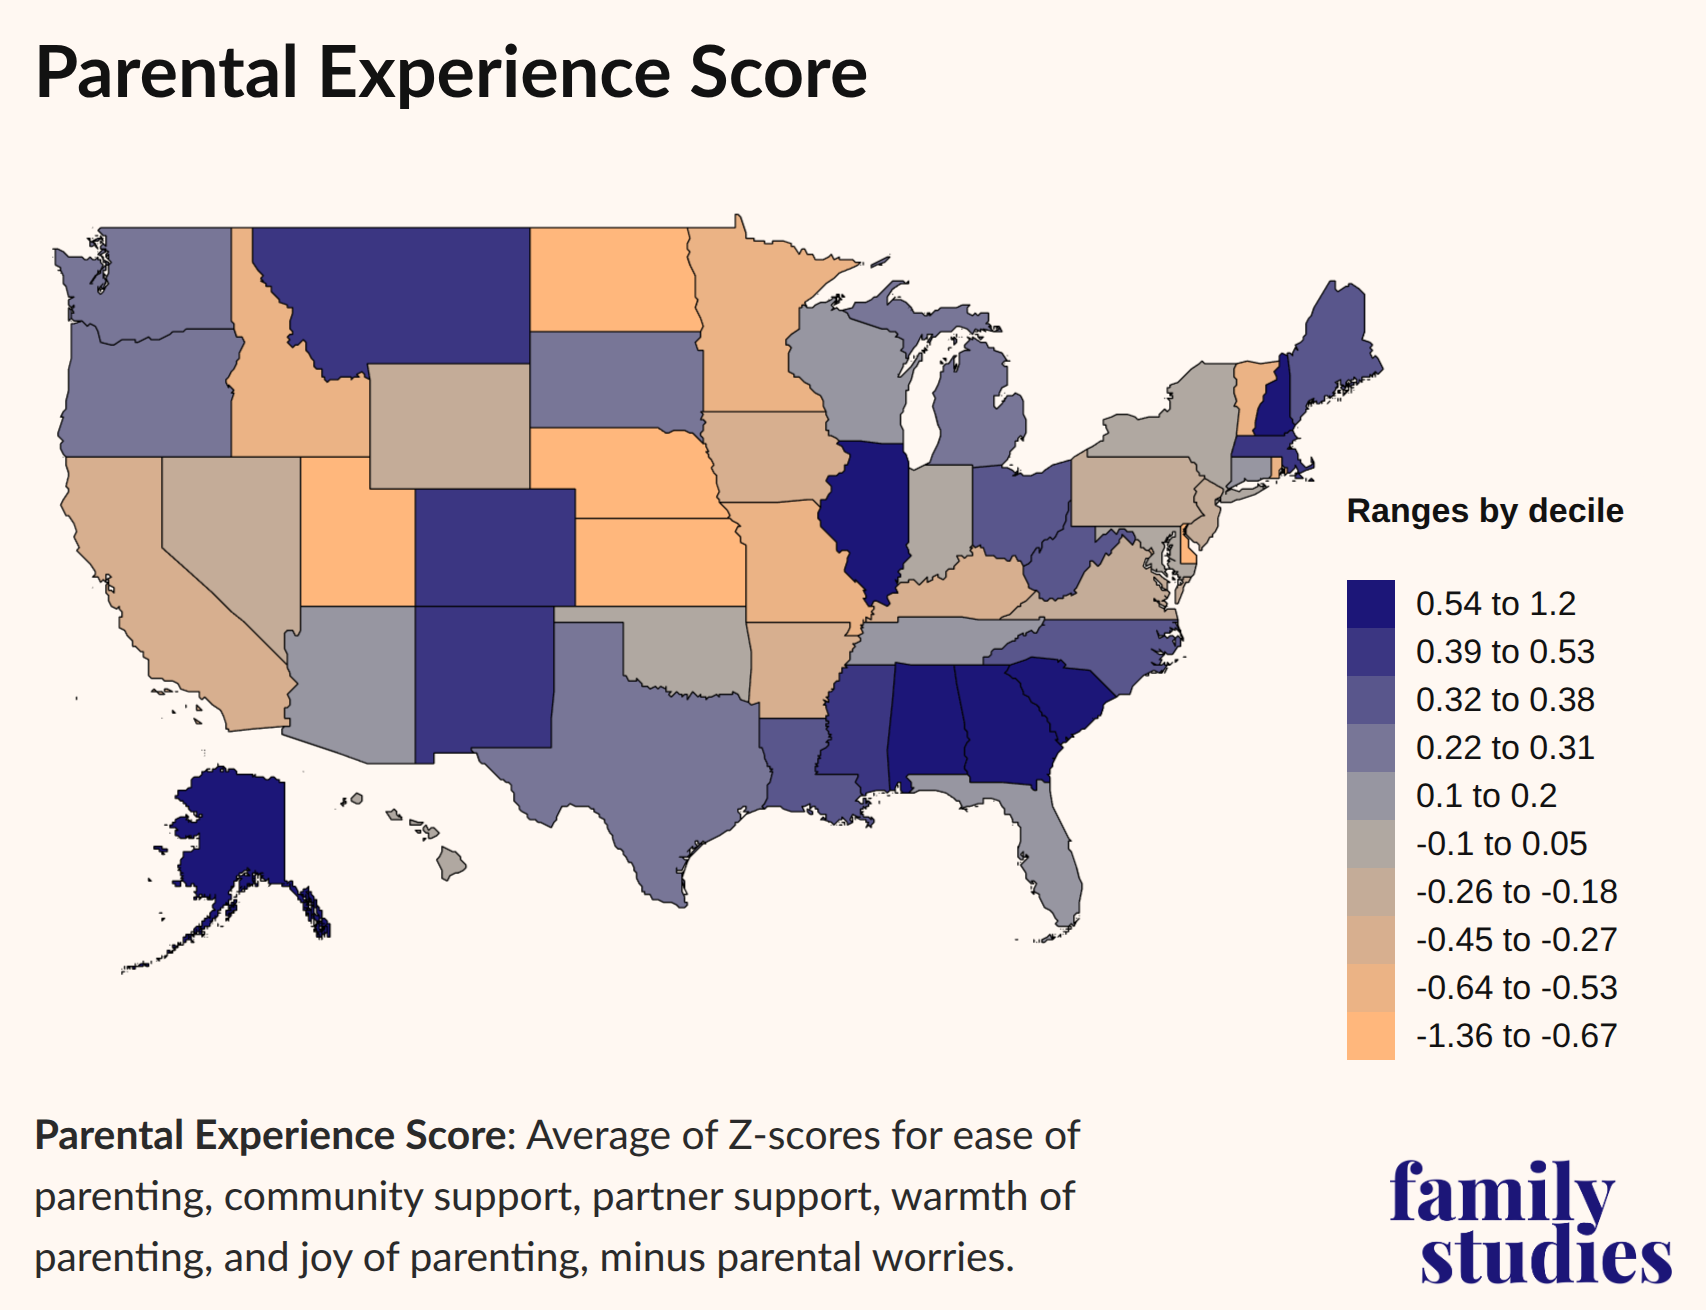
Parents in the South are most likely to have a high PES, suggesting that they have the most subjectively positive experience of parenting. But, again, it’s worth comparing our Parental Experience Score to our Resilient Childhood Score. Are states with more resilient childhoods also states with more positive or negative parental experiences?
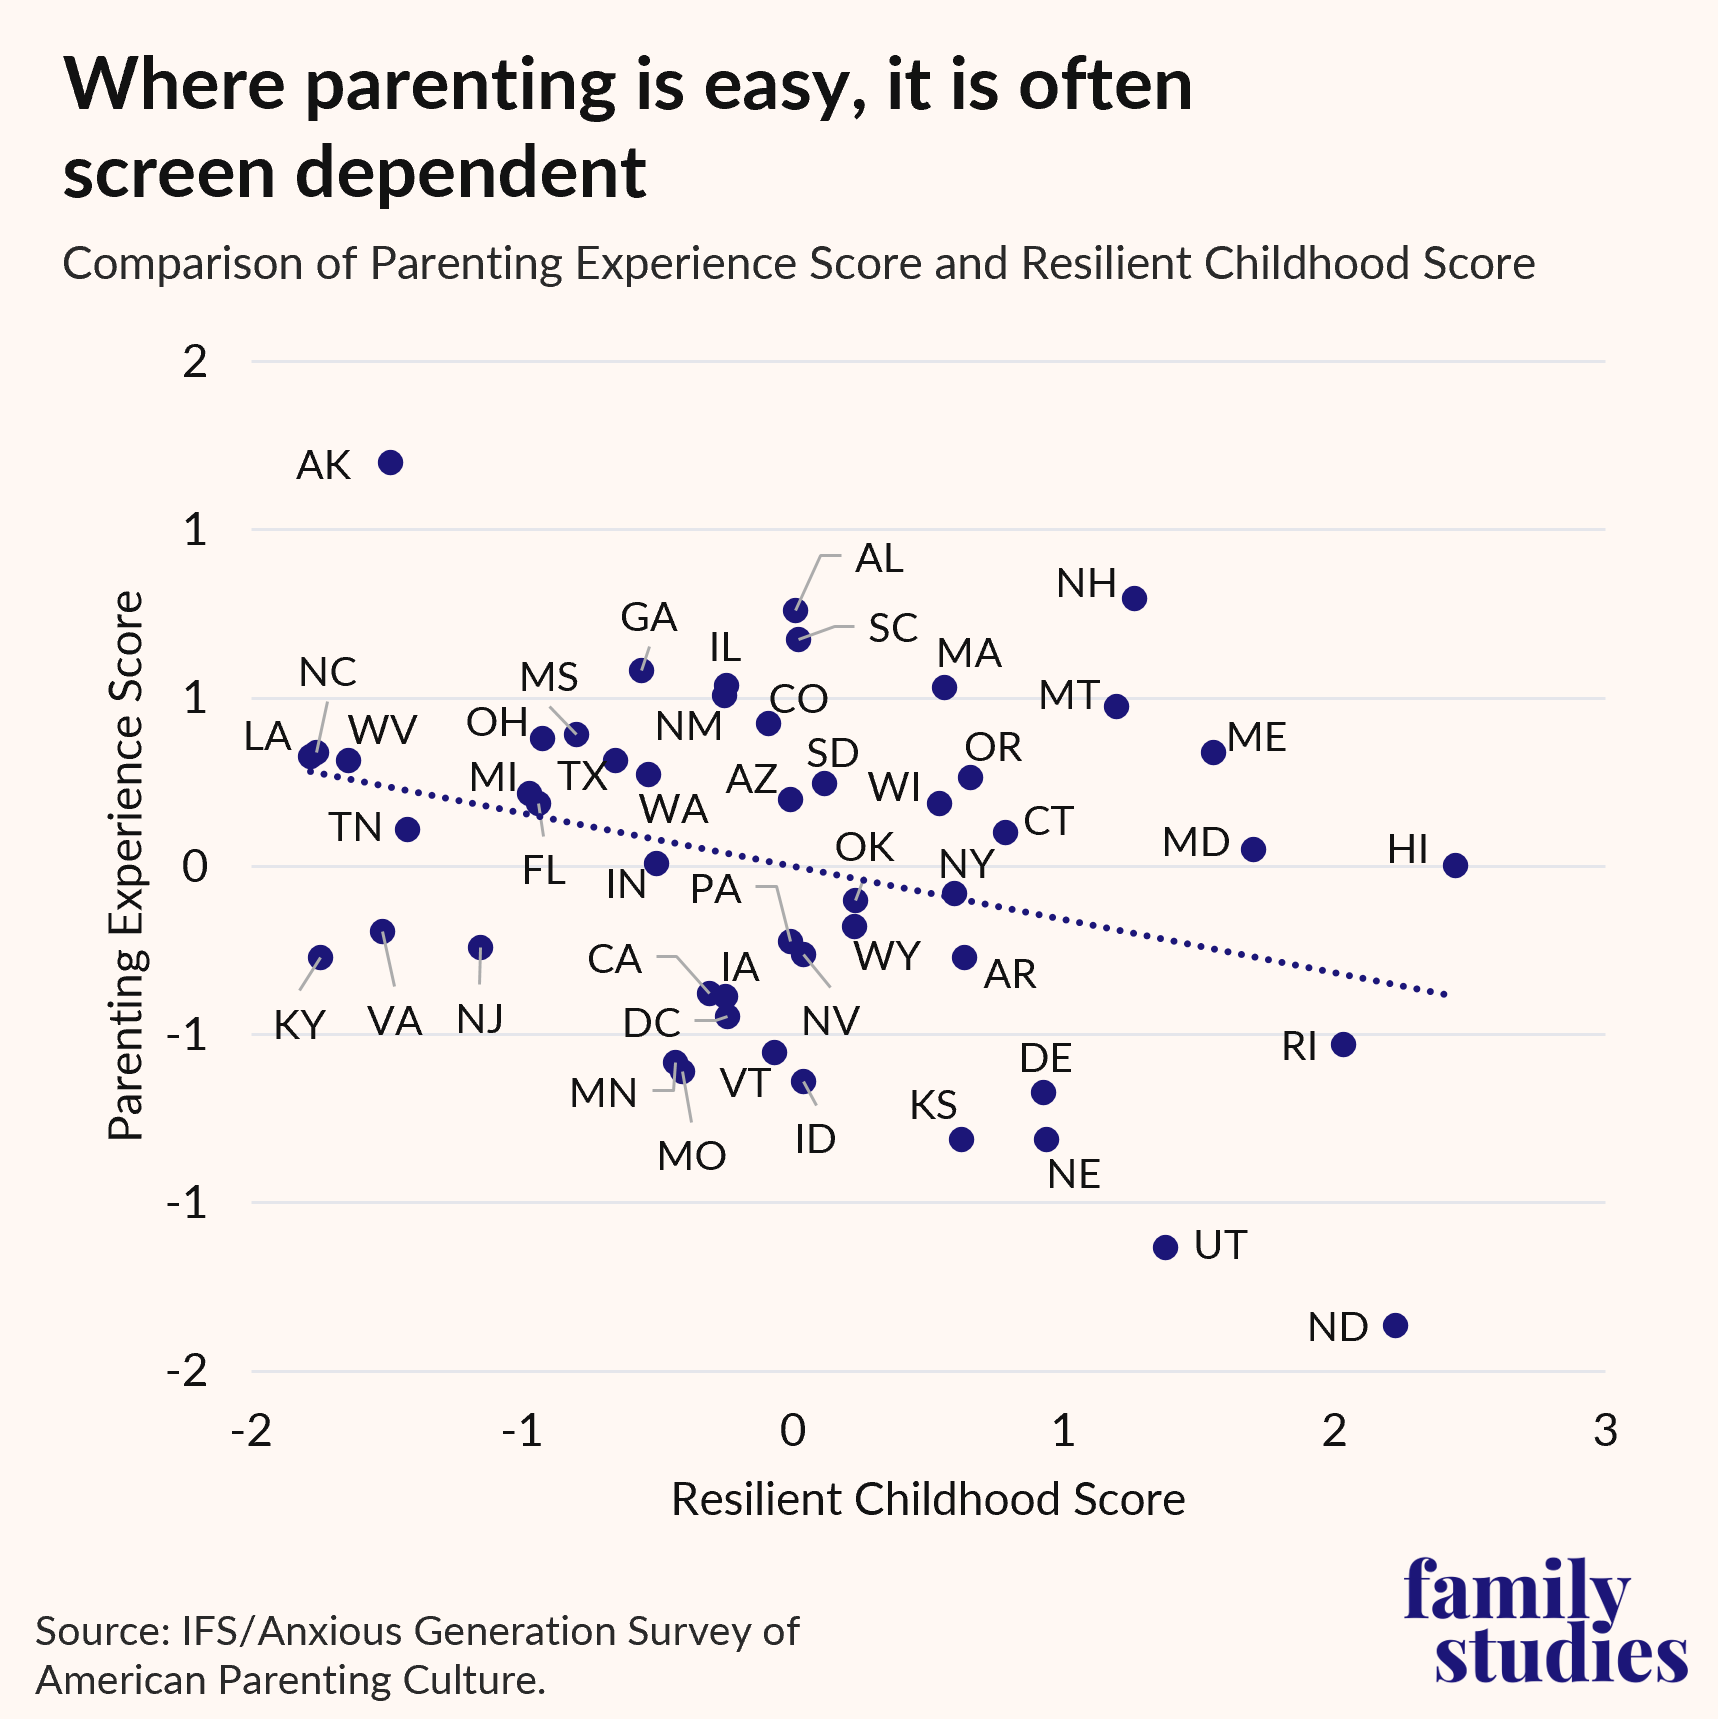
As anticipated by some of the prior discussion, in general, in states where parents feel more positive and supported, children have diminished social lives, less independence, and more screen time. At the individual level, we found the same relationship: parents who report trying to adopt a low-tech, high-independence parenting strategy feel less supported and more critiqued by their community.
Conclusion
Raising children who climb trees, ride bikes, meet up with friends, and play instruments is hard work, even in places where parents who make these decisions are more common. Even in such locales, it is an uphill struggle, one for which societal support is lacking (at least compared to societal pressure to succumb to an online, screen-heavy childhood). To put it sharply, the type of parenting our society most actively supports is keeping children quiet by putting them in front of a screen. Most Americans, we find, believe children get too little supervision, not too much, even though children today have less unsupervised time than children of almost any prior generation. When American parents hover over their children or plop them in front of a screen, they’re simply conforming to the parenting that mainstream America endorses and supports.
On some level, this is inevitable: it really is easier to offload more parenting time onto Netflix than it is to deal with the cuts, scrapes, and broken bones independent kids bring home. The latter really are stressful for parents. The tradeoffs are real.
But the benefits of allowing children to become more independent and resilient are real as well. Prior research supports developmental and mental health benefits of the kind of parenting we measure in the RCS, and our own survey also finds mental health benefits for children whose upbringing is more resilient.
The maps we have presented here paint a picture of parenting and family culture in the United States, and not an entirely flattering one. If we want to see American children raised to be independent and mentally and physically healthy adults, dominant modes of American parenting may need to be overhauled in a way many parents will find very challenging. Parents trying to raise resilient children are undertaking a necessary but difficult task.
Thus, parents need more help to manage these tradeoffs—particularly by policymakers who seek to limit digital technology in childhood and phones in schools—as well as more support for greater unsupervised outdoor play by children. Likewise, policymakers should work with parents and with civil society (schools, churches, sports leagues, clubs, and other organizations) to find ways to support parental burden-sharing, create opportunities for kids to socialize and play, and reward parental cultivation of children’s autonomy. If our aim is to nurture healthy families and help them grow in number, the institutions of civil society must learn to work with families in a broad social effort of raising resilient children.
Acknowledgements
The Survey of American Parenting Culture was made possible through a collaboration between The Anxious Generation Movement and the Institute for Family Studies.
Appendix: Data and Methods
In November and December 2025, the Institute for Family Studies conducted the Survey of American Parenting Culture on the survey platform Alchemer, which sampled individuals residing in America who had children in the home ages 0 to 17.
We aimed to sample 21,360 parents at fixed quotas for each state, with quotas set approximately proportional to state population, though with some under sampling for large states and oversampling for small states. Every parent was asked a battery of questions about themselves and their household, and then a series of questions about each child in their household, up to four children. If any children were ages 12 to 17, parents were then asked for consent to allow a child to be surveyed directly; if they consented, a separate survey was provided for the child aged 12 to 17. We aimed to survey 2,525 children ages 12 to 17 in this way.
Ultimately, we collected 23,898 valid and completed parental responses. Among those parental responses, child-specific surveys were completed for 40,809 children ages 0 to 17. Of those children, 2,628 were ages 12 to 17, and their parents consented to have them surveyed, with the child in fact completing the survey.
Rates of incompletion were relatively normal for online surveys. Of the 46,047 individuals who began the survey, 12,273 were disqualified due to ineligibility (generally because they didn’t have children at home), and a further 2,001 were disqualified due to evidence that their responses were negligent, unconsidered, or otherwise unreliable (speeding, straight lining, gibberish text, etc.). An additional 7,875 respondents failed to complete the survey; respondent drop-off disproportionately occurred early in the survey when they first encountered the questions about household children, and individuals who dropped out of the survey at that point tended to have characteristics suggesting they would have been likely to be disqualified later on due to speeding or straight lining responses had they completed the survey.
Our sample exceeded our anticipated quota values because acquiring a sufficient sample size in small states proved somewhat more difficult than anticipated, and so the survey was held open longer than originally planned. In the end, sample sizes for a few states remained lower than we aimed to achieve, which led to some states having erratic estimates. Thus, for states with small sample sizes, we pooled in-state respondents alongside neighboring-state respondents. We weighted out-of-state respondents using a formula based on inverse linear distance from the reference state’s population centroid. Ultimately, “borrowed” respondents made up some share of respondents for Delaware (24%), DC (49%), Maine (6%), Montana (9%), Nebraska (18%), New Hampshire (35%), North Dakota (14%), Rhode Island (38%), South Dakota (29%), Vermont (60%), and Wyoming (20%). Because “borrowed” respondents are by construction respondents who live very close to the reference state (generally near the border with neighboring states), their demographic characteristics tend to be very similar to in-state respondents; we expect their parenting traits should be similarly representative as well.
In this report, we introduce two composite scores describing facets of parenting: the Resilient Childhood Score (RCS) and the Parental Experience Score (PES).
First, the RCS is computed by summing the average Z-scores of several indicators of childhood independence with the average Z-scores of several indicators of childhood social activity, and then by subtracting the average Z-score of several indicators of childhood technological dependence. As a result, the RCS measures the extent to which children have independent, socially diverse, technology-lite childhoods.
Second, the PES is computed by averaging Z-scores for a range of indicators of how parents describe their own happiness and comfort parenting, the worries they report, and the degree to which they feel supported in their parenting. In short, the PES measures, the extent to which the parenting experience is pleasant and positive for parents themselves.
