Highlights
- Goldin notes that the lower-fertility countries have particularly large gaps in unpaid housework between men and women. Post This
- South Korea, the country that experienced unusually extreme growth, also experienced an unusually extreme fertility drop. Post This
- There doesn’t seem to be a strong, systematic relationship in which faster growing countries have lower fertility after accounting for their current level of economic development Post This
The developed world faces a birth dearth, with total fertility rates below the 2.1 children per woman needed to sustain a population. Frustratingly, some of the biggest causes are things that few want to change–including greater economic opportunities for women, rising living standards, effective birth control, and declining teen pregnancy.
In recent years, however, researchers have identified some nuances in the situation. Sometimes, within the developed world, people with higher incomes or more education, or countries with stronger economies or more female labor-force participation, seem to be a bit more fertile. The “feminist fecundity” hypothesis contends that once countries transition to modern economies, the route to higher fertility lies in greater support for working women, so that they can balance work and kids.
This can have a whiff of wishful thinking and hinge on how one analyzes the relevant datasets. (See my skeptical previous writings on related ideas, here and here.) But it also makes some sense that in a world where most women work outside the home, facilitating working motherhood could yield fertility benefits.
Claudia Goldin, an economist whose work I’ve discussed in this space before, recently floated a new theory in this arena. In a working paper released through the National Bureau of Economic Research, she proposes that the pace of economic growth, and not merely the level of economic development, can profoundly affect fertility rates.
Specifically, the problem is a “transformation from a society that is less well-connected, more tradition-bound, relatively isolated and rural, and communal rather than individualistic into a nation that is generally the opposite with more developed markets, thicker communication networks, and denser settlements.” When an economy makes this shift suddenly and rapidly, she argues, women enter the workforce faster than men change their traditional attitudes about helping at home. Something has to give, and that something is fertility.
The paper provides a compelling narrative and shows it’s consistent with descriptive data from a collection of 12 countries. Six of these countries are historically well-off; the other six are somewhat poorer but, importantly, experienced rapid “catch-up” growth in the second half of the 20th century.
Goldin’s theory is fascinating and does fit these countries well, and it deserves more consideration and testing.
***
Let’s take a spin through the relevant numbers, many of which are conveniently collected over at Our World in Data.
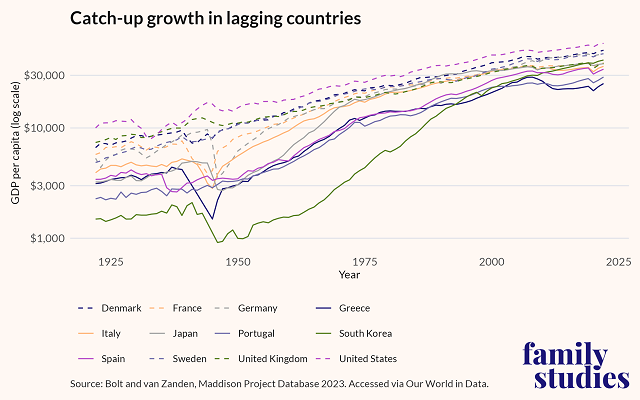
Here’s how GDP growth has played out over the past century, on a logarithmic scale to measure proportional changes. (E.g., the distance between $5,000 and $10,000 is the same as the distance between $10,000 and $20,000, as both represent a doubling.) The countries in the upper-income group have dashed lines, so you can focus on the overall pattern rather than trying to sort out every country.

While all countries see economic growth, two patterns stand out. First, the gaps shrink significantly as the lagging countries catch up; and second, this catch-up is incomplete, with the countries that started off poorest still tending to fall toward the bottom at the end. South Korea is an enormous outlier, though, as it begins as by far the poorest country but pushes its way into the top half.
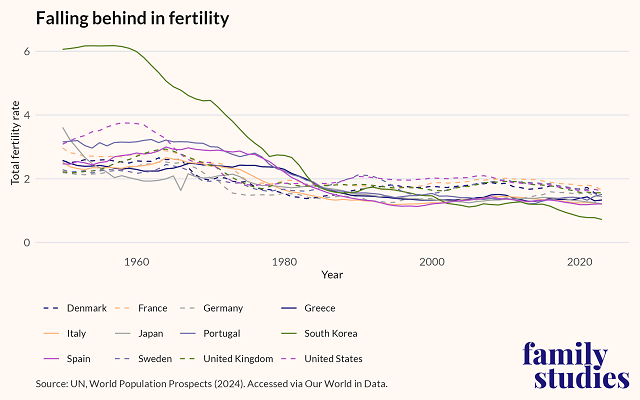
And here are fertility trends in the same nations, with the six in the upper-income group dashed again.

In the 1960s and 1970s, the higher-income nations’ total fertility rates fell dramatically into a range of about 1.5 to 2 births per woman. More recently, they’ve grouped together tightly around 1.5 births.
Meanwhile, in the countries that started off poorer, South Korea stands out again: It started with by far the highest fertility rate in either group and ended with the lowest. The other countries show that pattern much less dramatically. In the early years, especially in the 1970s, these countries center a bit higher than the other group, and by the end they’re lower—indeed, with “lowest low” fertility rates.
The upshot is striking when you put it together. Even though the poorer countries didn’t manage to fully catch up economically, they more than caught up in terms of low fertility, and South Korea, the country that experienced unusually extreme growth, also experienced an unusually extreme fertility drop. “Particularly fast economic growth is especially bad for fertility” is a decent theory to fit these facts—though one must keep in mind that even the countries doing “well” in this framework are not reproducing themselves.
Next, Goldin notes that the lower-fertility countries have particularly large gaps in unpaid housework between men and women. This is evidence for her proposed mechanism, in which women in rapidly developing countries want to work but men don’t want to pick up the slack at home.
She further writes that these “nations also happen to be disproportionately Catholic or Orthodox, and two (Japan and Korea) have non-Western belief systems, with traditions that emphasize family ties and clan identity.” This could plausibly heighten the impact of her proposed gender divergence, though it can also be seen as an alternative explanation for some of these patterns .
***
Goldin’s theory is certainly fascinating, but it deserves more analysis to flesh out key details. Does it apply beyond the countries she focused on? Are there other mechanisms besides men’s contribution to unpaid housework? Can policy break the pattern, or do these countries just have to wait for culture to catch up to the economy?
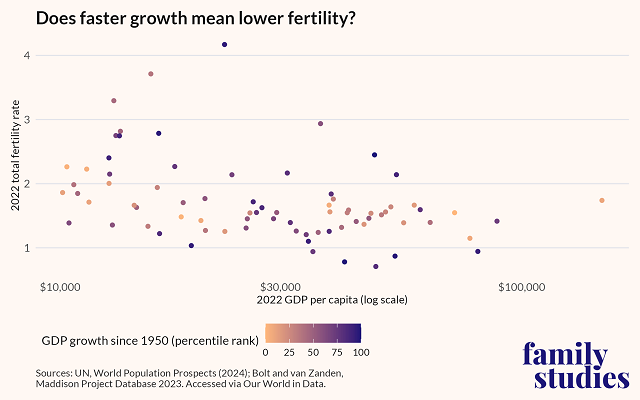
In that spirit, I’ll leave you with a chart featuring a wider variety of countries. I combined GDP per capita for 2022 and 1950, as well as 2022 fertility rates, for nations with per capita GDPs of at least $10,000 in 2022. The graph shows the usual negative relationship between economic development and fertility, and the dots are colored according to how quickly the economy grew between 1950 and 2022.1

There doesn’t seem to be a strong, systematic relationship2 in which faster growing countries have lower fertility after accounting for their current level of economic development—though there are a number of dark-blue dots toward the bottom of the chart, and not all fast growers necessarily experienced the severe, sudden lifestyle disruptions that Goldin finds important. Sorting out the nuances here would be a good angle for future work.
Robert VerBruggen is an IFS research fellow and a fellow at the Manhattan Institute.
1. I divided 2022 GDP by 1950 GDP and ranked the results into percentiles, rather than using raw percentage growth, because the raw growth data are skewed by a handful of extremely rapid growers like South Korea.
2. In a multiple regression on these data points, when I regress log fertility against the log of 2022 GDP as well as the growth since 1950 (also in log terms), I get the expected negative relationship with 2022 GDP (elasticity of -.22). However, the relationship between fertility and growth since 1950, -.01, is insignificant, p = 0.81.


