Highlights
- The share of women approaching retirement without any nuclear family of their own is likely to rise considerably in the next few decades. Post This
- For women born in the 80s, lack of spouse and child will again become more common as the pace of fertility and marital decline has accelerated, and nonmarital fertility has stopped increasing. Post This
- Today, about 75% of women without children who are past their reproductive years are properly described as childless, not childfree. Post This
- Almost a third of women have never married by age 35, and about 15% have never married by age 50. These numbers are likely to continue rising. Post This
By now, it’s not news to anyone that America’s fertility rate is falling. But there are different ways fertility can fall. One way is that the average family size can shrink as people shift from having four kids to three, two kids to one, etc. But the other way is by people not forming families at all. Most of the drop in fertility in America in the last two decades is driven by this second factor: more Americans are staying single and never having children at all, as Wendy Wang recently documented on these pages. But among people who have children, fertility rates have been comparatively stable.
Childlessness in the Long Run
How many people end up childless? The first reliable question about fertility in a U.S. survey was the 1900 Census. Married women continued to be asked about their fertility in some subsequent surveys, but the exclusion of unmarried women makes those questions unreliable. Not until the censuses of 1970-1990 was the fertility question asked again of all women, and by 1976, the Current Population Survey (CPS) was also asking a representative sample of women about their childbearing history. There are some birth years not covered by any of these sources, leading to gaps in the data, but on the whole, childlessness since the early 19th century can be reliably estimated.
Figure 1 below shows the share of women who likely ended up childless at the end of their reproductive years, by year of birth. Women born after the 1970s haven’t necessarily finished having children yet, so the childless share can’t directly be estimated. However, by looking at CPS childlessness rates for younger ages and seeing how first birth rates have developed over time, we can make a plausible guess at what some of those women’s ultimate childlessness rates will be.1
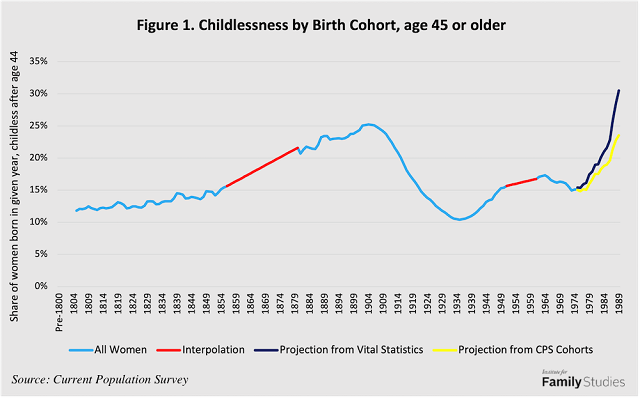
Childlessness rose from the birth cohorts of the early 1800s until the early 1900s, driven by increasingly delayed marriage, falling fertility rates generally, and by the reproductive years of women born in the 1860s to 1910s, decades of repeated economic recession, multiple world wars, and the advent of modern birth control and contraceptive movements in the 1910s and 1920s. But for women born in those decades, childlessness fell sharply as the boom-times of post-war America led to widespread early marriage and high birth rates. The women born in the 1920s and 1930s came the closest to “universal motherhood” of any generation of Americans ever. That being the case, the rise in childlessness over the 1940s and 1950s cohorts is hardly a surprise. But if current trends continue, women born in the late 1970s and into the 1980s will see their rates of childlessness rocket upwards to possibly unprecedented levels. For reference, the latest complete cohorts in Japan saw childlessness rates around 28 percent. U.S. women currently in their 30s could easily end up having childlessness on par with Japanese women currently in their 40s. That’s a dramatic change. But it’s worth noting that it’s not entirely unprecedented: Across 28 mostly high-income countries with data on childlessness in the Human Fertility Database, in 2000, 45-year-old women in the U.S. had higher childlessness than all but one other country (Switzerland). It is perfectly plausible that the U.S. could return to its prior position as a world-leader in childlessness.
It's important to emphasize that this trend is about childless women, not childfree women. It’s true that some women don’t want any children, but most do. Using data from the General Social Survey (GSS), it’s possible to estimate what share of women over the age of 40 have zero children and also report a zero-child fertility ideal (plausibly childfree women), the share of women over 40 who have zero children and report an above-zero ideal (childless women), and the share of women who gave some non-numeric response (which could indicate either category). Figure 2 shows the results.
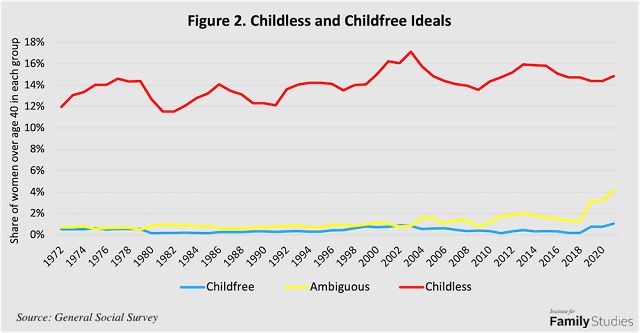
About 1% of women over the age of 40 are “childfree,” meaning they don’t have kids and they report having a zero-child ideal (or believe it’s not ideal to have children). An additional 2-4% are ambiguous; they might be childfree or childless. But even if those two groups are added together, yielding maybe 5% of women being childfree, about 15% of women over 40 in the GSS report having no children, yet having a fertility ideal higher than zero. These women are childless. In other words, even today, about 75% of women without children who are past their reproductive years are properly described as childless, not childfree.
Singleness in the Long Run
Marital trends have also changed over time. Figure 3 uses Census, American Community Survey, and CPS data to show the share of women who have never been married as of ages 45-55 and as of ages 34-36.
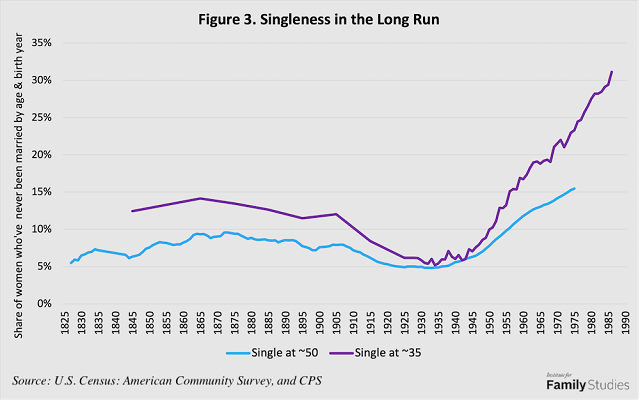
The marriage patterns have changed many times in U.S. history. But today, singleness has gone far beyond any historic norm. Almost a third of women have never married by age 35, and about 15% have never married by age 50. These numbers are likely to continue rising. It’s perfectly plausible that the share of women who’ve never had a legally-committed partner could reach 20% among the cohort of women born in the late-1980s.
Combining singleness and childlessness together, it’s possible to estimate the share of women who have never had children and never been married, i.e., those likely heading into retirement with no family as their parents die and their siblings age. Figure 4 shows the share of women who fit that category.
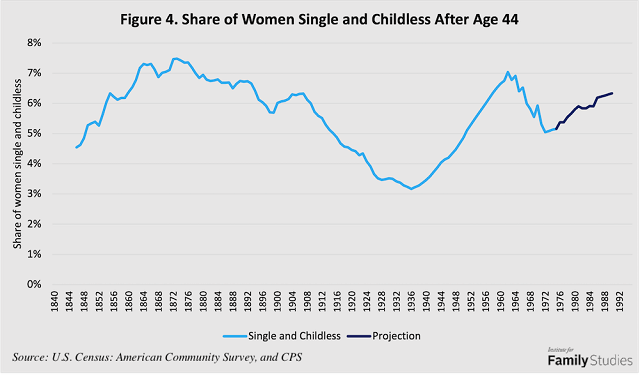
While singleness is rising and childlessness is rising, the trend for being childless and single is more complicated. It has oscillated widely through U.S. history. Many women in the 19th century approached old age without family because nonmarital fertility was very stigmatized and economic conditions meant marriage came rather late for many people. But as marriage became more universal for women born in the early 20th century, fewer women approached retirement without their own nuclear family. For women born in the 1950s, the lack of a family rose again as fertility fell and marriage ages rose, but then for women born in the 1970s, there’s been another decline. The reason is simple: more unmarried women are having children. As nonmarital fertility has become more common, being unmarried is a weaker predictor of approaching retirement without close family ties. But for women born in the 1980s, lack of spouse and child will again become more common as the pace of fertility and marital decline has accelerated, and nonmarital fertility has stopped increasing.
Fertility Rates by Marital Status and Parity
Finally, these calculations can bring us to an estimate of how fertility rates have changed for first births vs. other births, and for women who have ever been married vs. women who have never been married. For these calculations, I use vital statistics and survey data on births by parity and marital status, and estimates from surveys and censuses of the population distribution by marital status and prior birth parity.
Parity of birth refers to the number of children women have already had. By dividing the age-specific number of first births in a given year by the number of childless women of that age at the start of the year, it’s possible to estimate an age-controlled rate of progression from childlessness to a first birth. The sum of these age-specific progression rates is a total first-progression rate (TFPR). Likewise, the same calculation can be done for all second-and-higher births for women who already had one or more children to create a total higher-progression rate (THPR). These numbers create somewhat artificial indices, but the indices do help answer an important question: are childless women of a given age becoming more or less likely to have a first birth, and are mothers of a given age becoming more or less likely to have second-or-higher parity births?
Figure 5 shows the TFPR and THPR values for the U.S. since 1970, calculated from Human Fertility Database.
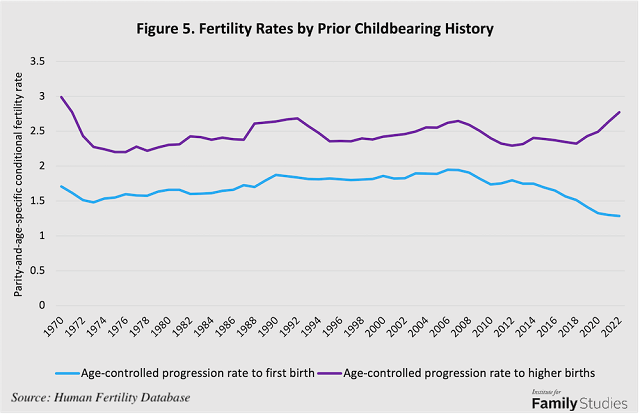
The THPR, reflecting the odds that a mother has more kids, has been stable for about 50 years, and has increased in recent years. But the TFPR, which shows the likelihood that childless women have a child, has experienced a very different trend. From the 1960s to the 2000s, the TFPR rose as nonmarital fertility rose. But from the late-2000s to now, the TFPR has fallen. Virtually 100% of the decline in U.S. fertility is driven by the falling TFPR, meaning that rising childlessness is the entire cause of falling U.S. fertility. For people who have kids, they’re having about the same number as they have had for a long time.
A similar calculation can be done for marriage. However, “marital fertility rates” are somewhat difficult to interpret since peoples’ marital status can change in many ways over their life course.2 Figure 6 below shows how ACS-measured fertility has changed, and also how it would have changed if the fertility rates of unmarried people had only declined as much as the fertility rates of married people, if 2007 age-specific marital patterns (i.e., shares of women at each age who are married) had been stable until 2020, and, finally, if both of those factors held.
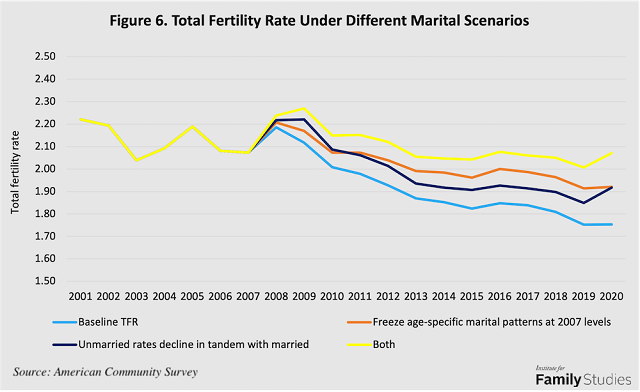
Since 2007, almost the entire decline in fertility can be explained by two factors: the unusually fast drop in fertility for unmarried women, and the growing share of reproductive-age women who are unmarried.
Conclusion
Childlessness is rising in America, a rise that is unlikely to halt in the near future since rates of first birth are falling and rates of singleness are rising. Those falling first birth rates are due to a combination of rising singleness and declining nonmarital fertility. Falling fertility can have many consequences for societies, but those consequences vary based on how fertility falls. There’s a big difference between a world where almost every retiree has one child, and a world where half of retirees are childless and the other half have two children, even though those hypothetical worlds would have about the same actual fertility rate. Because fertility is mostly falling through rising childlessness and singleness, the share of women approaching retirement without any nuclear family of their own is likely to rise considerably in the next few decades.
Importantly, the rise in childlessness is not being driven by “childfree” women: very few women desire to end their life with zero children, and as such, the vast majority of childlessness is driven by women having fewer children than they desire. Indeed, this highlights what is perhaps the key problem with childlessness—not its effects on the population, but that it represents an extraordinary “failure to launch” in the family lives of men and women around the country. The result is a growing cohort of people spending far more of their life bereft of the family for which they long.
Lyman Stone is a Research Fellow at the Institute for Family Studies, Chief Information Officer of the population research firm Demographic Intelligence, and an Adjunct Fellow at the American Enterprise Institute.
1. I provide two forecasts of childlessness up through the 1989 cohort: one uses a model of U.S. first-birth rates from birth certificate data to forecast how many women now in their 30s will have first births, and the second uses change-across-cohorts in subsequent CPS waves to estimate how first-births tend to accrue over time for a given cohort.
2. Moreover, because California refuses to report marital status data on births, it isn’t possible to use vital statistics data to calculate marital fertility from vital statistics data for the entire country. Instead, I use the American Community Survey which, since 2001, has collected fertility and marriage data.