
Highlights
As marriage rates have fallen in the U.S., the population of unmarried Americans has grown. Yet according to poll after poll, the desire for marriage remains strong among unmarried young adults. The million-dollar question is: Where is the right person to marry?
The Institute for Family Studies’ Where to find your spouse maps are designed to help answer that question. The 10 geographic visualizations show where most singles are and where young adults are actually getting married.1
Here are a few striking findings:
1. The places with the most single adults are NOT the places where most new marriages happen.
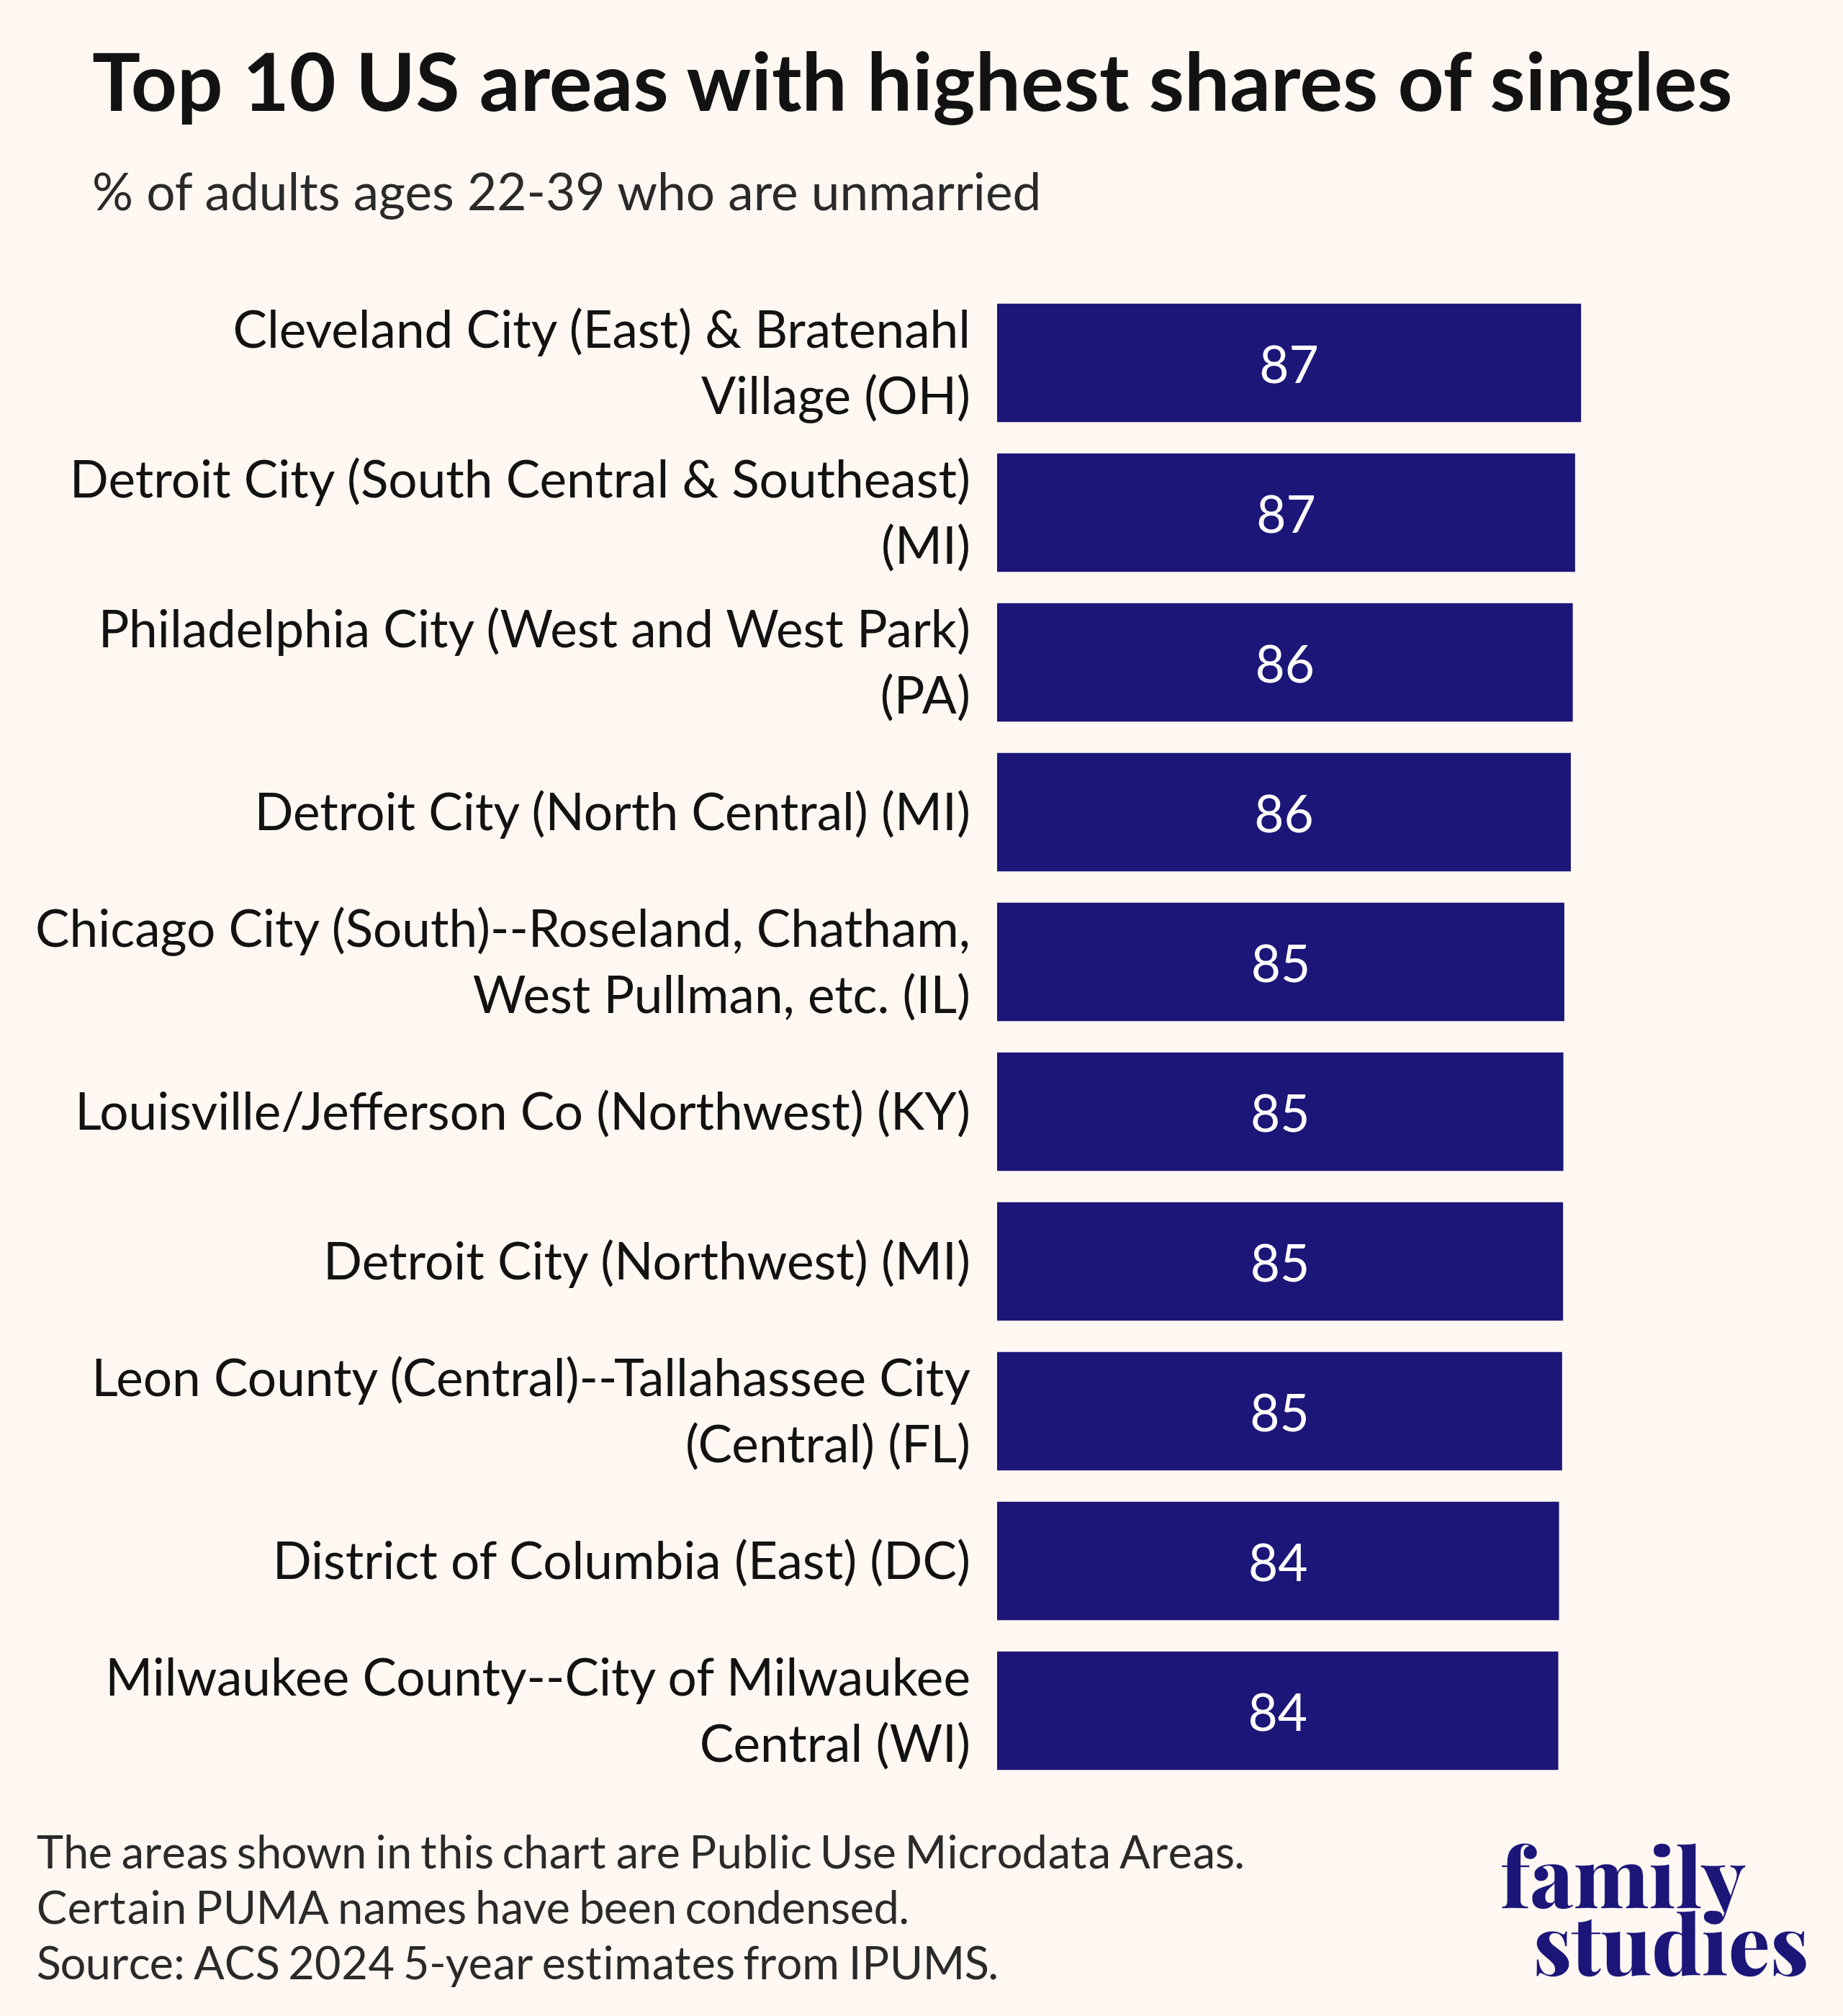
The top places2 with the highest share of unmarried adults in their twenties and thirties are overwhelmingly urban neighborhoods. In eastern Cleveland and part of Detroit, 87% of young adults ages 22 to 39 are not married, the highest in the country. Other sections of Detroit also appear on this list, as do parts of Philadelphia, Chicago, Louisville, Milwaukee, and Washington, D.C. In every one of the top 10 places, more than 80% of adults in their twenties and thirties are not married.
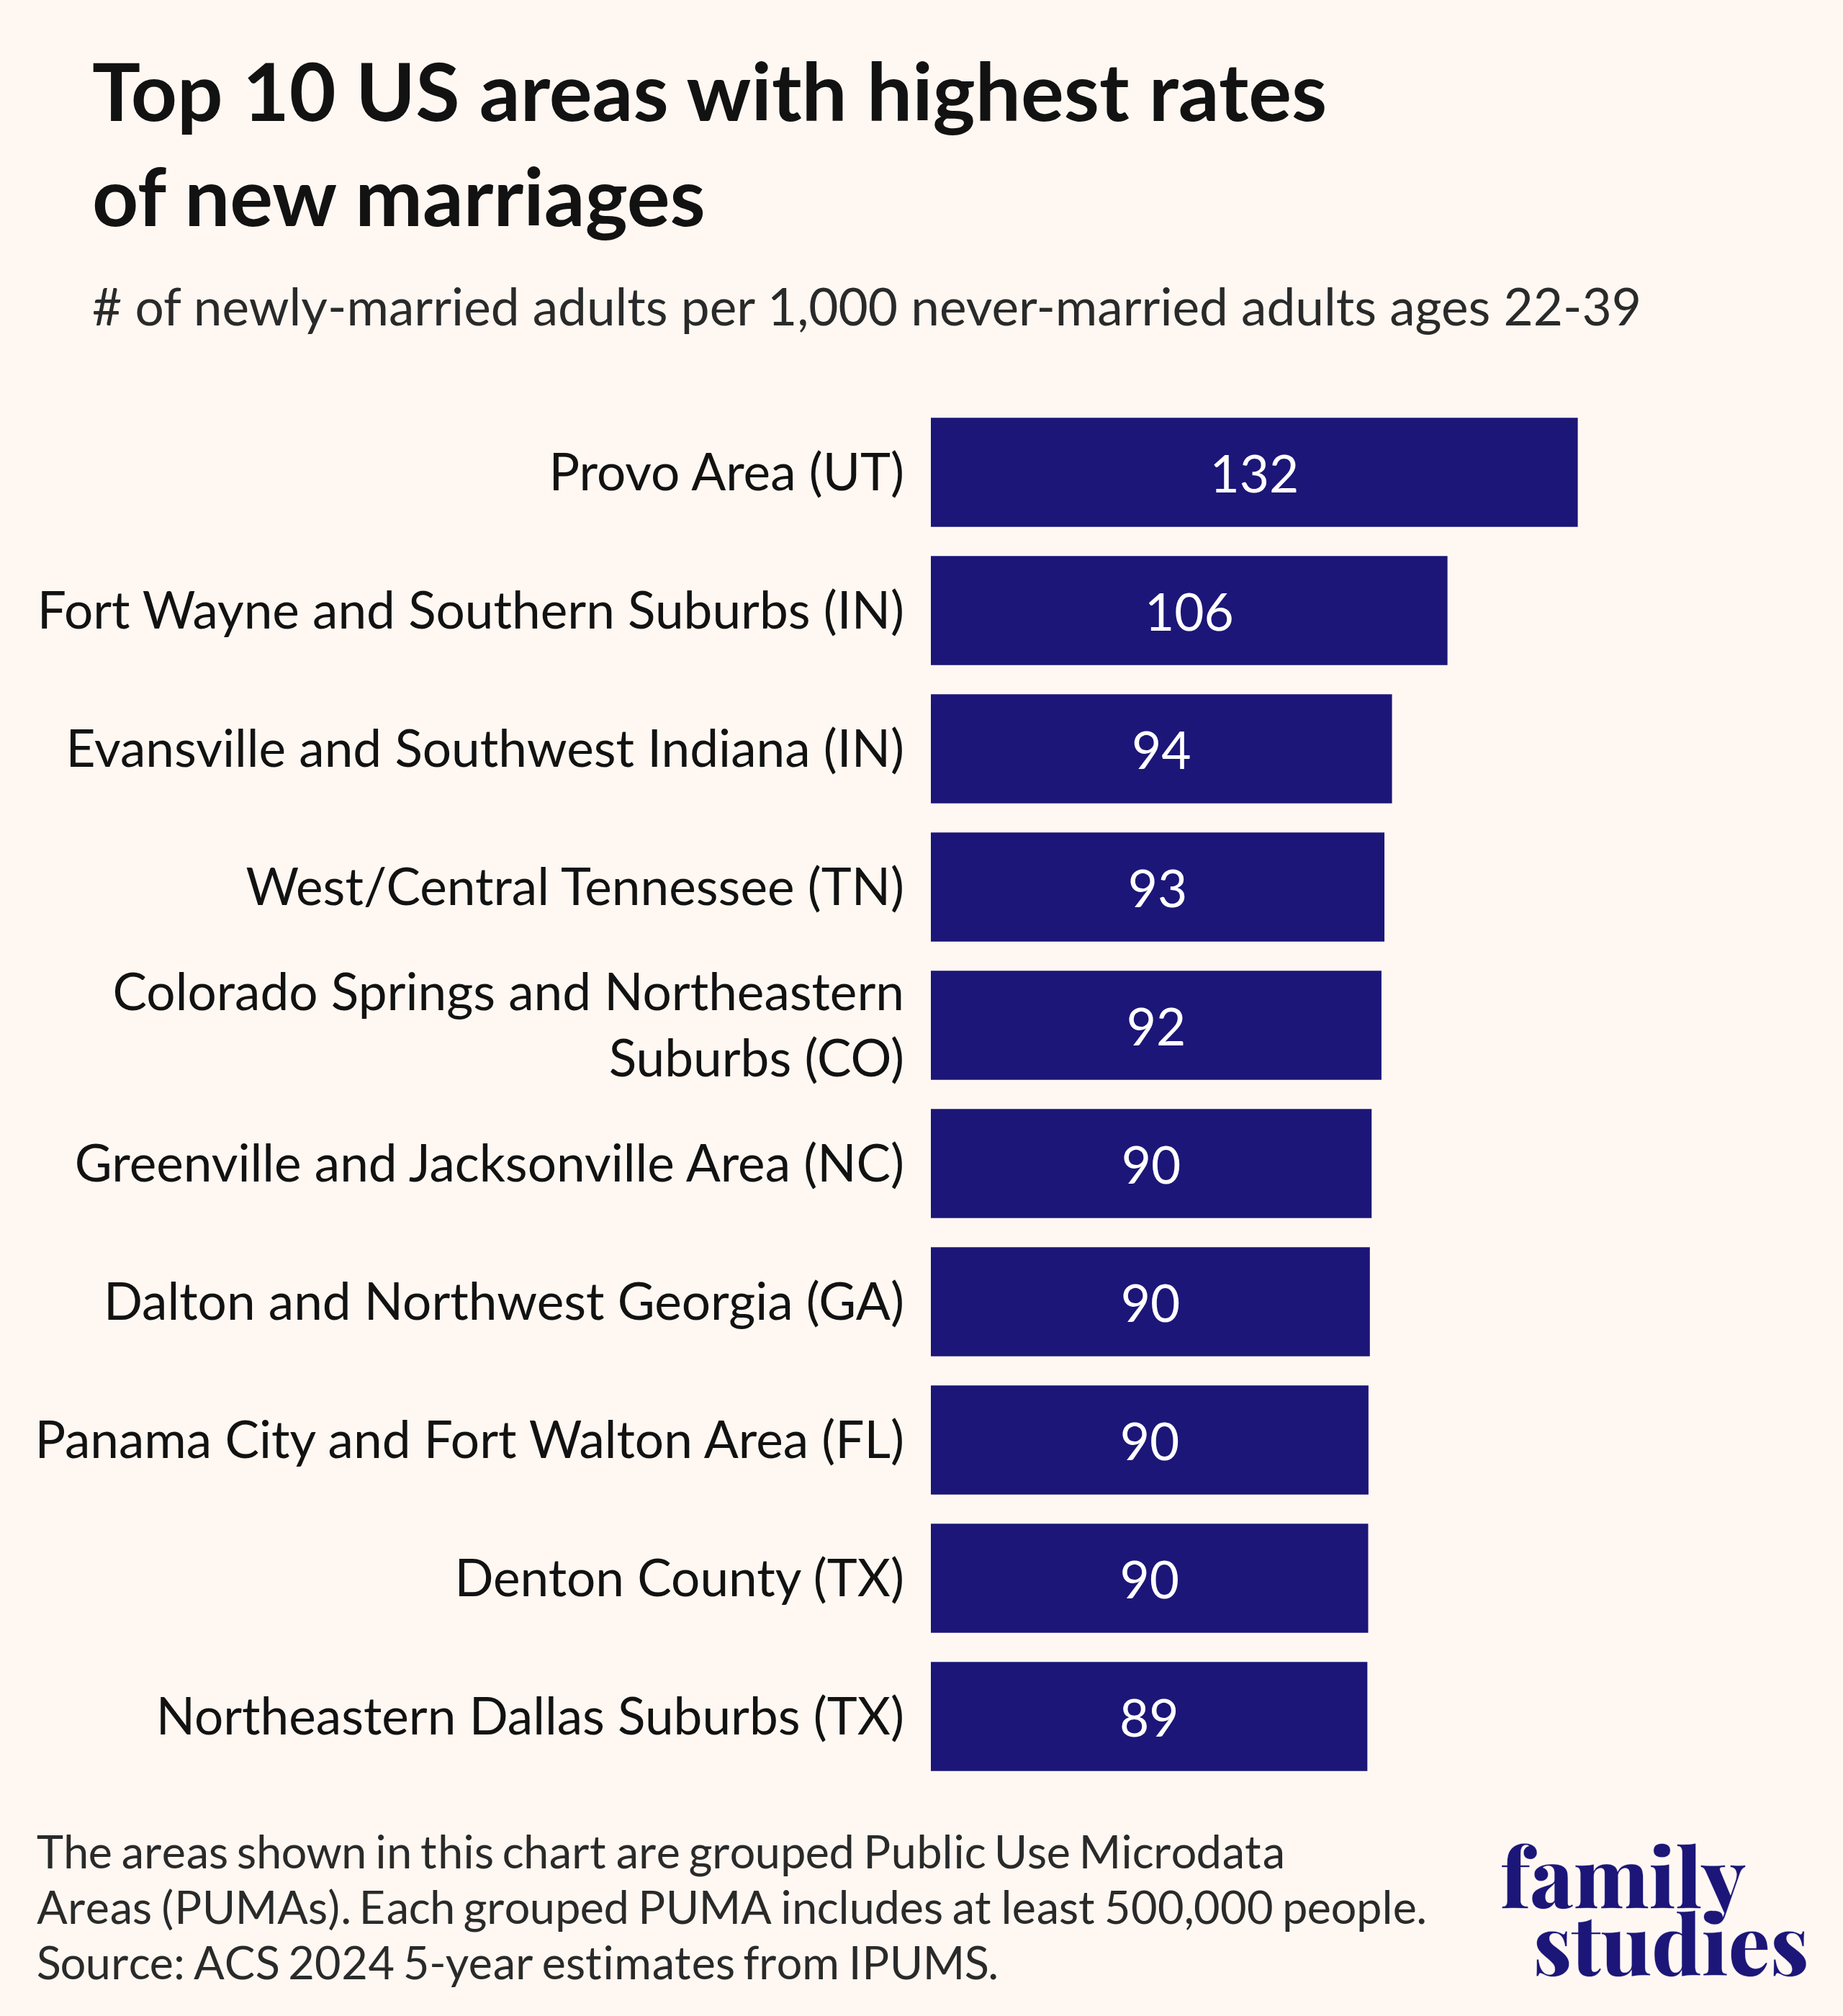
However, if you are a single person and looking for places where marriages are most likely to happen, you might want to look elsewhere. The areas with the most new marriages are almost entirely in middle America, located in and near cities like Provo, Utah; Fort Wayne and Evansville, Indiana; and Colorado Springs, Colorado. West/Central Tennessee, Northwest Georgia, North Carolina’s Greenville/Jacksonville corridor, and parts of Texas and Florida also have particularly high rates.
Provo has the highest marriage rate in the country. From 2020 to 2024, an average of 132 first-time marriages3 were formed each year for every 1,000 never-married adults ages 22-39. Two areas in Indiana followed, one including Fort Wayne and the area to its south, and the other including Evansville and Southwest Indiana, with 106 and 94 marriages per 1,000 never-married adults, respectively.
In a day and age when record numbers of young adults are postponing or forgoing marriage, some communities remain deeply marriage minded. Looking at the share of young adults who are currently married, the Lakewood Township area of Ocean County, New Jersey, with a large Orthodox Jewish population, stands out as the top area. More than 73% of adults in their twenties and thirties in this area are married. Utah, a state known for its Mormon population, follows closely: west Utah county (72%), along with two other areas in the state, also rank among the top 10.
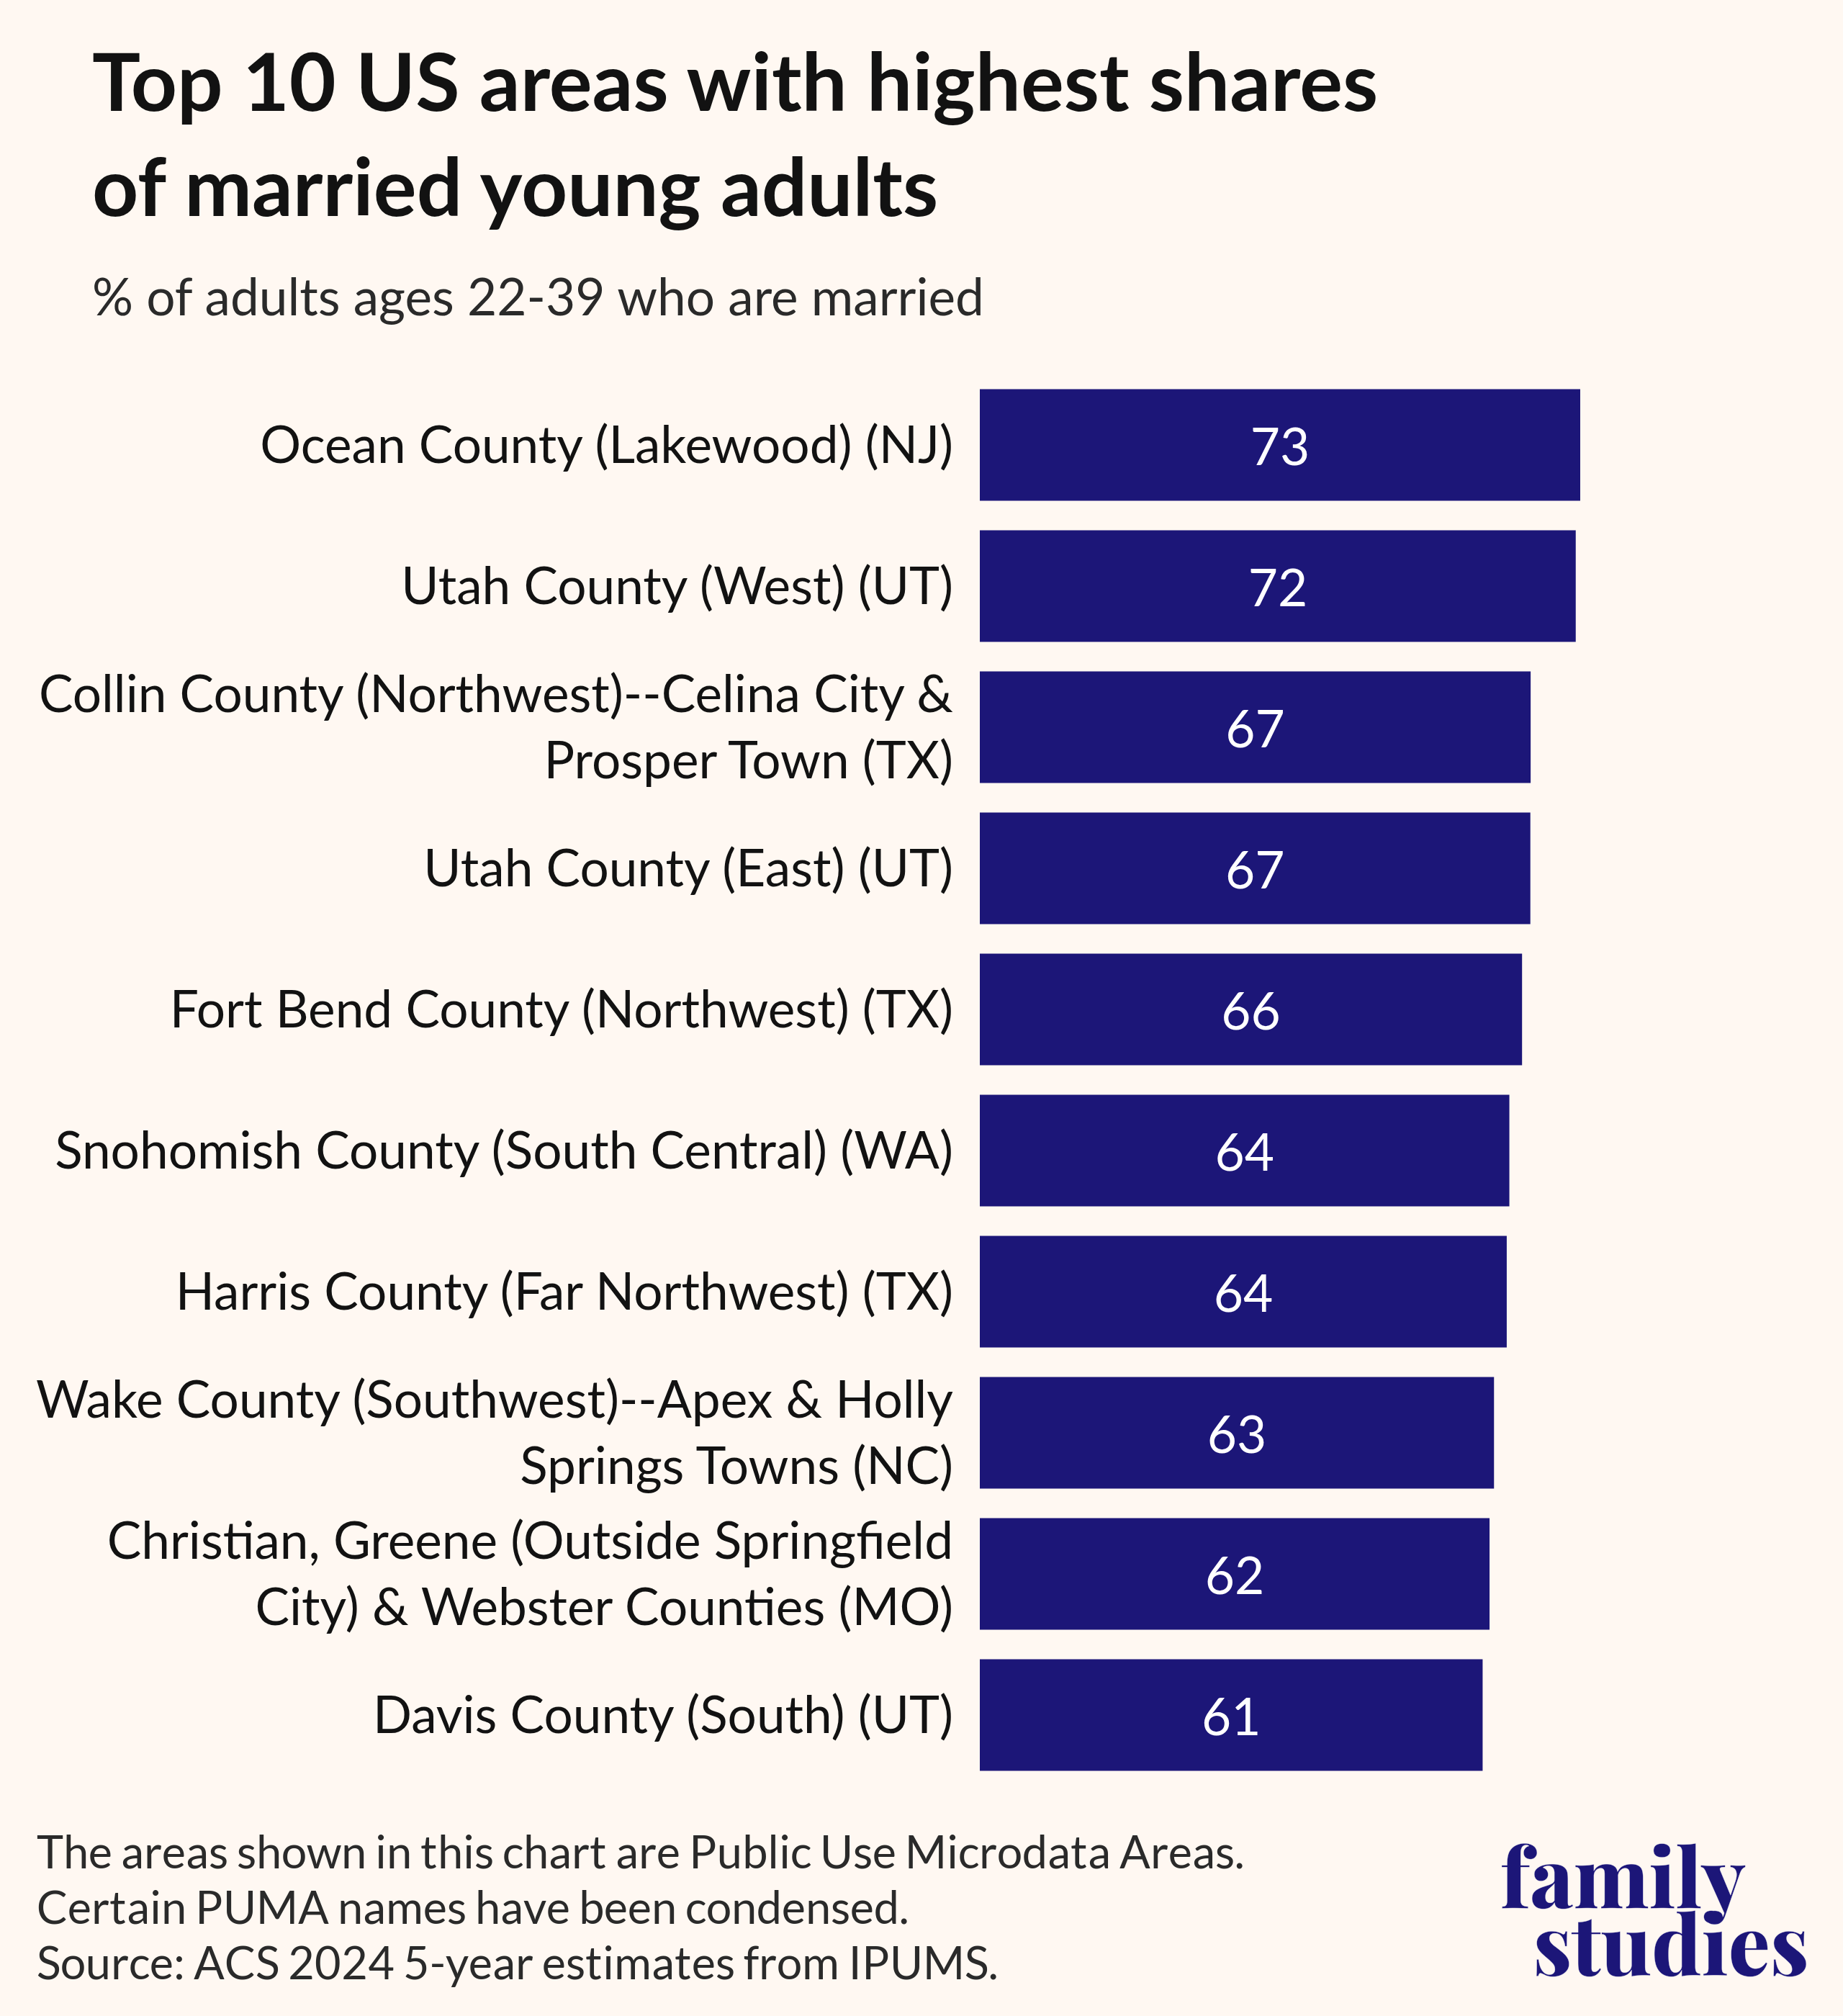
In addition, the areas with the highest proportion of married young adults tend to be located in the suburbs of major cities, including Dallas, Houston, Raleigh, and Seattle.
2. For women who want a spouse with a full-time job, the marriage market looks dramatically different in their twenties vs. their thirties.
If the sheer number of singles in a place does not correlate with marriage rates, then what does? Previous research shows that single women place a much higher premium than single men on a stable job when looking for a spouse, and the ratio of employed men matters for marriage formation. Meanwhlie, having a good job is strongly linked to men’s chances of being married and having children. Indeed, using data at the grouped Public Use Microdata Area (PUMA) level, where each geographic unit contains at least 500,000 people, we find a strong link between the new marriages in an area and the ratio of full-time employed single men to single women.
For instance, the two areas with the highest ratios of single, full-time-employed men to single women (among adults ages 22-39)—one encompassing North Dakota and the other surrounding San Jose, California—both have marriage rates in the upper 20%. Meanwhile, the two regions with the lowest ratio—one in the middle portion of Manhattan and the other south of Chicago—both have marriage rates in the lower 20%. A visualization of this data is available within our corresponding report.
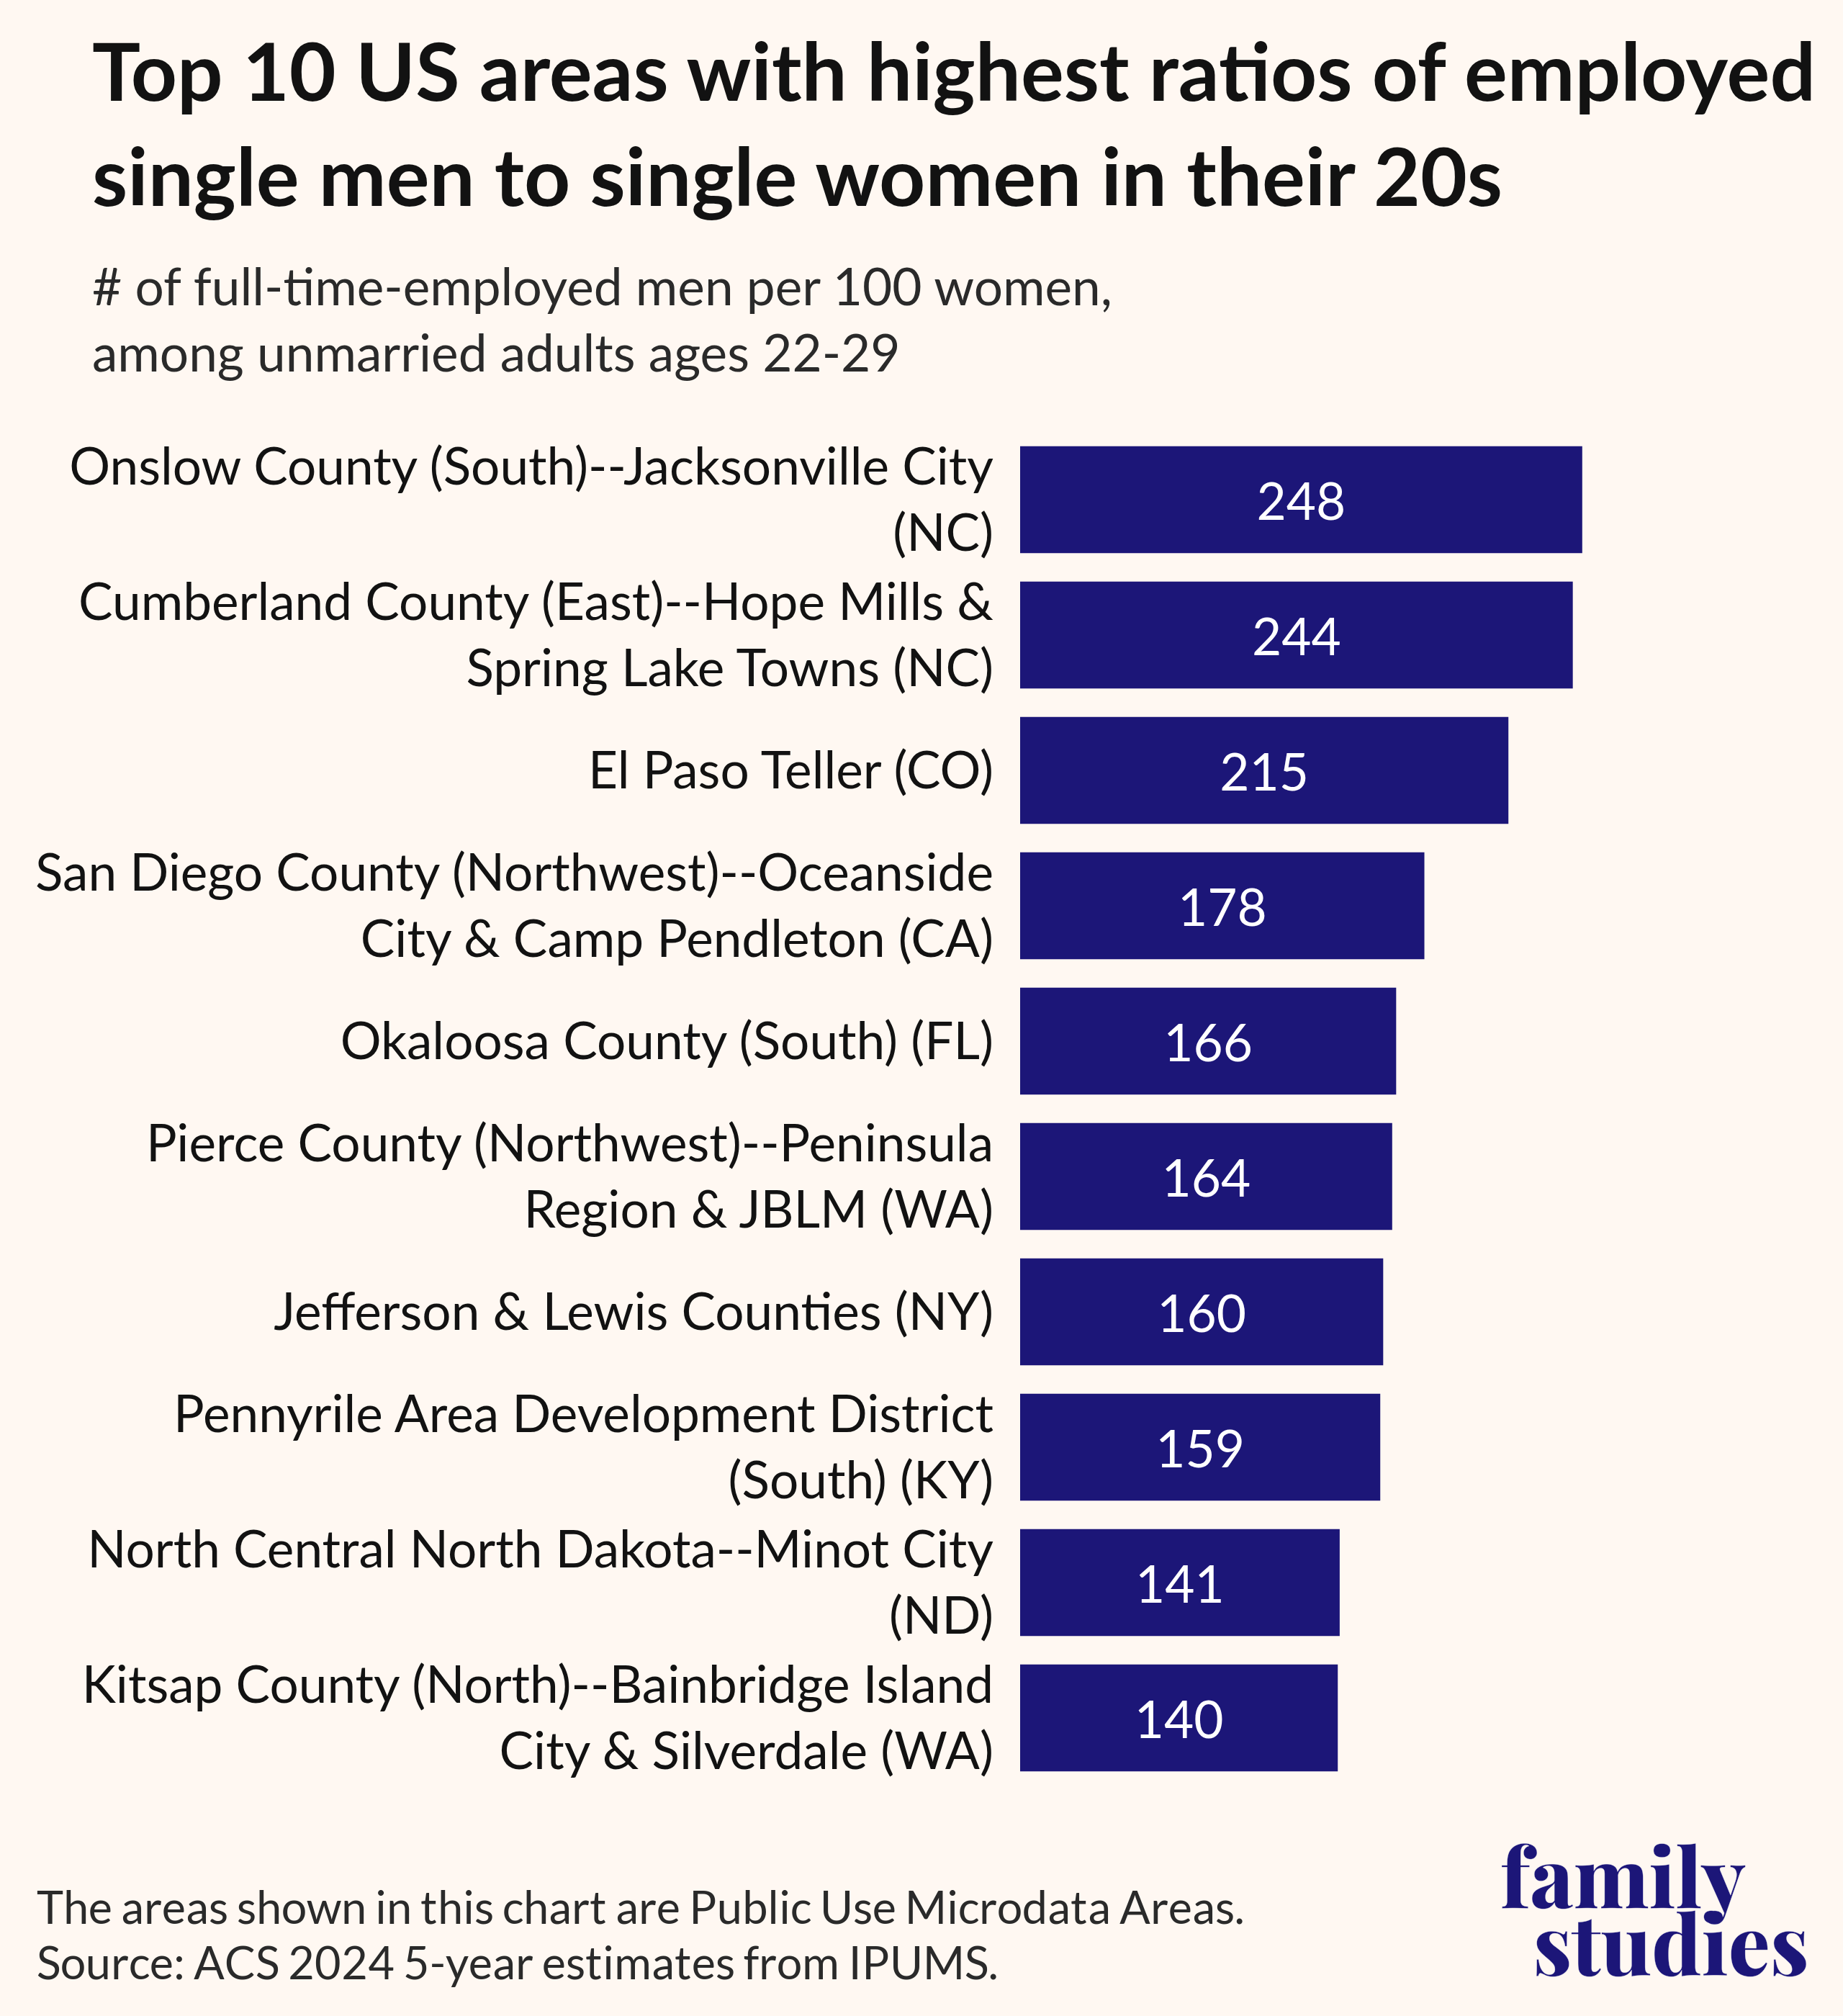
And this ratio looks very different depending on age of the singles. For unmarried adults in their 20s, the areas with the highest ratios of employed single men per 100 single women are places with large military bases or defense-related employment: Jacksonville City (NC), East Cumberland County (NC), and El Paso Teller (CO). In fact, nearly every top area is anchored by a major military installation, which creates unusually large populations of young, full-time-employed men and comparatively few single women.
However, the patterns for unmarried adults in their 30s look quite different. The top areas are high-earning tech and professional hubs: Sunnyvale (CA), Ramsey and Franklin Lakes (NJ), Madison’s suburbs (WI), and parts of Tucson (AZ). Instead of military bases, these regions are anchored by concentrations of well-paid engineers, software developers, scientists, and other professional workers, occupations that tend to have more men than women in their thirties.
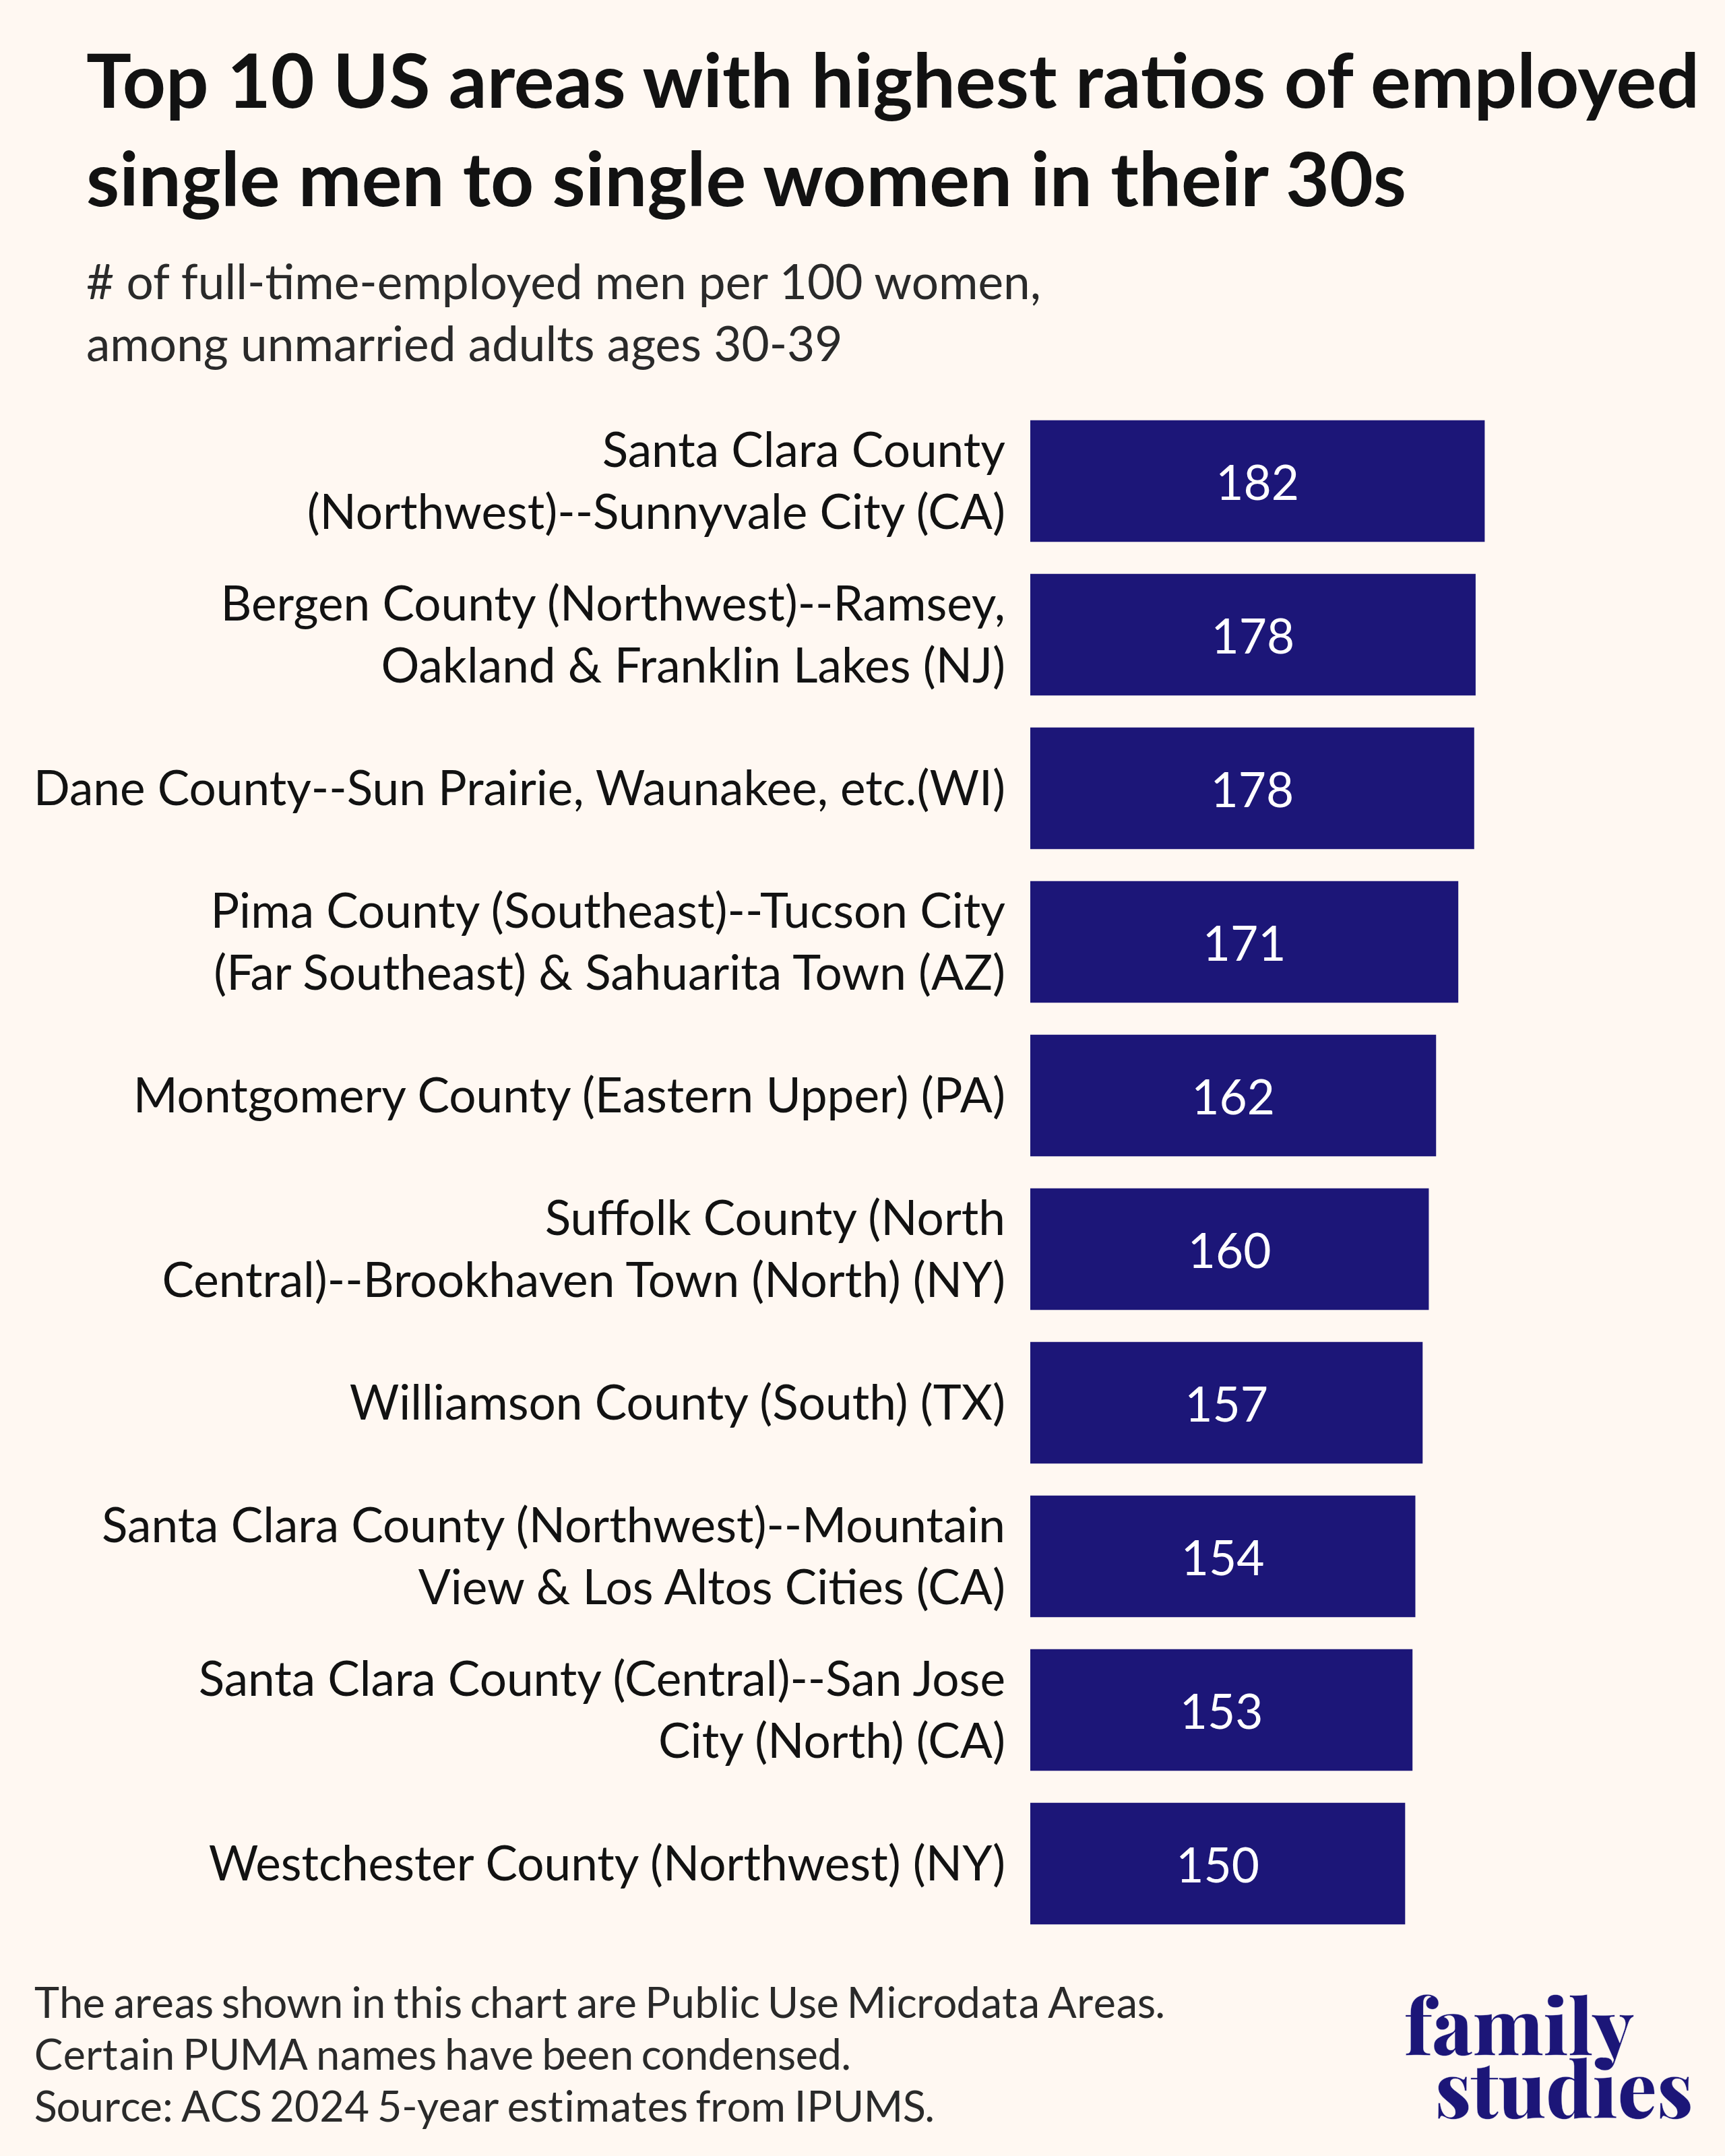
Different from the marriage market in the twenties, where a larger pool of employed men is linked to higher marriage rates, the ratio of higher-earning men to single women has a strong, positive correlation with marriage rates among women in their thirties, but not women ages 22-29.
3. The places with the smallest pool of employed single men generally have fewer marriages.
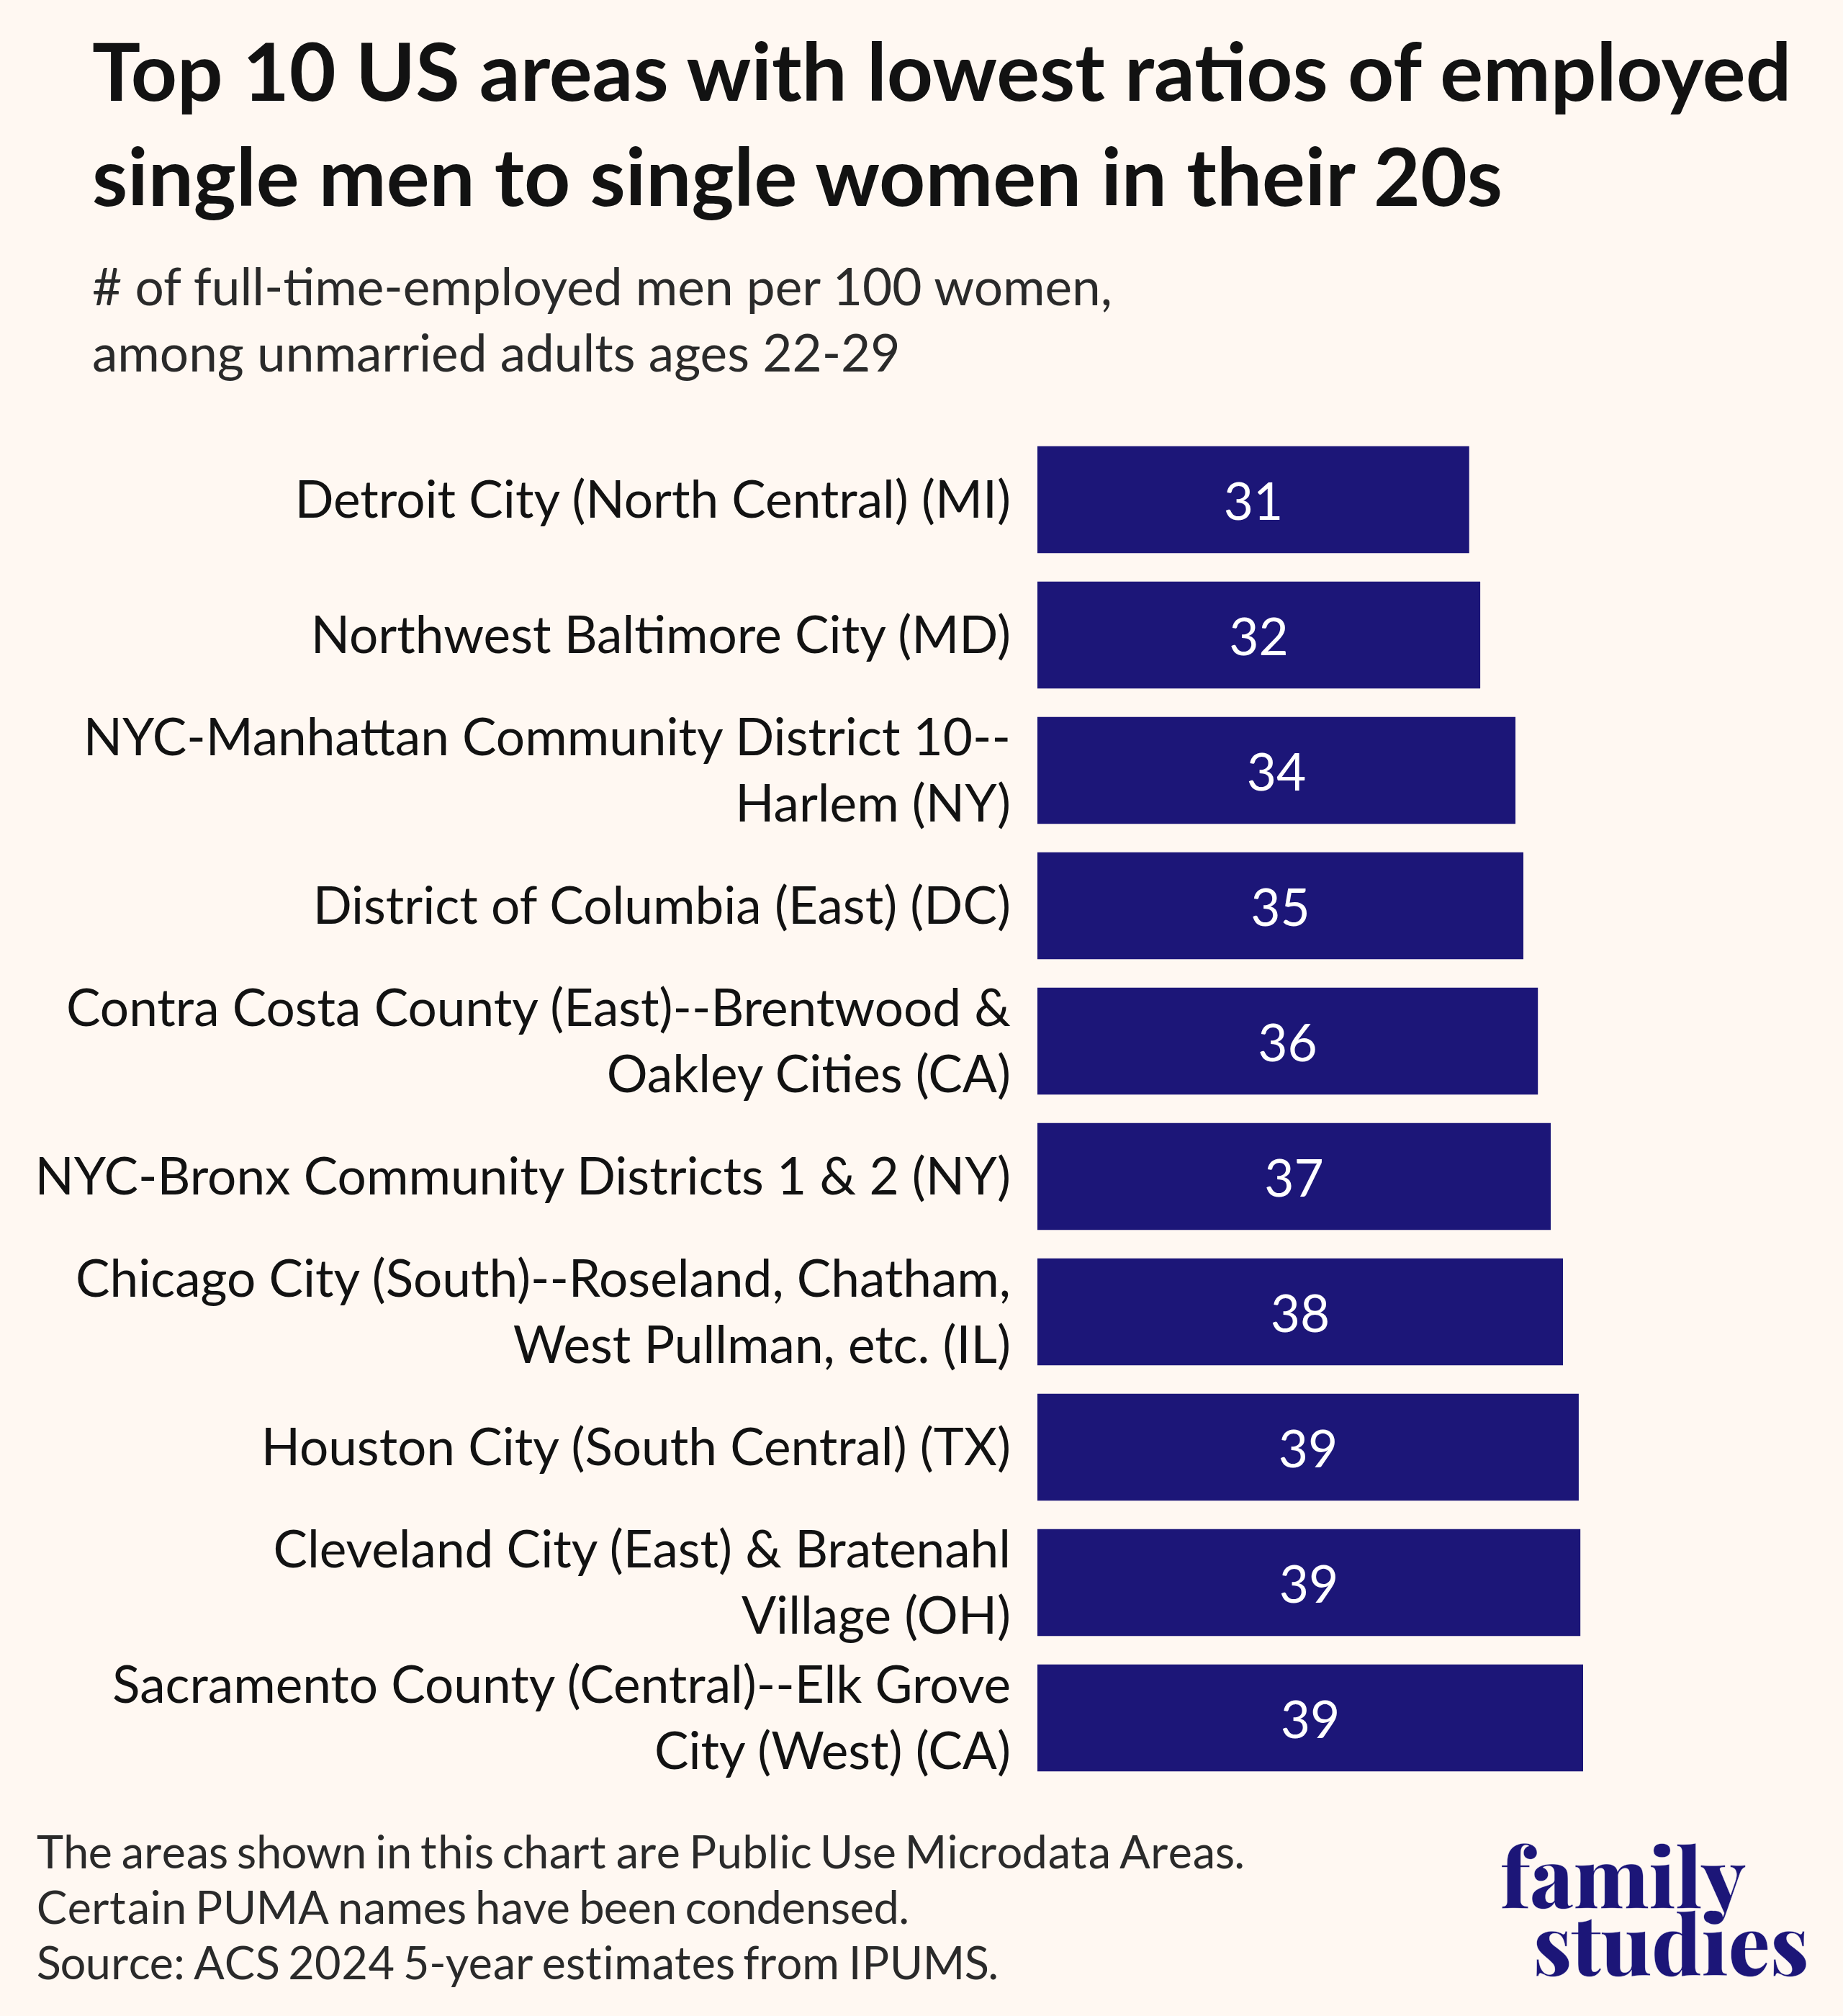
The availability of employed single men is highly correlated with more singles in the area and fewer marriages. For example, among unmarried adults in their twenties, the areas with the least number of employed single men per 100 single women look similar to the areas where most singles live. For example, North Central Detroit has the lowest ratio of full-time employed single men to all single women. For every 100 single women ages 22 to 29, there are only 31 employed men of the same age.
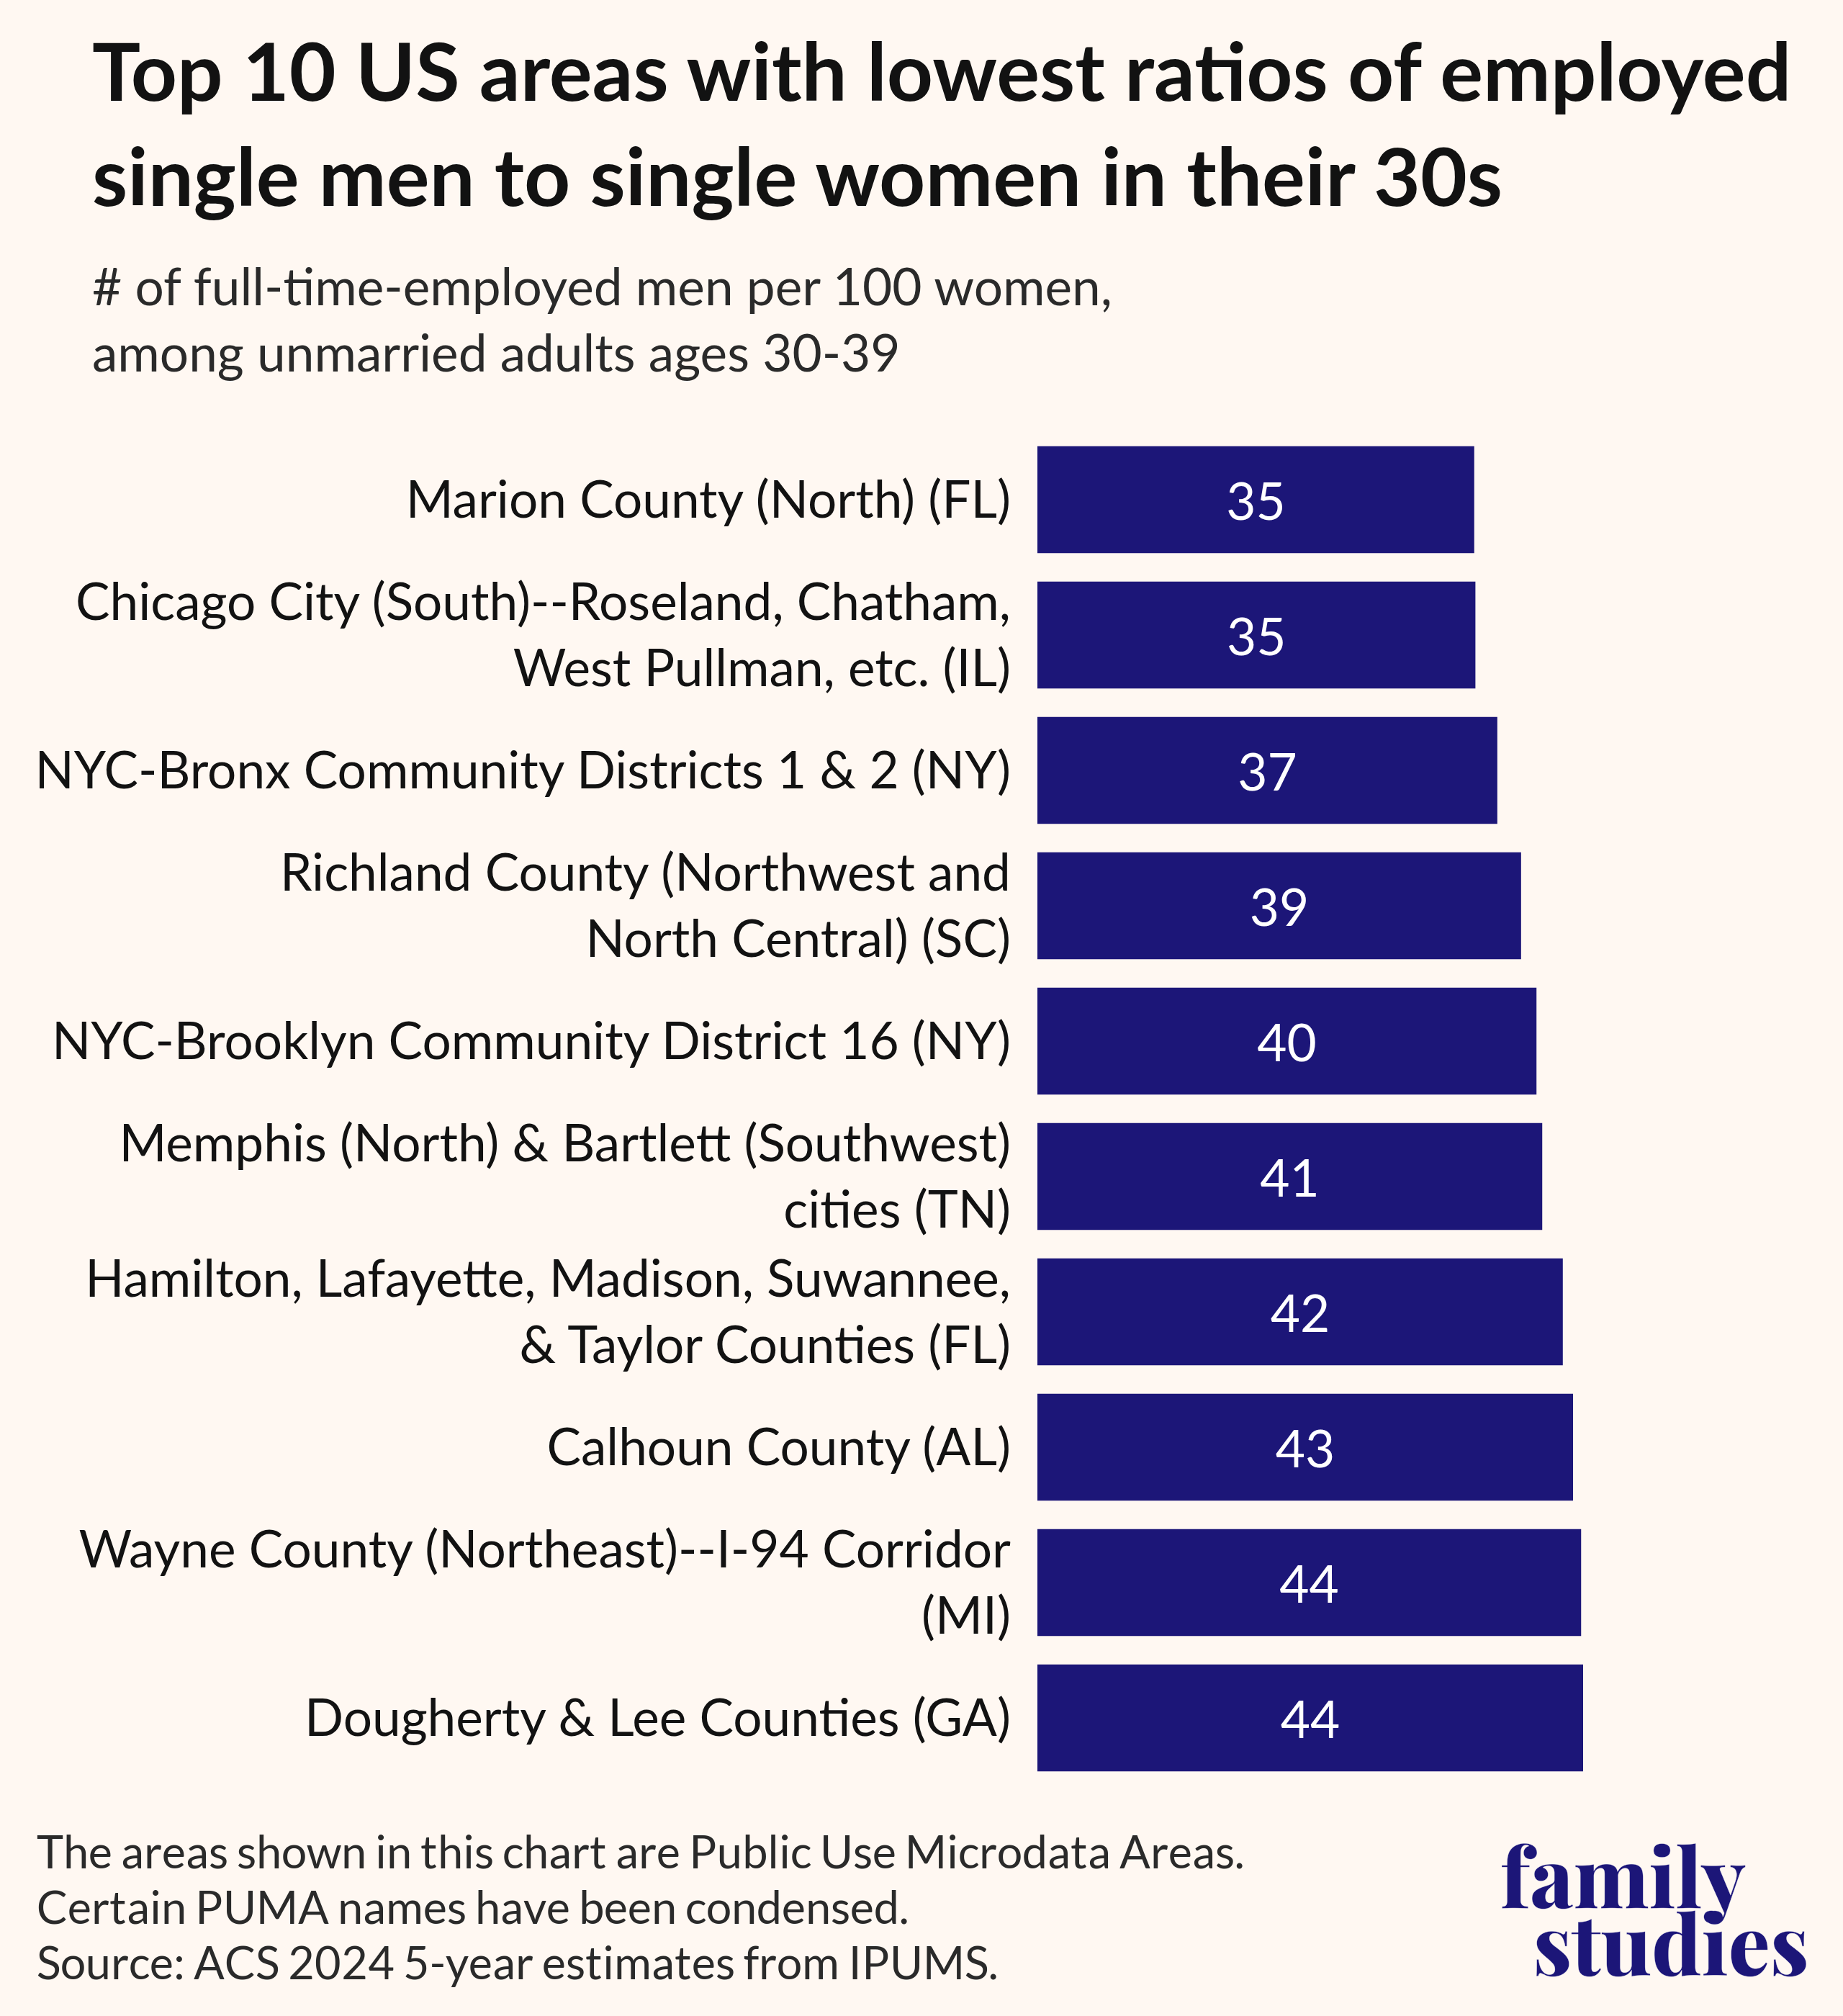
The patterns for unmarried adults in their thirties are similar but point to different areas. The lowest ratio appears in Marion County, Florida, and in south side Chicago neighborhoods, where there are only about 35 full‑time employed single men for every 100 single women. Similarly low ratios are also found in parts of the Bronx and Brooklyn, along with economically-distressed areas like Dougherty and Lee Counties (GA) and Wayne County (MI), making these places some of the most challenging marriage markets for women in their thirties.
Taken together, these maps show that the best places to meet a future spouse aren’t always the biggest or most urban. Marriage markets vary sharply by age and by the local balance of employed single men and women, and those differences matter for anyone thinking about where to find a spouse.
Please visit and share GoGetMarried.org for more.
1. Singles” and “unmarried” are used interchangeably in this article.
2. Within this article, nearly all statistics are presented at the 2020 Public Use Microdata Area (PUMA) level. PUMAs are regions of the country with populations of 100,000 or greater at the time they are specified. However, analyses of the percentage of adults who got married in the past year are based on groups of PUMAs with at least 500,000 individuals each. More information on our grouping process will be available in the methodology section of our Where to find your spouse maps’ corresponding report.
3. New marriages refer to first-time marriages among those who have never been married.


