Highlights
- Is the decline in the affordability of homeownership responsible for the fall in family formation among young adults? Or are homes more expensive because young adults aren't marrying? Post This
- A big reason for the 18-percentage-point drop in young adults’ homeownership rate is the massive 30-point fall in marriage. Post This
If you’ve been on social media in the past 10 years, you’ve surely seen it: The lamentation that it’s impossible for young adults in America today to buy a home. This is a complaint as likely to be offered by populist conservatives as by Taylor Lorenz-style progressives. The new right’s emphasis on family formation and declining fertility rates, in combination with the populist skew of young conservatives, has boosted the issue of housing costs in center-right circles. However, there’s just one problem with blaming unaffordable homeownership for declining family formation: it gets the causality backwards.
The following argument is excerpted from a longer piece that includes additional evidence relevant to this question.
It’s clear that homeownership has declined among young adults. I used the Annual Social and Economic Supplement (ASEC) to the Current Population Survey to look at the share of Americans ages 25-34 that were both homeowners and either a household head or the head’s spouse or partner.1 The data indicate that homeownership within this age group peaked in 1980 at 54 percent. By 2025, the share had fallen about 20 points to 35-36 percent.2
Also clear is the fact that the share of Americans ages 25-34 that are married fell dramatically over this period—from 67% in 1980 to 37% in 2025.
The question is whether the decline in the affordability of homeownership is responsible for the fall in family formation among young adults.
Most Young Newlyweds Are Renters
Let’s start by wiping the rose tint off the lens through which many view this question. Nostalgia about the halcyon past when homeownership and family formation went hand-in-hand is overly sunny. We can consider young first-time newlyweds using decennial census data and the American Community Survey (ACS). In 1960, among Americans under 35 who were one year into their first marriage (and still married), 83% were renters. As late as 1980, 70% were renters. As of 2023, 58% were renting—still a majority.3
If we look at first-time parents under 35 who are married and have a child under two years old, the share who rent tends to be lower than among young newlyweds. But renting was still the norm for new parents during the 1950s and 1960s. In 1960, 69% of young, married new parents rented their home. By 1970, it was still 65 percent. Only by 1980 had it fallen to a minority (47%). Today it’s 35 percent. If we include single parents, 49% of young first-time parents are renters.
That newlyweds and new parents are more likely to be homeowners today than in the past doesn’t necessarily mean that it’s become easier for young adults to own a home. If it really has become more difficult to own a home, we might see less marriage and fewer parents but more homeownership among the advantaged few who do marry or have kids. But the numbers do reveal that it’s simply a myth that most people in the mid-twentieth century delayed marriage and parenthood until they could buy a home. When the oldest Boomers became first-time parents in the 1960s and 70s, they were more likely to be renters than homeowners.
Nor do these figures suggest that it’s become harder for young married couples to afford a home after getting married but before having children. Subtracting the newlywed estimates from the new-parent ones, in 1980, there was a 23 percentage-point difference in homeownership. In 2023, the difference was also 23 points.
To repeat: a majority of young newlyweds and a third of new married parents today are renters; many young adults continue to marry and have children despite not owning a home.
Modest Decline in Homeownership Among Young Marrieds and Singles
Homeownership trends for young adults look decidedly less dire if we take account of the decline in marriage. A simple way to do that is to separate out single and married Americans ages 25-34. I show these trends in the figure below, going all the way back to 1900 using the decennial census and ASEC data.
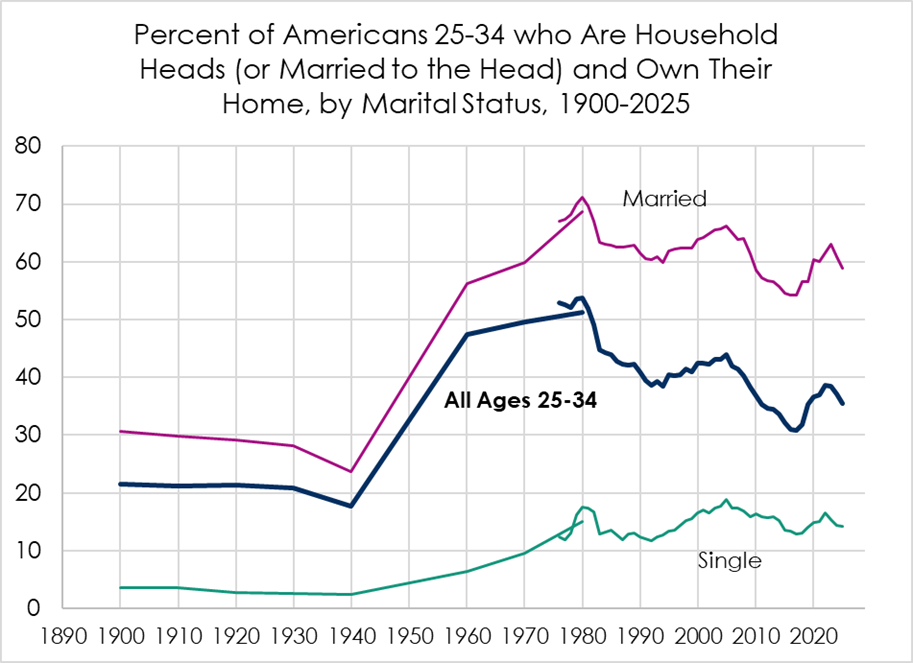
Source: Decennial census public use microdata (1900-1980) and Annual Social and Economic Supplement to the Current Population Survey (1976-2025). University of Minnesota, www.ipums.org.4
Note, first, the trend for single young adults (the bottom lines). Simply put, it has never been the case that most single young people have been able to afford to buy a home—not when marriage was common, and not when it is rare. To be young and a homeowner is generally to be married, and that has always been true.
That said, homeownership among single young adults rose steadily through 1980 and has remained elevated since. Homeownership has not declined relative to past generations. That’s the opposite of what we’d expect to see if home affordability were declining.
Turning to young married couples (the top lines), we see that a majority have been homeowners since the 1950s. The homeownership rate did decline after 1980, but by much less than the overall homeownership rate (the middle lines). The overall homeownership rate fell from 54% in 1980 to 35-36% in 2025, or by about a third.5 Among married couples, homeownership only fell from 71% to 59%. That 17% decline was about half as large as the overall homeownership trend suggests.
A majority of young newlyweds and a third of new married parents today are renters; many young adults continue to marry and have children despite not owning a home.
As recently as 2023, 63% of young married couples were homeowners. That was the same as in 1983 and only 3 percentage points lower than at the height of the 2000s housing bubble. The 2023 rate was also higher than in any year through 1970 and any year from 1985 to 1999.
Most of the decline among young married adults occurred between 1980 and 1983, due in large part to high interest rates that Federal Reserve Board Chair Paul Volcker imposed to arrest runaway inflation. That rate hike made mortgages costlier and also induced a deep recession. Homeownership among young married couples never recovered, though for the most part, it remained above 1970 levels.
One might object to my separating out married young adults on the grounds that perhaps they became a more elite group over time, which could prop up the trend. However, if we look at the 56% of married young adults in 1980 with less than one year of college and compare them with the 51% of married young adults in 2025 with less than a bachelor’s degree, the drop in homeownership went from 68% to 54% instead of from 71% to 59% (a 21% drop instead of a 17% drop).
Simply put, married couples are in a better position than single young adults to afford a home and always have been. A big reason for the 18-percentage-point drop in young adults’ home ownership rate is the massive 30-point fall in marriage. For purposes of affording a downpayment or a mortgage, sharing expenses and pooling incomes have always been important. Indeed, if we look just at those young married couples with two earners, the drop in homeownership has been even smaller than the decline for young married couples generally. It fell from 72% in 1980 to 62% in 2025 (and was 67% in 2023).
Home Prices Have Risen Relative to Incomes, But Not as Much as Might Appear
As evidence of an affordability crisis facing young adults, Patrick Brown of the Ethics and Public Policy Center and others have pointed to the rise in the median sale price of homes sold relative to median household income. Brown cites an increase in that ratio from something like 3.6 in the mid-1980s to around 5.3 by 2023. I combined my own ASEC figures using family income (including cohabiting couples as families) with the same median home price data used by Brown. I get a similar result, finding a rise in median home price to median income from 3.8 in 1980 to 5.4 in 2024.
Certainly, one reason for this increase is that the supply of homes that are affordable to young adults has diminished with the spread of land use and zoning regulations. This factor is especially important in metropolitan areas and regions of the country. But it doesn’t seem to be the most important one for understanding national affordability trends among young adults. If we divide median home sales price by the median family income of married adults ages 25-34, that ratio rises between 1980 and 2025—but only from 2.9 to 3.5. The typical home seems only a little more out of reach for young married couples than it used to be.
Anecdotal Claims About Why Young Adults Delay Home Buying
I searched the massive Roper Center iPoll public opinion archive for polling questions that directly ask people whether they are delaying marriage or childbearing until they can afford to buy a home. There is plenty of evidence that many people would like to own a home but can’t afford to buy one. There is also plenty of evidence that many married couples would like to start a family or expand their family but cannot afford to do so, as IFS has shown, and that many people would like to get married but can’t afford it. These questions on family formation and marriage tend to find that sizable minorities of people who have not achieved their family goals cite financial concerns.
For instance, an especially relevant survey conducted this past fall indicated that 27% of adults ages 18-28 who did not own their own home but wished to be a homeowner said they were delaying getting married or formalizing a long-term partnership until they could afford to buy a home.6 Of course, this is one side of the question—we don’t know how many homeowners in this age group did buy a home before getting married or how many are renting but didn’t delay marriage.
It matters which argument is closer to the truth: economic factors, like the cost of homeownership, are depressing marriage; or declining marriage is making it harder to afford a home.
More importantly, there is essentially no trend evidence that such perceptions or preferences have changed over the long run. Is that 27% of young renters delaying marriage higher or lower than in the past? In theory, it could be at an all-time low, which would hardly be consistent with the claim that fewer people are marrying because of home affordability.
Homeownership for One-Earner Married Couples
It matters a lot for important questions of policy which argument is closer to the truth: economic factors, such as the cost of homeownership, are depressing marriage; or declining marriage is making it harder to afford major purchases, like buying a home. If the decline in marriage and other aspects of social breakdown have economic causes, it may be possible to identify villains at fault, taxes to cut, subsidies to increase, and regulations to tweak. Problem solved. However, if the decline in marriage is more to do with cultural change—changing preferences or other nebulous societal trends—economic fixes won’t do (and we may need to collectively look in the mirror to assign blame).
I’ll close by noting one group of young adults for whom homeownership has plummeted—married couples with one earner. Their homeownership rate fell from 70% in 1980 (about the same as for two-earner married couples) to just 49% in 2025. That was lower than in 1970 (65%) and even in 1960 (60%).
Arguably, these families have been hurt by the greater purchasing power that dual-earner families command, which leaves them at a financial disadvantage when looking for family-friendly homes. The evidence reinforces a conclusion I have made elsewhere: it is harder for one earner to afford what two earners can buy, and the increase in dual-earner families has left sole-earner families worse off than they’d have otherwise been.
This nostalgia for the sole breadwinner model seems to be behind much of the new right’s economic agenda. But the share of young adults pursuing the one-earner model was already small by 1980. According to decennial census data, in 1960, married people ages 25-34 in one-earner couples were 52% percent of all young adults, and they were 41% in 1970. By 1980, according to the ASEC, that was down to 22%, falling further to just 10% in 2025. That drop partly reflected the decline in marriage, but even among married young adults, the share in one-earner couples fell from 62% in 1960 to 50% in 1970 to 31%in 1980 and 25% in 2025.
It's unlikely that this decline in the one-earner model reflects increased economic difficulty. As I’ve argued elsewhere, the patterns of increased employment among married women are similarly impressive among those with more and less educational attainment, those with husbands who have more and less educational attainment, and those with higher- and lower-earning husbands. The rise in labor force participation among Baby Boomer women was preceded by an increase in their educational attainment. These trends long predate any slowdown in wage growth among men, and they occur across the rich world (see Figure 5.1 in this paper). As the opportunity cost of keeping one spouse out of the workforce has risen, fewer families have done so.
The culture has changed. We would do well to recognize that, to accept (or not accept) the trade-offs that our collective choices have produced, and to stop squinting for signs of economic deterioration to wash the reality of these complicated cultural changes away. That doesn’t mean we shouldn’t try to increase incomes or lower housing costs. But it does mean we should perhaps worry less about those things and more about social breakdown.
Scott Winship is a senior fellow and the director of the Center on Opportunity and Social Mobilityat the American Enterprise Institute.
*Photo credit: Shutterstock
1. Starting at age 25 avoids the complication of rising college enrollment, though the basic findings I discuss here are the same if I start at age 20. Requiring people not only to live in an owner-occupied home but to be the household head (or the head’s partner) avoids counting adult children living with parents as “homeowners.”
2. The 1980 percentage is perhaps 1-2 points too low because unmarried partners can’t be identified until 1995.
3. The 2023 estimate (from the ACS rather than the decennial census, used for earlier years) is based on survey question asking if someone was married in the past year and how many times they have been married. The decennial census questions ask about a person’s age when they first married, which can be compared with current age.
4. Cohabiting partners of household heads are excluded from the analyses; other cohabiting partners are counted as single renters. Adults who are married but with an absent spouse or who are separated are also excluded. The “all” trend includes everyone regardless of marital status or cohabitation arrangements.
5. The calculation is 1 - 35.5/53.7.
6. I thank Kathy Steinberg of Harris Insights & Analytics and Lauren Nash of Mother Bear Agency for sharing these results. See also the public write-up of the survey.