Highlights
When it comes to understanding what’s happening with marriage in America, the “real issue that we need to be concerned about is economics,” not the contrasts between “Democrats versus Republicans, liberals versus conservatives, [in other words,] those quick to embrace new modes of life versus those who celebrate tradition.” Family scholars Naomi Cahn and June Carbone recently wrote these words in Time, responding to our research showing that Republicans tend to be more happily married than Democrats.
In Cahn and Carbone’s view, the quality and stability of family life, and the nation’s growing class divide in family life, are fundamentally about economic forces, not partisanship or other larger cultural forces. As they wrote in their book, Marriage Markets: How Inequality Is Remaking the American Family:
[E]conomic inequality [does] more to explain changing marriage patterns than does any discussion of shifting social mores taken in isolation… The story of what has happened to the American family… is at times complex, [but] the conclusion is short and simple: it’s the economy, stupid.
Although we agree that economic forces matter greatly in American family life, they aren’t the whole story. Such economic absolutism discounts the profound cultural forces that have changed family life over the last half century and continue to exert tremendous power today. Our recent research suggests partisanship is one cultural factor linked to the prevalence, quality, and stability of family life in America. How is a different but related cultural force, political ideology, linked to the prevalence and quality of marriage in America today? We take up this question in this Institute for Family Studies research brief.
Journalistic and scholarly accounts of ideology and family life lead us to expect associations between conservatism and marriage. Writing in the New York Times, David Leonhardt recently hypothesized that “the more respect and even reverence for the idea of marriage in conservative communities affects people’s behavior and attitudes toward their marriages.” The work of family sociologist Paul Amato suggests that Americans who adopt more conservative family attitudes are more likely to enjoy higher levels of marital quality.
What, then, is the link between Americans’ worldviews, their odds of being married, and the odds that they find themselves in a happy marriage? In the General Social Survey (GSS), one of the best barometers of American society, ideology is measured by asking respondents to rate their political attitudes on a liberal-conservative continuum (1 = extremely liberal, 7 = extremely conservative). We coded those men and women answering 1 to 3 as “liberal,” those answering with a 4 as “moderate,” and those answering 5 to 7 as “conservative.”
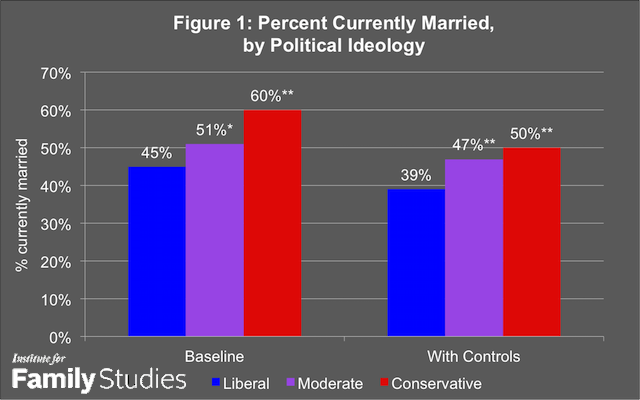
Source: General Social Survey (2010-2014), N = 4,528. *Different from liberal, p<.01. **Different from liberal, p<.001.
Note: Baseline model controls for survey year and region. Full model adds controls for age, age squared, sex, race, education, inflation-adjusted income, and a dummy variable for missing income data.
Figure 1 indicates that conservatives are significantly more likely to be married than are moderates and liberals; in fact, they are about 15 percentage points more likely to be married than their liberal fellow citizens. Moreover, this relationship remains strong after controlling for race/ethnicity, age, sex, and two of the socioeconomic factors highlighted by Cahn and Carbone: income and education. (In all figures, the results are weighted to account for non-response.)
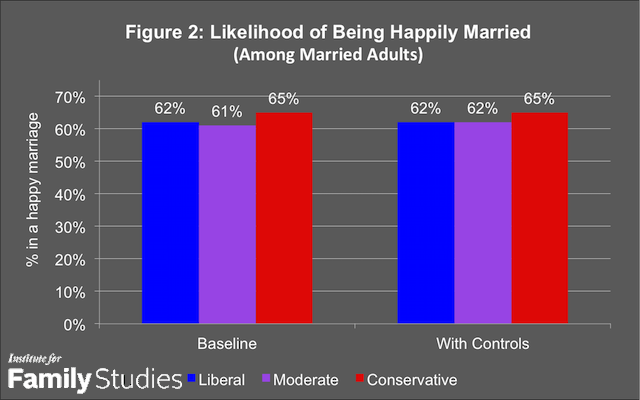
Source: General Social Survey (2010-2014), N = 2,066.
Note: No differences are statistically significant. Baseline model controls for survey year and region. Full model adds controls for age, age squared, sex, race, education, inflation-adjusted income, and a dummy variable for missing income data.
What about the connection between ideology and marital quality? Is there a story there? The answer, interestingly, is no, if we focus just on married couples. Figure 2, examining only married adults, reveals a gap of just three percentage points between liberals and conservatives in the probability of being in a very happy marriage (and this difference isn’t statistically significant). The story doesn’t change once we add controls for race/ethnicity, age, sex, education, and income. Although conservatives are more likely to be married than liberals, their marriages tend to be of equal quality.
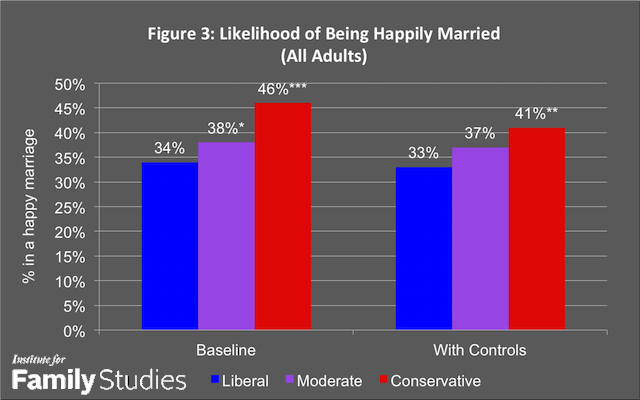
Source: General Social Survey (2010-2014), N = 3,570.
Note: *Different from liberal, p<.10. **Different from liberal, p<.01. ***Different from liberal, p<.001. Baseline model controls for survey year and region. Full model adds controls for age, age squared, sex, race, education, inflation-adjusted income, and a dummy variable for missing income data.
We gain a broader understanding of American family life by combining these two analyses. Figure 3 examines the effects of political ideology on the chances of being in a very happy marriage among all Americans, not just those who are currently married, as Figure 2 depicted. Figure 3 shows that in the baseline model, conservatives are 12 percentage points more likely to be in happy marriages than are liberals. This gap persists, albeit to a diminished extent, after controlling for race/ethnicity, age, sex, income, and education. After adjusting for these differences between General Social Survey respondents, conservatives are about eight percentage points more likely than liberals to be in a happy marriage.
What are we to conclude from these three figures? Overall, conservatives are more likely than liberals to be happily married (Figure 3), simply because they’re more likely to be married in the first place (Figure 1). When we just compare married adults, ideology doesn’t appear to be related to marital happiness (Figure 2). This is in contrast to partisanship, which our previous work shows is closely related to marital happiness. Partisanship and ideology are correlated in contemporary America, but the correlation isn’t perfect. The big difference is that 46 percent of Americans consider themselves to be Democrats, but only 28 percent are liberals (in contrast, there’s only a one percentage point difference between the proportion of conservatives and the proportion of Republicans).
More generally, this Institute for Family Studies research brief suggests that what happens in American family life is not solely about economic factors. Civil society, public policy, law, and culture matter, too. The data we present here are evidence that culture matters. Statistically speaking, ideology predicts marital status among Americans about as well as income or education. In other words, the story of why liberals are less likely to be married and conservatives are more likely to be married is about more than money.
W. Bradford Wilcox is director of the National Marriage Project at the University of Virginia, a senior fellow at the Institute for Family Studies, and a visiting scholar at the American Enterprise Institute. Nicholas H. Wolfinger is Professor of Family and Consumer Studies and Adjunct Professor of Sociology at the University of Utah. Their coauthored book, Soul Mates: Religion, Sex, Children, and Marriage among African Americans and Latinos, will be published by Oxford University Press at the beginning of 2016.
Appendix
For ease of interpretation, we classified Americans as “liberal,” “moderate,” and “conservative” above. But the generally positive relationship between conservatism and marriage noted above holds even if we analyze ideology as a scale, as the below figure shows.
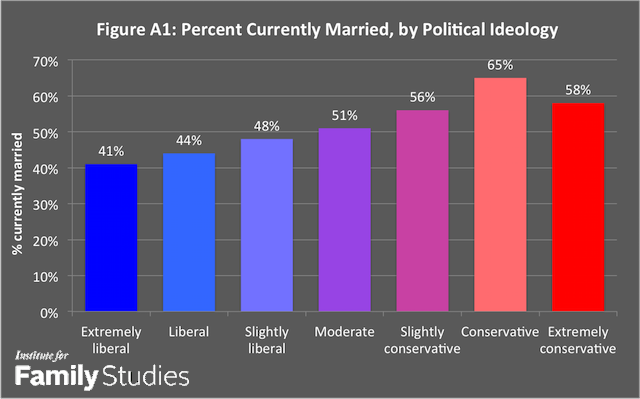
Source: General Social Survey (2010-2014).
Note: Model controls for survey region and year.
The link between ideology and marital happiness is more curvilinear when ideology is analyzed as a scale. See below.
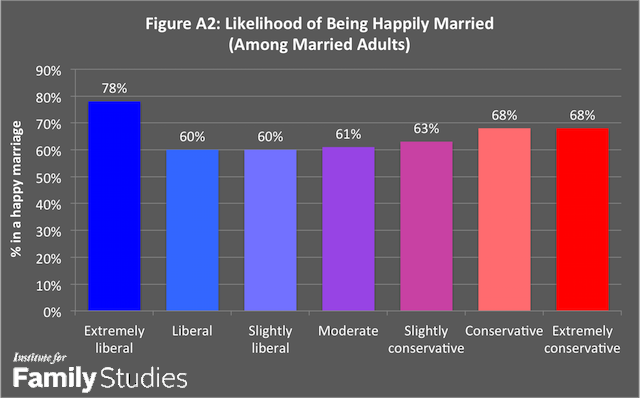
Source: General Social Survey (2010-2014).
Note: Model controls for survey region and year. Although strong liberals have the happiest marriages, they represent less than 3 percent of our sample of married adults. The overwhelming majority of Americans do not have strong political beliefs on either end of the political spectrum.
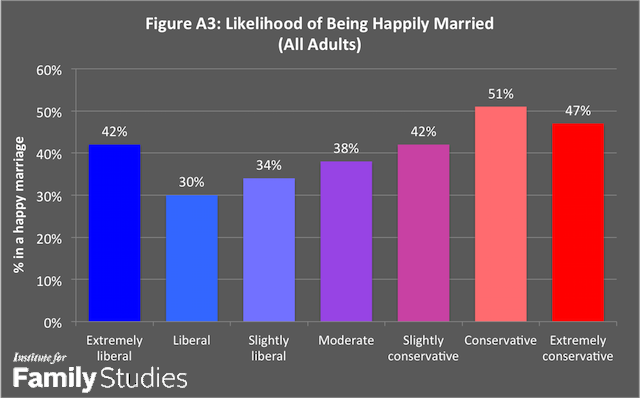
Source: General Social Survey (2010-2014).
Note: Model controls for survey region and year.


