Highlights
- A comprehensive look at more than 40 years of data shows that the share of American families eating dinner together has held remarkably constant, after a decline during the 1980s and early 1990s. Post This
- Family dinners became a bit more common between 2003 and 2011-12, and between 2016 and 2021. And the trends were the same for advantaged and disadvantaged children. Post This
- If anything, eating family dinners has become slightly more common since 2003. Post This
Across a variety of indicators, social capital in America is deteriorating. But one trend appears to be cutting across conventional wisdom—gathering the family around the dinner table. Dinners offer an especially valuable chance for family members to come together to share the day’s highs and lows, discuss personal issues, current events, and big questions of the day, and generally enjoy each other’s company. Some research even finds that frequently eating meals with family members can reduce a child’s likelihood of substance use, violence, and other anti-social behaviors later in life. Few people would question the idea that regularly eating together promotes family closeness and affection.
Unfortunately, research by the eminent scholar of social capital, Robert Putnam, indicates that the share of Americans regularly eating family dinner has declined. Moreover, Putnam has found that family dinners are more common among and increasingly confined to the highly educated.
However, a comprehensive look at more than 40 years of data shows that the share of American families eating dinner together has held remarkably constant, after a decline during the 1980s and early 1990s. And the gap between those with low and high socioeconomic status has remained stable (and may be small). Although many other forms of social connection have undoubtedly waned, family dinners remain the norm for most families.
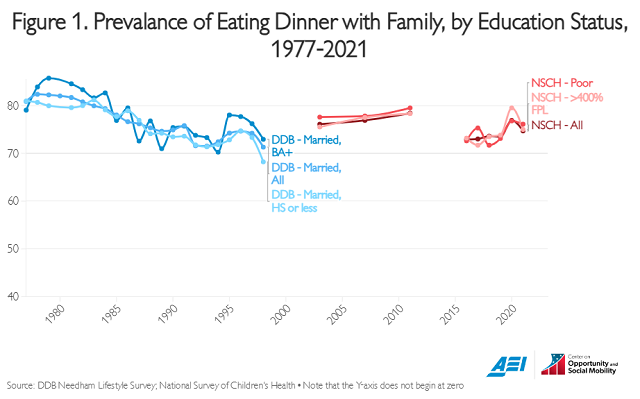
In his influential book, Our Kids, Putnam noted, “from the mid-1970s to the early 1990s...family dinners became rarer in all social echelons, as families struggled to manage the new scheduling complexities of having two working parents.” Using data from the DDB Needham Life Style Survey, which is conducted annually from 1975 to 2005, he showed that the share of Americans who agree with the statement, “Our whole family usually eats dinner together,” fell from roughly 80 to 70 percent.
Putnam had previously used the DDB Needham data in his even-more-influential book, Bowling Alone, and he made it publicly available. We display this data (which runs only through 1998 rather than 2005) in the upper left part of Figure 1. Because the survey included only married adults until 1985, we show the trend for married parents through 1998.1 We also show trends for married parents with no more than a high school diploma and with at least a bachelor’s degree.
Our results reveal the same decline in eating together that Putnam highlighted, but indicate that eating family meals stopped declining in the mid-1990s. However, Putnam found that eating family dinners continued to decline among families headed by parents with no more than a high school education. Since the decline stopped for parents with a college degree, he found the gap between the two widened from the early 1990s through 2005.2
We have been unable to obtain the 1999-2005 DDB Needham data, so we cannot replicate the finding. However, we used two other data sources to compare against the early DDB Needham trend. The National Survey of Children’s Health, sponsored by the federal Health Resources and Services Administration and the Maternal and Child Health Bureau, has been fielded numerous times since 2003. Since the first survey, it has asked respondents, “During the past week, on how many days did all the family members who live in the household eat a meal together?” with options including 0 days, 1-3, 4-6, and every day. Surveys in 2003, 2007, and 2011-12 are comparable with each other, as are annual surveys from 2016 through 2021, but the earlier and later sets are not comparable.
The red-shaded lines in Figure 1 show the share of children in families that ate dinner together at least four times the past week. Although the NSCH does not allow us to view trends separately by education over the entire period, we show trends for children with family income below the poverty line, and children in families with income at least four times the poverty line. Because the three distinct trend segments are not comparable, you should not conclude that family dinners became more common between 1998 and 2003, nor that they became less common between 2011-12 and 2016. But the estimates do show that family dinners became a bit more common between 2003 and 2011-12, and became a bit more common between 2016 and 2021. Moreover, as in the DDB Needham data, there was little socioeconomic gap to speak of, and the trends were the same for advantaged and disadvantaged children.
Finally, Figure 2 shows trends from 2003 to 2022 from another data source, the American Time Use Survey (ATUS). The ATUS records time diary entries for a representative group of Americans, offering researchers a definitive portrait of how, with whom, and where individuals spend their time. It also reduces recall bias, as respondents are asked about their activities the previous day. We show the share of Americans with children that eat dinner at home with at least one family member on any given night.3
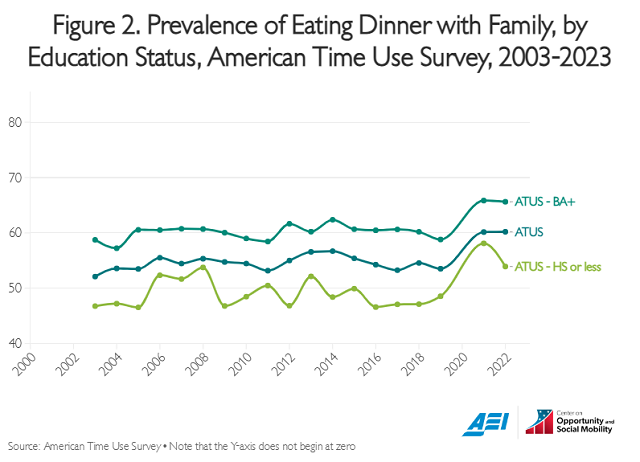
Consistent with the NSCH results, the ATUS data show that, if anything, eating family dinners has become slightly more common since 2003. Even though the ATUS data indicate that slightly more than half of dinners are eaten with family (compared to the NSCH, which says about three-quarters of families regularly eat with each other), both datasets show that the trend in eating dinner with family is slightly up since the early 2000s.4
We find a larger socioeconomic gap in the ATUS than in the other surveys when we compare parents with no more than a high school education to those with at least a bachelor’s degree. But the gap between parents with more and less education does not widen over time.
Our colleague, Daniel Cox, has surveyed American adults and asked them retrospectively whether they had “family meals everyday growing up.” He found that the share answering yes to that question fell steadily over generations—from 84% among the Silent Generation to 38% among Gen Z. The earliest year in our charts is 1977. Someone who was 10 years old in 1977 would have been 44 at the time of Cox’s survey, putting them firmly in Generation X. We can compare them to Millennials, since we have a consistent series from 1977 to 1998, and a 10-year-old in 1998 is counted in the Millennial generation. Some 59% of Gen Xers said they had family meals every day growing up, compared with 46% of Millennials. How does that 13-point drop compare with our data? We find a 10-point decline from 1977 to 1998 among married parents in the DDB Needham data.
Someone age 10 in 2003 would have been a Millennial, and a 10-year-old in 2020 would have been a young Gen Zer. Nothing in our analyses corresponds with the 8-point drop Cox finds between the two generations. It’s possible that because Millennials are looking further back in time than Gen Zers in Cox’s 2021 survey, they are more vulnerable to an exaggerated nostalgic bias, remembering more family meals than actually occurred. If so, that would overstate the generational gap he finds.5
Reasons abound for being concerned about the state of family and social life in America. A declining share of Americans are getting married and having children, and the amount of social time that we spend with each other has been falling. Yet contrary to conventional wisdom, our findings offer a reason for hope—over the past 30 years, family dinner has remained the norm among Americans, and it may even be as common among the vulnerable as it is among the advantaged.
1. The trend including single parents from 1985 to 1998 looks very similar to the trend we show.
2. It is worth noting one issue when looking at trends by educational attainment. Because Americans have grown better educated over time, focusing on a group of parents with a fixed lower level of education means that trends capture an increasingly unusual and disadvantaged group over time. For instance, in the 1977 data, 53 percent of married parents had no more than a high school education. By 1998, just 35 percent did. So the lower share of less-educated parents that ate together in 1998 compared with 1977 partly reflects that the 1998 parents were really less educated relative to their peers. That same issue could affect the 1998-to-2005 trend too. (The shrinking number of parents in the data with such low education may also account for the “noisiness” of the estimates that Putnam presents after the early 1990s, which jump around notably.)
3. The trend in eating dinner with family is similar whether we include all Americans, married Americans—with or without children—or whether we include meals with family outside the home or in someone else’s home.
4. Note that eating dinner together appears less common in the ATUS than in the other surveys. This could reflect the ATUS being less prone to “social desirability bias”—perhaps some less-educated parents, feeling they are supposed to have family dinners, overstate how often that happens. Alternatively, the difference could be due to the ATUS measure applying to a single night of the week, whereas the DDB survey asks about “usually” eating dinner together and our NSCH measure involves eating together most of the past week. However, we think this explanation is unlikely. If most people usually have dinner together, then the ATUS measure looking at one day will tend to produce lower levels of eating together than the other two surveys. If most people rarely have dinner together, the ATUS measure would tend to produce higher levels of family dinners. The share of dinners eaten with family in the ATUS tends to be between 50 and 60%, or 3.5 to 4.2 days per week—not especially high or low.
5. In another analysis, Cox finds small socioeconomic (education-varying) gaps in eating family meals among older generations (Silent Generation through Gen X) but larger gaps among younger generations (Gen X through Gen Z). But since these estimates aggregate multiple generations, it is difficult to compare them with our trends or even to interpret them as secular trends rather than reflecting changes in educational attainment across generations.