Highlights
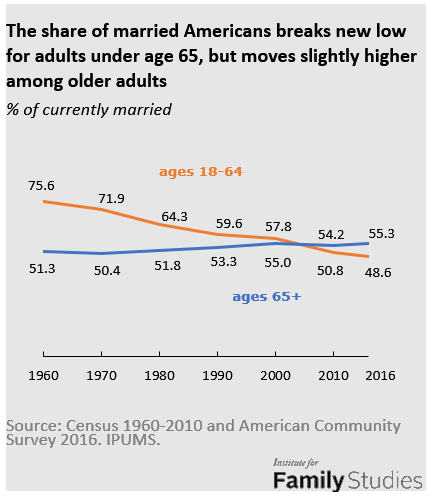
The share of married adults in the United States has remained about 50% for more than half a decade, despite a steady drop since the 1960s. But this overall pattern masks the diverging trends by age: Among those ages 18 to 64, the share of currently-married adults has decreased consistently, reaching a record low of 48.6% in 2016, when the most recent Census data was available.1 In contrast, the share among adults ages 65 and older has increased slightly over the past five decades. As a result, adults ages 65 and older became more likely than younger adults to be married in the mid-2000s, and in 2016, a majority of older adults were married.
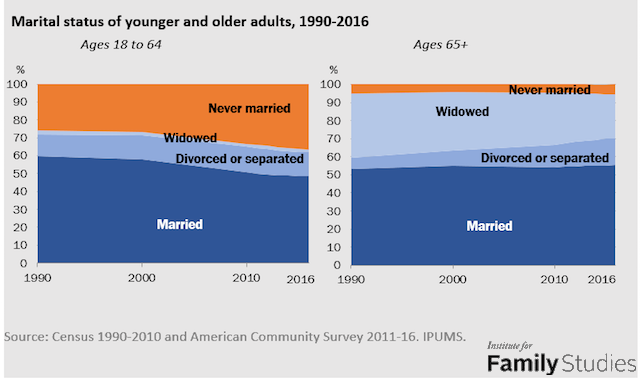
A few factors help to explain the different marriage trends experienced by younger and older adults. Americans are marrying later than ever, and more are living with a partner rather than getting married. And the share of never-married adults under age 65 has risen dramatically—from 26% in 1990 to 36% in 2016—which has directly contributed to the declining share of currently married among younger adults.
On the other hand, the higher proportion of married adults of retirement age today is largely due to a decline in the share of widowed adults, thanks mostly to the longer life of older men. Only less than a quarter of adults ages 65 and older (24%) are widowed today, compared with 35% in 1990. And among women ages 65 and older, the share of widowhood dropped from 50% in 1990 to 34% in 2016. Although the share of divorced or separated adults in this age group has more than doubled during the same period, it is still much smaller than that of widowed adults.
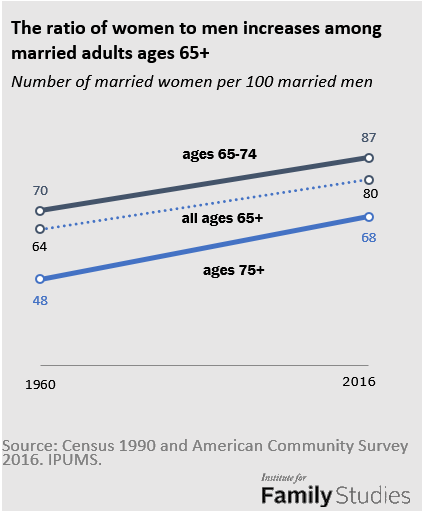
Related to the decline in widowhood, more older women today are married. For every 100 married men ages 65 and older, there are 80 married women of the same age. In 1960, the number was 64. This improvement in the gender ratio is even more dramatic among those ages 75 and older. The number of married women per 100 married men in this age group has increased from 48 to 68 since 1960.
Other key findings from this IFS research brief include:
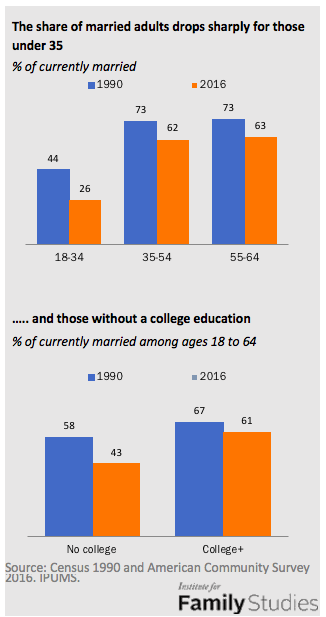
- The decline of marriage is more dramatic among younger adults under age 35 and those without a college education. Only 26% of adults ages 18 to 34 were married in 2016, down from 44% in 1990. And the share of married among adults without a college education dropped from 58% in 1990 to 43% in 2016.
- New marriages are on the rise as the economy recovers from the Great Recession. The number of newlywed adults has rebounded from 4.2 million in 2011 to 4.6 million in 2016, and the current number is higher than that of 2008. But because the number of adults who have never married is also growing, the marriage rate has remained stable in recent years.
- For those who are married, the chance of divorce is lower now. After increasing between 2008 and 2012, the number of newly-divorced adults has declined consistently, reaching a record low of 2.1 million in 2016. The divorce rate has also dropped, especially among those under age 65. The number of new divorcees per 1000 ever-married adults is down from 18 in 2008 to 15 in 2016.
The Decline of Marriage Among Adults Ages 18 to 64
The shrinking share of married adults under age 65 has occurred across all demographic groups and is most significant among young adults. Only 26% of adults under age 35 were married in 2016, compared with 44% in 1990. Middle-aged adults are much more likely to be married than younger adults. However, even among those ages 35 to 64, the share of currently married is down by about 10 percentage points since 1990.
The marriage divide between college graduates and those without a college education has grown wider in the past two decades. Among adults ages 18 to 64, the proportion of currently married is down 15 percentage points for young adults without a college degree, but only 6% for college graduates. By 2016, 61% of college graduates were currently married, compared with only 43% of those without a college education.
All major racial and ethnic groups have experienced a decline in marriage. The share of currently-married adults under age 65 dropped about 10 percentage points for whites, blacks, and Hispanics since 1990. For Asians, the drop was 3 percentage points. In 2016, more than half of Asians (60%) and whites (53%) were married, compared with 45% of Hispanics and 29% of blacks.
Men and women ages 18 to 64 are about equally likely to be married. And the marriage share has declined for both genders over the years. In 2016, 48% of men and 49% women ages 18 and older were married, down from 59% and 60% in 1990, respectively.
Marriage is Rising Among Americans Ages 65+
Different from what we’ve seen among younger adults, adults ages 65 and older today are slightly more likely to be married than older adults a few decades ago. This change is largely due to a decline in the share of widowed adults over time. Those ages 75 and older benefit most from this trend: 39% were widowed in 2016, down from 53% in 1960. During the same period, the proportion of currently-married adults ages 75 and older has increased from 36% to 45%.
Older men used to outnumber women by a large margin among married adults ages 65 and older. With the decline of widowed adults, especially among women, this gender marriage gap has been shrinking over time.
Today, for every 100 married men ages 65 and older, there are 80 married women of the same age. But in 1960, the ratio was 64 married women to 100 married men in this age group. The rise in the ratio is sharper among those ages 75 and older and married: the number of women per 100 men is up from 48 to 68 during the same period.
New Marriages Are On the Rise
The changing share of currently-married adults is mainly driven by the number of newlyweds and divorcees each year. Annual data since 2008 suggests that the number of adults married in the past 12 months has rebounded from a low point of 4.2 million in 2011 to 4.6 million in 2016. And the current number of newlyweds is higher than in 2008, a year after the Great Recession began.
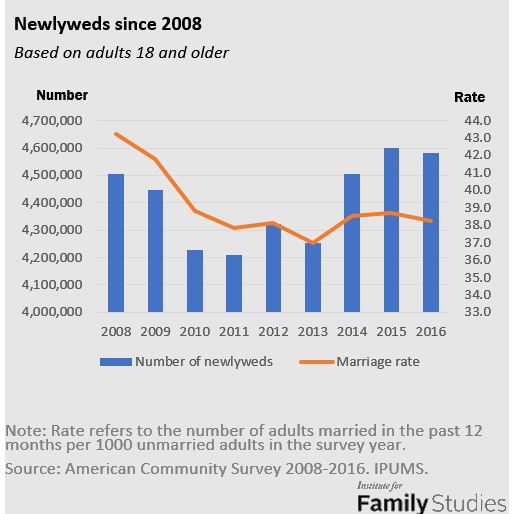
However, measured by the number of newlyweds per 1,000 unmarried adults, the marriage rate has been stable since 2011. For every 1,000 unmarried adults in 2016, there were 38 newlyweds. This is largely due to the rise in the number of never-married adults at the same time.
In 2016, there were a record 76 million never-married adults ages 18 and older, up from 63 million in 2008. And the share of never-married rose from 27% to 30% during the same period.
Divorce Rate Drops
Although a smaller share of adults is married today, among those who are married, the good news is that their likelihood of divorce is also lower. After increasing between 2009 to 2012, the number of new divorcees has dropped every year, reaching a record low of 2.1 million in 2016. The divorce rate (measured by the number of adults who got a divorce in the past 12 months per 1,000 ever married adults) is also down from 14 to 12 per 1,000 ever-married adults during the same period.
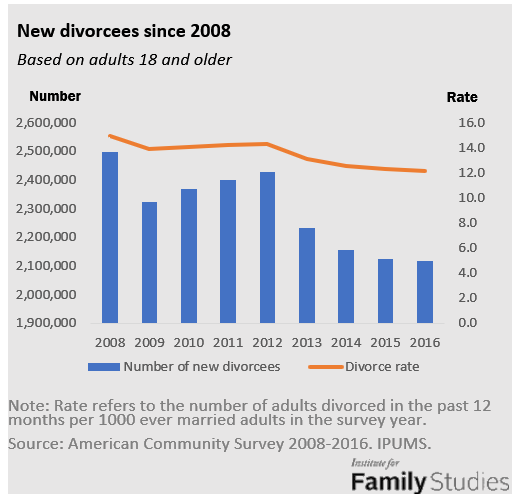
The drop in the divorce rate is mostly relevant for adults under age 64. The number of new divorcees per 1,000 ever-married adults declined from 18 in 2008 to 15 in 2016 in this age group.
The divorce rate among those ages 65 and older has been stable in recent years, staying around 3 new divorcees per 1,000 ever-married adults each year since 2008. At the same time, the rise of so-called “gray divorce” among those ages 50 and older seems to have leveled off: the divorce rate among this group has been around 7 per 1,000 ever-married adults in the past 8 years.
The short-term fluctuation in the number of new marriages and divorces is closely related to changes in the economy and other factors. In the long run, with the passing of older generations, we are heading to an age when marriage will no longer be the institution that a majority of adults live in. Even so, marriage remains the norm for those with a college education. And for those who are married, their chance of divorce is lower. The gap between married adults and those who are not married, aligning with the class divide in the U.S., is likely to deepen in the near future.
Wendy Wang is director of research at the Institute for Family Studies and a former senior researcher at Pew Research Center, where she conducted research on marriage, gender, work, and family life in the United States.
1. Data extracted from IPUMS-USA, University of Minnesota, www.ipums.org.