Highlights
- The period from 2011 to 2019 is the longest period of stability or improvement in children’s living situations since the 1950s. Post This
- These trends vary considerably by race. Particularly for Hispanic and Native American kids, family conditions have deteriorated markedly over the last two decades. Post This
Nearly 4 in 10 children in America are not residing with their own two, married parents (biological or adoptive). This is according to the recently released 2018 American Community Survey, the largest annual social survey carried out in America. As recently as 1960, less than 2 in 10 children lived apart from two married parents, a reality which was approximately stable as far back as 1850. But while the present situation leaves many children bereft of the care, attention, and material benefits of a married household, it’s actually not as bad as it has been in the past: since 2014, the share of children living with two married parents has risen ever-so-slightly, from 61.8% to 62.3% in 2018, and data from early 2019 in the Current Population Survey suggest that 2019 will show further improvement. The period from 2011 to 2019 is the longest period of stability or improvement in children’s living situations since the 1950s.
Where Do Kids Live?
Using a variety of different data sources, including estimates from historic censuses, the American Community Survey, and the Current Population survey, it’s possible to derive estimates of how many children have been living in intact families all the way back to 1850.1
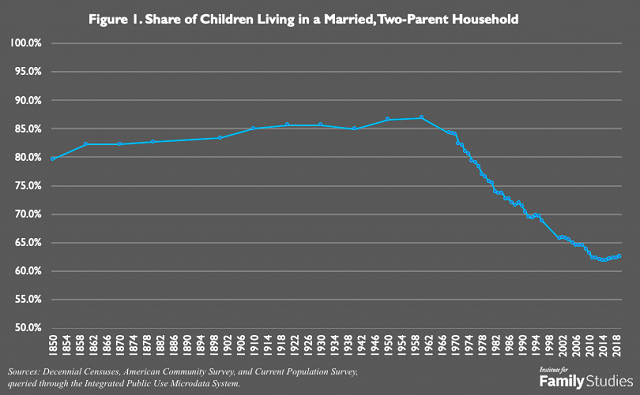
From 1850 to 1960, the share of kids living in married, two-parent families was about stable between 80 and 90%, or even rose slightly. To the extent there’s an increase, it is largely caused by a reduction in parental death rates, not changes in divorces and fertility behaviors.
But then after the 1960s, there’s a precipitous decline in kids living with both parents. From 1960 to 2014, the share of kids living in intact families fell from 87% to 62%.
But as this chart makes clear, the pace of decline has recently changed. Aside from a recessionary decline, it looks like the period since 2000 has seen rough stability in the share of kids living in stable, two-parent environments. That’s great news. Since 2014, there’s even been a tiny bit of an increase, the first real positive change seen since the 1950s.
Not All Kids Experience the Same Trends
However, these trends vary considerably by race. Because I use data from various samples, race-specific estimates can be fairly volatile, so I use simplified racial and ethnic definitions, and smooth year-over-year variation to enable easy comparison. Figure 2 below shows the share of kids living in intact families by major racial-ethnic group from 1870 to today.
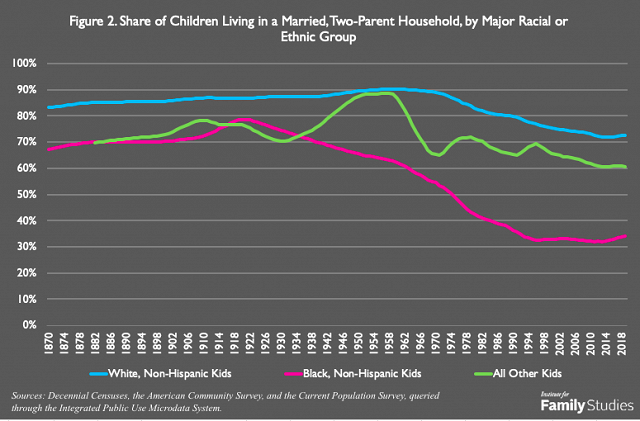
As can be seen, non-Hispanic white kids have considerably higher odds of living with two married parents than kids who are part of racial or ethnic minority groups. This has been true for as far back as data exists. The causes of this are debated. For example, slavery systematically dismantled black families for centuries, and black kids make up the majority of these children at least until the 1970s; likewise, high rates of incarceration disrupt “marriage markets” for many minority-majority communities. Alternatively, some, including me, have argued that specific features of the modern welfare state may have systematically punished minority families and discouraged marriage. But whatever the cause of these differences, it can be clearly seen that kids in minority racial and ethnic groups have always had lower odds of growing up with two married parents. In 1920, it seemed like parity was within reach, but after 1920, there’s a steady declining in the share of non-Hispanic black children growing up with two married parents. Since the 1990s, conditions for black families seem to have stabilized somewhat. Meanwhile, the “other” category has been fairly stable. Hispanics, traditionally, had fairly low rates of births out of wedlock. But while that’s changing, the growth in the number of Asian families is keeping the measure for “other kids” relatively stable.
Given that racial classifications have varied over time, it’s difficult to meaningfully track racial or ethnic groups across a long-term horizon with any greater detail than provided here. But for recent years, when high-quality data from the American Community Survey is available, much more precise estimates can be made, showing that there are huge differences in family structure across racial and ethnic groups, as shown in Figure 3.
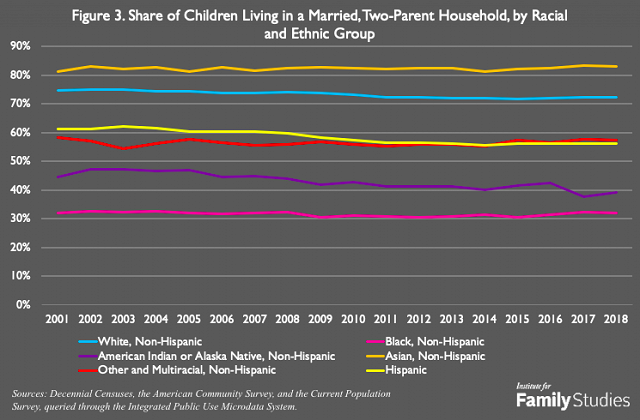
Asian kids are by far the most likely to grow up with two married parents: from 2001 to 2018, a steady 80-85% of Asian children grew up in intact households. Whites come in second, while Hispanics and non-Hispanic other, and multiracial kids are essentially tied for third. At the other end of the spectrum, only about 40% of Native American kids grow up in married, two-parent households, and only about 30% of black kids.
Because these values are very different, it’s hard to visually identify changes. Figure 4 shows the percentage point change since 2001 in the values shown in Figure 3.
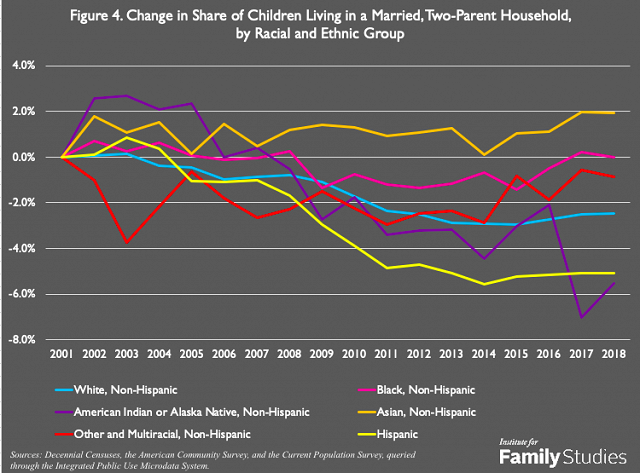
Since 2001, Asian, African-American, and multiracial kids have seen approximate stability in their odds of growing up with two married parents. Non-Hispanic whites have seen a modest decline (though some improvement in recent years). But for Hispanic and Native American kids, the odds of growing up in an intact family have fallen sharply. This is concerning, especially since these are also the groups that have seen the biggest declines in birth rates: they’re having fewer kids, and of the kids they are having, more are growing up without two parents. This speaks to considerable and growing challenges for Hispanic and Native American kids and families.
Conclusion
Overall, the decline in the share of kids growing up in married, two-parent households seems to have stopped for now, and there’s even been a modest recovery. But much of this change is purely compositional: Asian, Hispanic, and multiracial kids are growing as a share of children thanks to immigration and intermarriage, while African and Native American kids are not. As a result, the nationwide aggregate is improving. But among specific groups, the trends are less optimistic. Particularly for Hispanic and Native American kids, family conditions have deteriorated markedly over the last two decades.
Lyman Stone is a Research Fellow at the Institute for Family Studies and an Adjunct Fellow at the American Enterprise Institute.
1. To identify children’s living situations, I use a variety of different measures from three different major data sources (decennial Censuses, the American Community Survey, and the Current Population Survey), all queried through the Integrated Public Use Microdata System. Different surveys have asked different questions in different years, so developing a consistent metric can be challenging. For example, from 2001-2018, I can use my preferred metric: children living in a “married-couple family household” or a “married couple sub-family within a household” who have an identifiable biological, adoptive, or step mother and father in the household. This metric would still include some families where children have experienced considerable instability, as it would include children living with one biological parent and a step-parent. However, this is probably a small share of these children, and would still reflect children growing up at least with a married mother and father figure who is physically present in the household. In 2018, by this metric, 62.3% of kids were living with two married parents.
There are other data sources available. For example, the Current Population Survey asks parents to report their relationship to children in the household. By these metrics, in 2019, about 62.3% of children are living with two biological parents, and about 68.6% are living with two biological or adoptive parents. However, these metrics are only available back to 2007, and in 2019, the variable definitions changed to be more inclusive of same-sex households, causing a modest increase in estimates.
But more importantly, this data does not track the marital status of parents, thus would include two unmarried biological parents living together. Furthermore, the Current Population Survey doesn’t sample all people: it is focused on the civilian, non-institutional population. Military families, or children in juvenile detention or other institutions, would be under-sampled or excluded. These kids may be uniquely likely to not have two resident parents, and thus the Current Population Survey probably overestimatesthe number of kids living with their parents.
That said, while the American Community Survey only reaches back to 2001, and the Current Population Survey’s “self-reported parent type” variable only goes back to 2007, the Current Population Survey has other data on kids reaching back to the 1960s. Variable definitions have changed over time but, broadly speaking, we can use data on maternal and paternal co-residence as well as household family status to get a decent approximation of how many kids lived with their own married parents. As a sanity check for these annual values, we can also use the same definition that we used in the American Community Survey for children reported in the decennial censuses of 1900, 1910, and 1930-2000. These Census estimates closely match the Current Population Survey estimates before 1995, and thus the Current Population Survey estimates from the 1960s-1995 are probably pretty accurate.
Before the 1960s, we can use the aforementioned Census estimates similar to the American Community Survey definition: children living in a married-couple household with two parents present are presumptively living in “intact” families.
But we can actually go back before 1900, and even fill in the missing 1920 Census data. Census responses can link parents to “own children” (which generally means biological, adoptive, or step children of any age) residing in the same household. We don’t want to include adult children, and luckily there are pre-calculated variables for kids under age 5 provided, which should be a good proxy for kids overall. Using this data and comparing it to other data from 1970 and earlier, we can basically get a good approximation of how many kids lived with two “own parents” all the way back to 1850. The result can be seen in Figure 1.