Highlights
In post-2016 election takes, one factor has largely been overlooked: the family factor. At first glance, 2016 looks no different than previous presidential elections. The Republican Party presidential nominee usually does better with married voters and in counties with more two-parent families. This was certainly true for Donald Trump.
The 2016 CNN Exit Poll found, for instance, that Trump won among married voters, winning 52 percent, but lost decisively among the unmarried (see table below). The 26-point marriage gap in the 2016 electorate is large.1 In fact, it surpasses the 24-point gender gap also found in the CNN Exit Poll of the 2016 electorate.
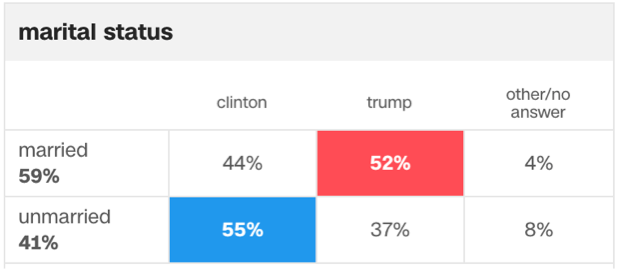
Source: 2016 CNN Exit Poll
Trump’s advantage among the married electorate was also paralleled in his county-level performance among two-parent families. In general, Trump did better in counties with more two-parent families and worse in counties with more single-parent families. As the figure below indicates, our analysis of county-level voting data indicates that Trump’s vote share decreased by 5.7 percentage points for every 10 percentage point increase in the share of single parents in a county.
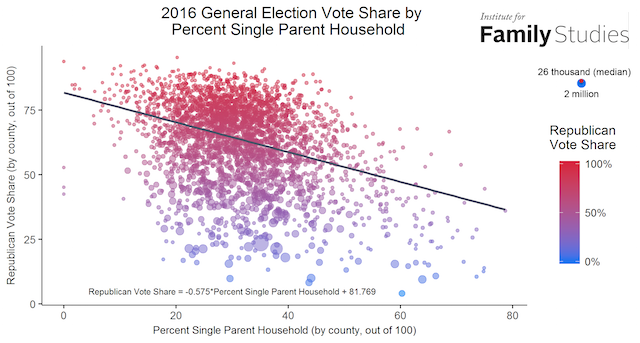
Sources: CNN, Measure of America County Data
What accounts for this classical Republican advantage among voters in more traditional families? Elsewhere, I have argued that cultural and economic factors help account for the Republican edge among married, two-parent families. Specifically:
one reason is that married Americans tend to be more socially conservative and religious than their unmarried peers, and that explanation has gotten a lot of attention. But I think economic security is a big factor here as well. We know that men, women, and children in married families are more likely to enjoy financial success, economic stability, and private health insurance. This means that married adults typically pay more in taxes and depend less upon the government for their financial welfare. These financial factors, then, probably help to explain why marrieds are more likely to vote Republican.
But the standard story about partisanship and family demography does not completely explain 2016. A closer look at the exit polls indicates Trump did slightly worse among the married (53 percent for Trump, 56 percent for Romney), and slightly better among the unmarried (37 percent for Trump, 35 percent for Romney), compared to Romney. In fact, the 2012 CNN Exit Poll marriage gap (shown in the figure below) was larger between the two primary presidential contenders than the gap in 2016—41 points in 2012 versus 26 points in 2016.
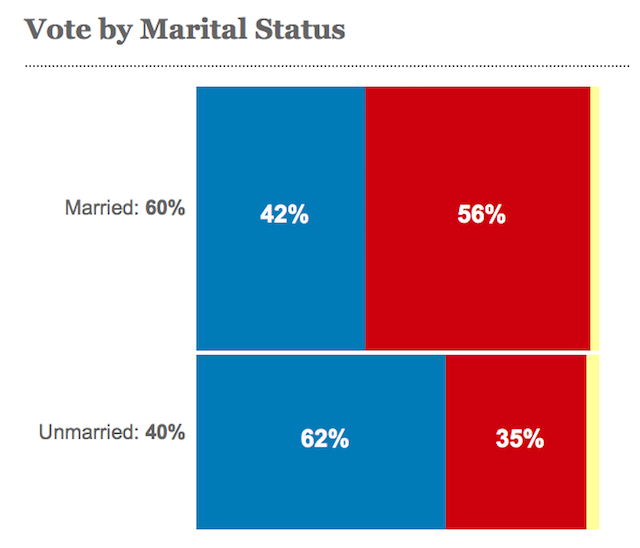
Source: 2012 CNN Exit Poll
Likewise, Romney did worse than Trump in counties with more single parents. As the figure below indicates, Romney’s vote share decreased by 6.0 percentage points for every 10 percentage point increase in the share of single parents in a county in 2012 (versus Trump’s decrease of 5.7 percentage points).
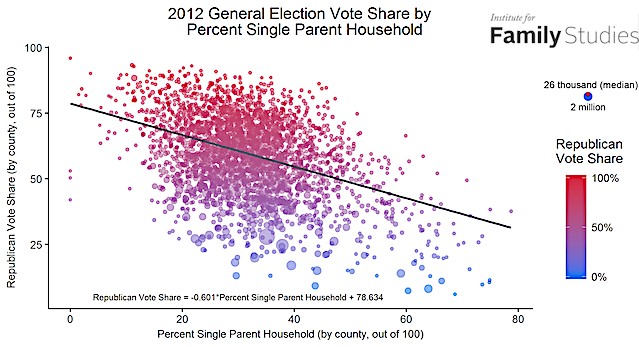
Sources: CNN, Measure of America County Data
In fact, the counties that flipped from Obama in 2012 to Trump in 2016 had higher rates of single parenthood than the typical Republican pattern. As the figure below shows, counties with somewhat more family instability proved more open to switching from Obama in 2012 to Trump in 2016. Specifically, the average share of single parents in consistently Republican counties was 30 percent (the red counties below), while it was 39 percent in consistently Democratic counties (the blue counties below), and 33 percent in Obama-to-Trump counties (the purple counties below).
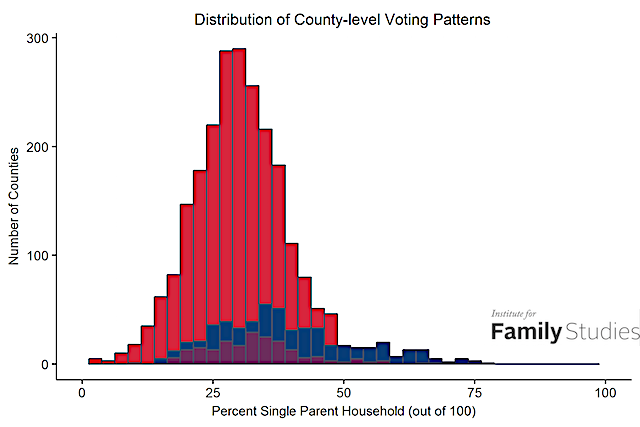
Sources: 2016 CNN election results and Measure of America County Data. Note: Red counties voted Romney in 2012 and Trump in 2016; blue counties voted Obama in 2012 and Clinton in 2016; purple counties voted Obama in 2012 and Trump in 2016.
Why would such counties—which are disproportionately in the Midwest—prove so open to the Trump message? Undoubtedly, concerns and motivations related to trade, immigration, and race were important in explaining the rise of Trump in counties where Obama had previously won. But the breakdown of the family in some of these predominantly middle American counties may have also played a role, giving rise to concerns about the social fabric, lower levels of physical and psychological health, and more economic insecurity—all of which could have made Trump attractive as a candidate of change who will “make America great again,” particularly for the less-educated whites who predominate in these counties.
In recent decades, as I argued in When Marriage Disappears, working-class whites have seen marked declines in marriage and family stability. The psychological, social, and economic consequences of this retreat from marriage have been destabilizing. The fallout of this retreat from marriage may have also helped make some Middle Americans more open to dramatic political changes, including—in this case—switching from Barack Obama to Donald J. Trump. Another way to frame this: in 2016, Trump made inroads among the unmarried and in counties where the traditional family has lost ground.
W. Bradford Wilcox directs the National Marriage Project at the University of Virginia and serves as a senior fellow at the Institute for Family Studies. Jon McEwan is an economics research assistant at Brigham Young University.
1. The marriage gap is calculated by taking the difference between the two candidates for the married and adding it to the difference between the two candidates for the unmarried.


