Highlights
- In every ethnic group, young women are more likely than young men to complete college. Post This
- College students from each race/ethnic group who lived with married birth parents during high school had higher college graduation rates than their counterparts from single-parent, stepparent, and other family types. Post This
- There are large racial disparities in college completion rates. Post This
Often overlooked in debates about the recent Supreme Court decision on affirmative action are the large racial disparities in college completion rates. Among newly admitted students seeking a bachelor’s degree at 4-year colleges and universities, less than half of Black students—46%—complete the requirements for a degree within 6 years.1 By contrast, 78% of Asian students and 68% of white students do so. Graduation rates for Hispanic and multiracial students fall between those of Black and White students but below the overall rate of 65%, as shown in Figure 1.2
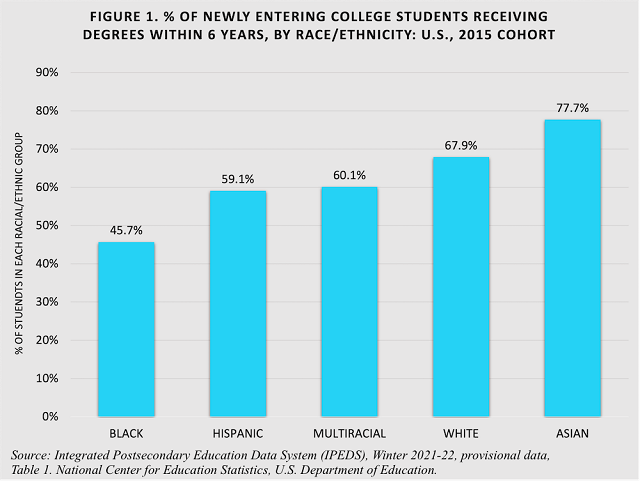
Graduation rates for minority students are somewhat higher at private non-profit than public institutions,3 and considerably higher at elite colleges and universities, such as those of the Ivy League.4 They are substantially lower at private for-profit institutions.
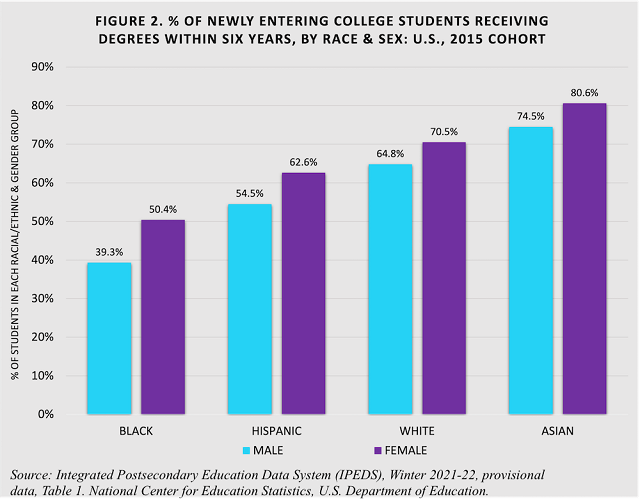
In every ethnic group, young women are more likely than young men to complete college.5 The female advantage is larger for Black and Hispanic than for White or Asian students. The overall graduation rates are 67% for women and 61% for men.
Costs of College Non-Completion
The personal and societal costs of college non-completion are considerable. There are the years that the young person has spent in unsuccessful pursuit of a college credential—time that could have been spent, perhaps, more productively in receiving training or experience in a trade, business, or profession. There is the financial burden6 and stress of having to pay off student loans with no degree to show for it. In addition, the failure is often a blow to the young person’s morale and self-confidence.
For the broader public, each non-completion represents taxpayer or private charity dollars spent on scholarship aid with no obvious return in social capital. There is also the opportunity cost for other students who were more likely to complete college but were perhaps denied admission or financial assistance.
The Role of Differential Admissions Standards
Are racial disparities in college completion due, at least in part, to the practice of college admissions offices accepting minority students with lower achievement in high school [as indexed by high school grade point averages (GPA) and test scores] than other candidates? My analysis of data from a national longitudinal study conducted by the U.S. Department of Education shows that this appears to be the case.7
I carried out a multiple logistic regression analysis based on students in the national sample who attended 4-year colleges in 2004 through 2009. I calculated the odds that attending students in four different race/ethnic groups would complete college and receive a bachelor’s degree. The study groups were Black, Hispanic, Asian, and multiracial students. The comparison group was composed of white college attenders. The proportion of each group who completed college is shown in the blue bars in Figure 3.
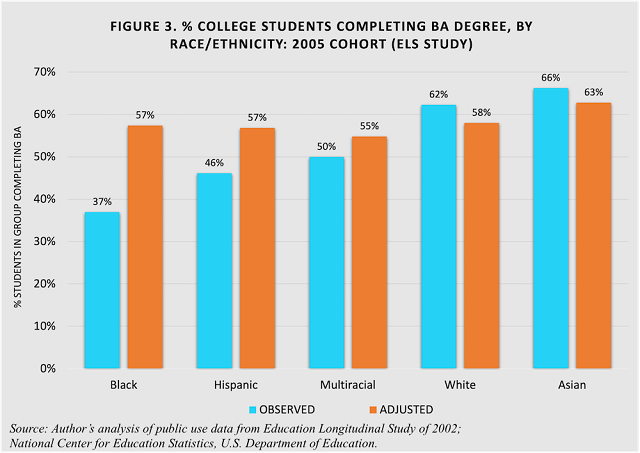
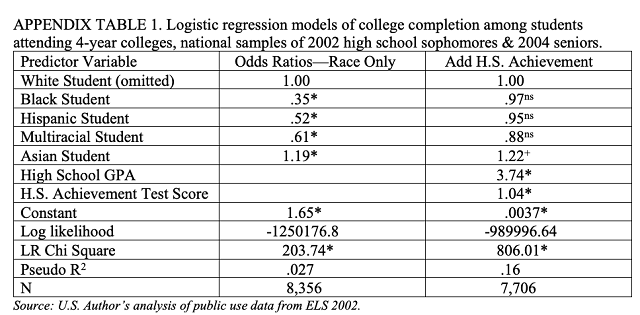
I then added each student’s high school grade point average and score on a composite of tests of reading and math achievement to the logistic regression. The addition of these predictor variables had the effect of raising the odds ratios for each of the minority student groups substantially, as shown in Appendix Table 1. The odds ratios for Black, Hispanic, and multiracial students were no longer significantly different from 1.00, that of the reference group. The odds ratio for Asian students was 1.22 and remained significantly higher than the reference group’s odds, but only marginally so. The expected proportions of students graduating college if high school GPAs and achievement test scores were set at the overall means for college students are shown in the orange bars above.
The addition of high school achievement measures bolstered the predictive power of the regression equation, from accounting for under 3% of the variance in college completion rates to 16%. Parallel logistic regression models for male students only and female students only produced similar results.
The Role of Intact Families
Black and Hispanic students are less likely than white and Asian students to have grown up in married birth parent families. Are racial disparities in college completion due, in part, to these family background differences? My analysis of data from the NCES longitudinal study suggest this is the case as well. As shown in Figure 4, college students from each of the race/ethnic groups who lived with married birth parents during high school had higher college graduation rates than their counterparts from single-parent, stepparent, and other family types.8 However, black and Hispanic students from married birth parent families still had lower completion rates than white and Asian students from similar families.9
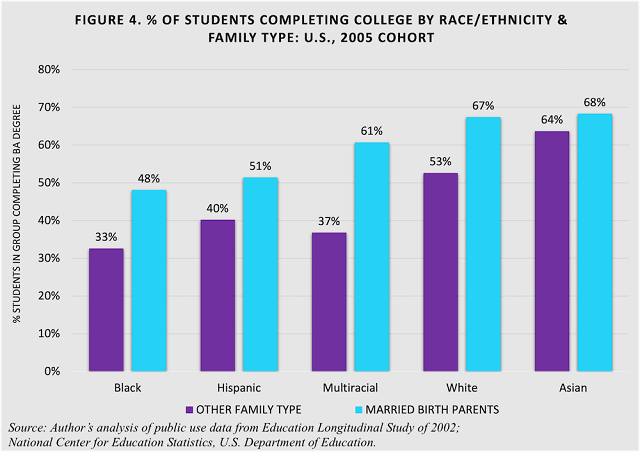
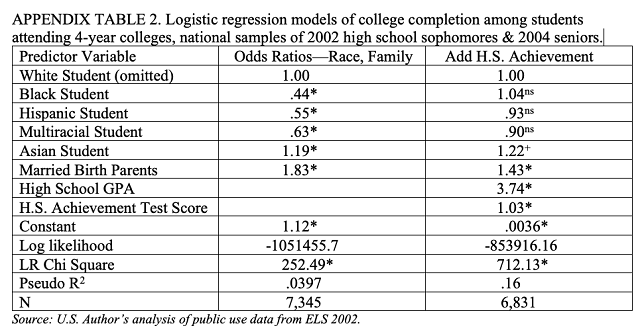
In a multiple logistic regression analysis with race/ethnicity and family structure as predictors, coming from a married two-parent family significantly increased a student’s chances of graduating college (odds ratio = 1.83). This was equivalent to raising the overall proportion graduating from 49% to 63 percent. Adding the family structure indicator increased the variance accounted for from 2.7% to 3.97 percent. Family structure remained significant in a logistic analysis that also included high school GPA and achievement test score (odds ratio = 1.43). Parallel logistic regression models for male students only and female students only produced similar results. (See Appendix Table 2.)
How to Increase Rates of College Completion Among Minority Students
Current rates of college noncompletion among Black, Hispanic, and other minority-group students are unacceptably high. The scenario of being admitted to a selective institution and then failing to matriculate leads to disappointment, stress, financial burden, and career setback for the students involved. And it frustrates the hopes and plans of other students who might be better equipped to succeed in college but are denied admission or financial assistance by selective institutions.
The analyses of longitudinal data described above suggest that if minority students came to college with high school achievement levels equivalent to those of the average of all college students, their college graduation rates would be no different than those of non-minority students. This means that families and schools must do a better job of preparing minority students with the knowledge and skills they need to be “college ready” when they complete high school. For minority students who are not on the college track, schools must do a better job of directing them toward vocational and career paths that do not require a 4-year college degree. Treating junior or regular colleges as institutions for remedial teaching of material that should have been mastered in high school is wasteful and inefficient.
These changes in family and school formation would increase the likelihood that each minority student admitted to college would matriculate and benefit from a completed college education and diploma. And it would put the emphasis for nurturing achievement back where it belongs: on the student’s family and the elementary and secondary schools he or she attends.
The longitudinal analysis also shows that Black and Hispanic minority students are more likely to complete college if they come from married two-parent families. But this result should not be taken to imply that admissions committees should favor students from intact families. Rather, it is a message that one hopes would be conveyed by teachers and counselors to adolescents and young adults who are not yet parents: that the marital and family formation decisions they make will have a major impact on their offspring’s chances of college and career success.
Nicholas Zill is a research psychologist and a senior fellow of the Institute for Family Studies. He directed the National Survey of Children, a longitudinal study that produced widely cited findings on children’s life experiences and adjustment following parental divorce.
Editor's Note: The opinions expressed in this brief are those of the author and do not necessarily reflect the official policy or views of the Institute for Family Studies.
Appendix
1. Table 1. Graduation rates within 150 percent of normal program completion time at Title IV institutions among students who started as full-time, first-time degree-seeking undergraduate students, by race/ethnicity, level and control of institution, and gender: United States, cohort year 2015. U.S. Department of Education, National Center for Education Statistics, IPEDS, Winter 2021-22, provisional data.
2.Ibid. Also low are graduation rates for American Indian or Alaska Native students (43%) and Native Hawaiian and other Pacific Islander students (54%).
3. Ibid. For example, graduation rates for Black students are 46% at public institutions, 47% at private nonprofit institutions, and 21% at private for-profit institutions. For Hispanic students, they are 58%, 64%, and 38%, respectively.
4. See Princeton Review for recent figures for individual Ivy League and other elite institutions.
5. See table cited in Footnote 1 for graduation rates by gender.
6. The median cumulative federal student debt for all non-completers amounted to 35 percent of their annual income in 2009. The debt burden was highest for students in 4-year private nonprofit institutions (median debt equaled 51 percent of borrowers’ annual income). Debt burden among non-completers who started in for-profit institutions increased from 20 percent to 43 percent of annual income between 2001 and 2009.
7. The Education Longitudinal Study of 2002 (ELS:2002) was a nationally representative, longitudinal study of 10th graders in 2002 and 12th graders in 2004. Students were followed throughout secondary and postsecondary years. It included surveys of students and their parents. It also included student assessments in math (10th & 12th grades) and English (10th grade).
8. Differences for black, white, and multiracial students were statistically significant; p < .05 or better.
9. White-black, white-Hispanic, Asian-black, Asian-Hispanic differences all statistically significant, p < .05 or better.