Highlights
Welfare reform is 20 years old today, and it’s as controversial as ever.
As I explained in this space in February, welfare reform affected different people in different ways. It encouraged many to get jobs and gave them additional subsidies for doing so. But those who failed to find work were cut off from cash assistance.
The most popular argument about the law involves the latter group: Are the poorest of the poor worse off today? More specifically, is there a growing share of Americans who live on just $2 a day? A new paper by Scott Winship of the Manhattan Institute argues that these claims are overblown.
Today, Winship and I are both appearing on a panel at the Cato Institute to discuss welfare reform (full disclosure: I saw and provided some trivial comments about his report in advance). Following is an outline of the most important findings from Winship’s research.
The heart of Winship’s report is a series of charts that show poverty statistics before and after numerous adjustments are made. Here, for instance, is one showing the poverty rate for the children of single mothers—the demographic most affected by the 1996 law (the additional lines in the figures indicate child poverty after non-cash government benefits, refundable tax credits, and other factors, such as family size, etc., are included):
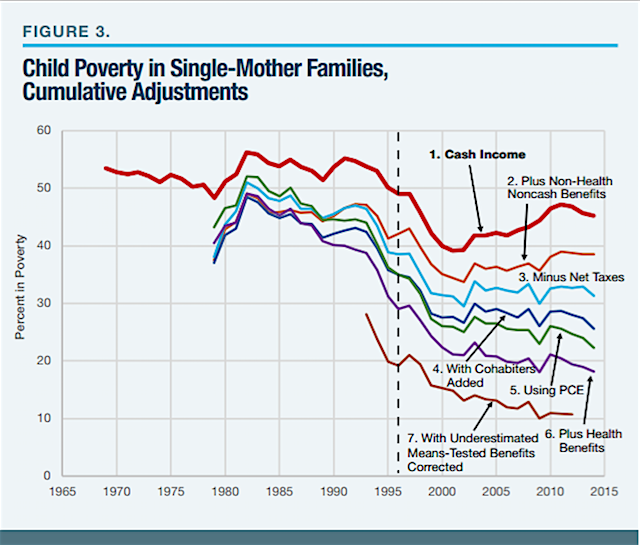
As I pointed out in my previous piece, even just looking at cash income, these kids were better off after the law—though the recession later ate away some of the gains. Even that qualification is hardly necessary in some of the adjusted trends shown here. Incredibly, a major economic catastrophe is all but invisible once the full safety net is taken into account.
These families have access to benefits that cover basic needs, such as food stamps, as well as to tax subsidies like the Child Tax Credit and the Earned Income Tax Credit. This aid helped to keep their poverty rate steady as the recession hit. A better adjustment for inflation, health benefits (valued at 25 percent of their market value), and an adjustment for underreporting push the trends down further.
The bigger debate these days, though, is about not poverty but “extreme poverty.” The idea is that welfare reform made some of the poor even poorer, which doesn’t affect the overall poverty rate.
One point that’s undeniably true is that there was an increase in people reporting very little cash income in surveys—a popular study by Kathryn Edin and Luke Shaefer claimed that 4 percent of households with children now live on less than $2 per person per day in cash. Winship, however, throws a few wrenches in this narrative. For one thing, he argues that $2-a-day poverty: (1) began rising even before welfare reform; and (2) rose even among demographics that weren’t affected by the law, such as the elderly. Underreporting of income seems to be a factor here.
The role of non-cash benefits is another key issue, and Winship has a chart for that. Actually, he has numerous charts for that, but here’s the one most comparable to the graph above:
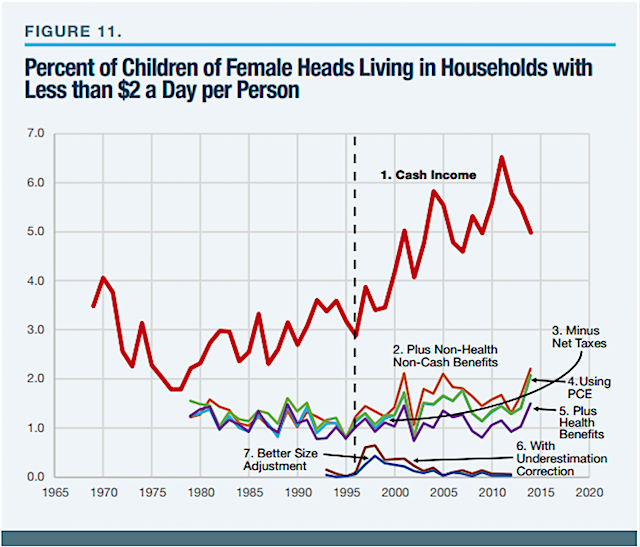
Especially eye-popping here are the bottom two lines, which suggest extreme poverty is basically nonexistent once the data have been properly adjusted. The “underestimation correction” is calculated using the Urban Institute’s TRIM model, which adjusts survey data (where benefits, like income, are underreported) so that they correspond with poverty programs’ administrative data. Based on various criteria, it assigns people as program participants even if they said they weren’t, and includes program benefits in their income. The TRIM model is the product of decades’ worth of work—the original version debuted in 1973—and is used frequently by leading researchers. But I suspect we’ll see some criticisms of it, especially as applied specifically to the problem of extreme poverty, in the weeks ahead.
Also worth noting in this chart: non-cash benefits seem to play a big role in keeping a lid on extreme poverty. That deserves consideration by those who would like to add or strengthen work requirements in those other programs too.
Another part of Winship’s analysis that stood out to me has to do with food security and hunger—specifically, a federal survey that asks (to pick just one example) whether a child in the household has had to skip a meal because there wasn’t enough money for food. More than a decade ago, these data played a part in one of the most important early analyses of welfare reform, which was authored by Winship with famed Harvard professor Christopher Jencks.
Both Winship and Jencks had expected the law to be a disaster, but they found little evidence of it in the data and changed their minds. (Jencks has since changed his mind back, basically endorsing the Edin/Shaefer claim of rising extreme poverty.) Not only was poverty down in single-mother families thanks to rising employment, but the extra costs associated with having a job didn’t seem to be hurting these families either, as evidenced by food data. Winship and Jencks explain:
Our analysis of nearly 50 such measures revealed that food problems among single mothers and their children declined consistently between 1995 and 2000 when the economy was expanding.... [M]ost measures of food problems increased as unemployment rose between 2000 and 2002. But these increases were almost always much smaller than the declines between 1995 and 2000, so mother-only families still reported significantly fewer problems at the end of 2002 than they had in 1995.
The new numbers are more troubling:
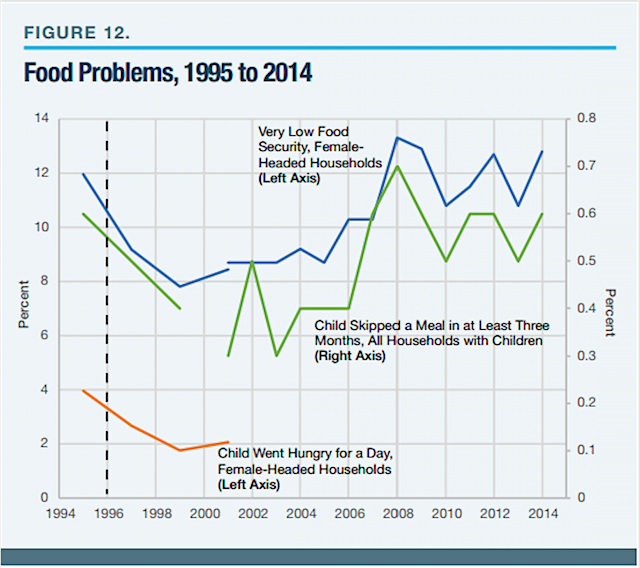
These data, though erratic, would seem to buttress claims that the safety net doesn’t respond to recessions as well as we might hope, and it prods us to reconsider the flatter trendlines in some of the previous charts. Hungry children, after all, are the type of outcome we’re ultimately trying to get at when we look to see whether a household’s income falls under a threshold for “poverty” or “extreme poverty.” The worst problems are rare—and they rose with the recession, not immediately after welfare reform—but they highlight that there is still much to be done in the fight against child poverty (which, to be clear, Winship does not deny).
Winship’s report weighs in at about 100 pages, with reams of data crammed into readable charts, an impressive array of measures employed (including consumption, homelessness, surveys from the food-stamp program, etc.), and multiple appendixes explaining the methodological choices. It is tempting to call it the definitive analysis of welfare reform’s effect on poverty.
Of course, it’s not that simple. Just last week, for example, the Center on Budget and Policy Priorities released a report claiming that the bottom tenth of single-mother families saw their incomes fall as a result of the law, even after adjusting for underreporting and non-cash benefits. There are numerous differences between their approach and Winship’s, including different inflation adjustments and the treatment of health benefits (CBPP excludes them entirely, while Winship values them at 25 percent).
This debate will go on for a long time. So I’ll put it this way: If it’s not the definitive analysis of welfare reform, Winship’s paper is a major contribution to this discussion that deserves a careful reading by everyone concerned with the future of welfare reform.
Robert VerBruggen is managing editor of The American Conservative.