Highlights
- Married-couple families are under-represented and cohabiting couple families are over-represented among SNAP recipients. Post This
- Children born to and raised by never-married mothers were the family group most likely to be getting government subsidized food. Post This
- Children in single-parent families made up a 53% majority of SNAP recipients. Post This
Given the current debate about whether sizable cuts should be made in government expenditures prior to raising the federal debt ceiling, it seems appropriate to take a look at facts and figures about one of the largest domestic spending programs: the Supplemental Nutrition Assistance Program.1 Its acronym is SNAP, but it is still generally known by its former name, Food Stamps. The overall cost of the program last year (including aid to child, adult, and elderly recipients) was $119.5 billion, up from $113.7 billion in 2021 and nearly double the amount allotted in 2019.2
In 2022, 20% of all U.S. children under the age of 18 were in families that received Food Stamp benefits. They made up 14.4 million out of the total child population of 73.3 million.3 The type of family in which children were living had a great deal to do with their likelihood of needing and receiving such aid.
As may be seen in Figure 1, children in single-parent families made up a 53% majority of SNAP recipients; 49% living with divorced, separated, never married or widowed mothers and 4% with custodial fathers. An additional 6% of beneficiaries were living with neither parent but rather with grandparents or other relatives or non-related foster parents.4
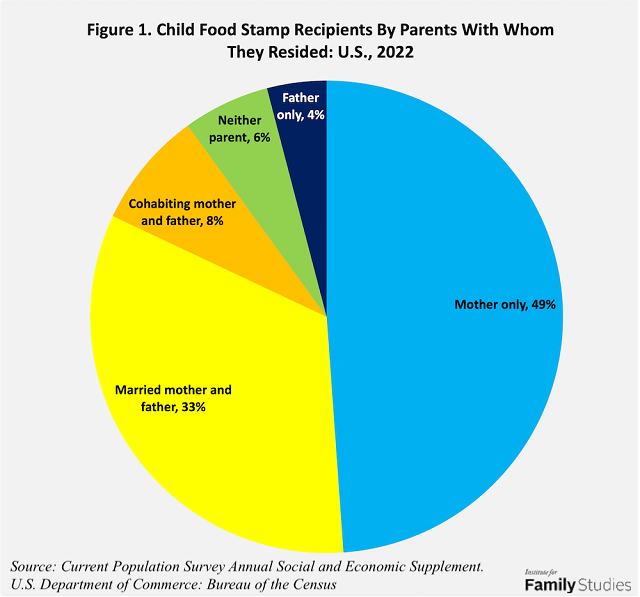
Children living with two parents made up a sizable minority—41%—of SNAP recipients. Married-couple families make up 65% of all children, but only 33% of Food Stamp recipients. Cohabiting couple families make up less than 5% of all children, but 8% of recipients. Thus, married-couple families are under-represented and cohabiting couple families are over-represented among SNAP recipients.5
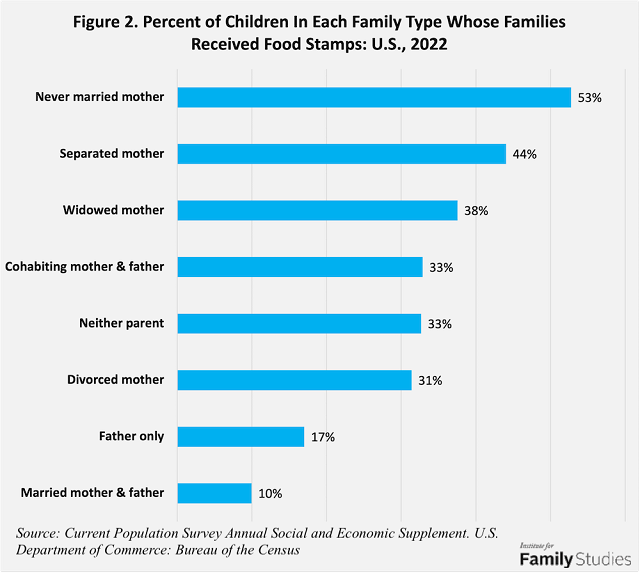
Children born to and raised by never-married mothers were the family group most likely to be getting government subsidized food, while youngsters raised by married couples were least likely. As may be seen in Figure 2, 53% of kids living with never-married mothers were getting such aid, compared to only 10% of those residing with two married parents. Similarly, women who had not (yet) legally divorced the fathers of their children were more likely to be receiving food aid than those who had divorced. For example, 44% of children with separated mothers were getting SNAP, compared to 31% of youngsters with divorced mothers.
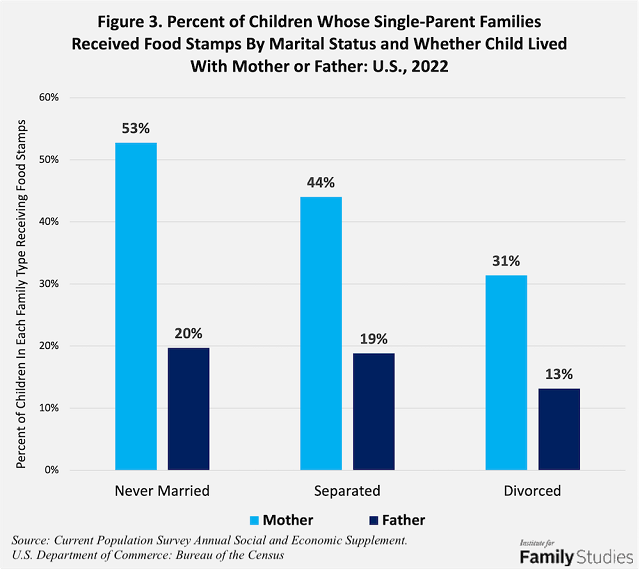
Although mothers are more likely to get custody of children following a marital separation or divorce, youngsters who live with fathers are generally better off financially. This may be seen in Figure 3, which compares the proportions of kids getting SNAP in three types of single-parent families: never married, separated and divorced, depending on whether they live with their mothers or fathers. In each case, children are less than half as likely to need or get food assistance if they live with Dad rather than Mom.
Arguments for maintaining or increasing SNAP funding are that it is a major weapon in the fight against child poverty6 and hunger. It also provides a financial boost to American farming. Arguments for cutting or reforming SNAP are that the program is an enabler of parenthood outside of marriage and reduces the need for parental work efforts and child support payments by non-resident parents. It may also make it less likely that separated and unmarried parents come to custody and support agreements that would ultimately be to the long-term benefit of the children involved.
Whether you find the pro or contra arguments more persuasive, now is the time to try to make your views heard by members of Congress and other shapers of federal policy.
Nicholas Zill is a research psychologist and a senior fellow of the Institute for Family Studies. He directed the National Survey of Children, a longitudinal study that produced widely cited findings on children’s life experiences and adjustment following parental divorce.
1. Loveless, Tracy A. Supplemental Nutrition Assistance Program (SNAP) Receipt for Households: 2018. U.S. Department of Commerce: Bureau of the Census.
2. Food Stamps in Peril? Record Costs for SNAP in 2022 Put the Program in Debt Ceiling Crosshairs” by Vance Cariaga. Yahoo! January 30, 2023. 56
3. Table C3. Living Arrangements of Children Under 18 Years and Marital Status of Parents, by Age, Sex, and Selected Characteristics of the Child for All Children: 2022. Numbers exclude children living in group quarters, and those living independently as a householder or spouse. Data from the Current Population Survey Annual Social and Economic Supplement. U.S. Department of Commerce: Bureau of the Census.
4. Author’s analysis of data from Census Table C3, cited above.
5. Ibid. The Census Bureau’s categorization of married couples includes more than married birth parents of children. It also includes birth parent-stepparent families and adoptive families.
6. Jolliffe, D., Margalitic, J. & Ravallion, M. (2019). Food stamps and America’s poorest. Working paper 26025. National Bureau of Economic Research.