Highlights
With tax reform in the news, it may be worth taking a look at some basic data on which states would be most impacted by a few of the proposed changes. The IRS produces local-area data for some tax provisions, allowing us to estimate impacts. We can then correlate these areas with political preferences, as reflected in the 2016 election.
To start with, we can look at the proposed expansion of the child tax credit to $1,600 or $1,650, as well as the expansion of credit refundability. If we plot the child tax credit as a share of IRS-reported Adjusted Gross Income, we can see which areas get the most benefit from the tax credit, and then plot that against the Democratic Party share of the 2016 Presidential election vote.
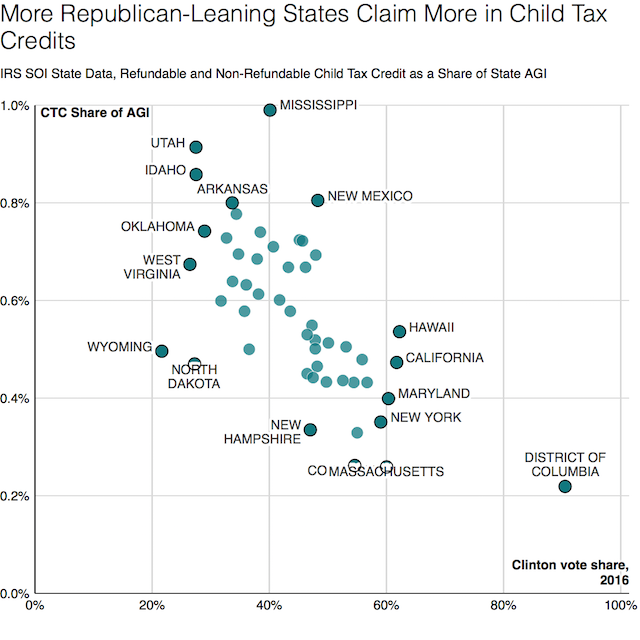
As you can see, the higher the density of child tax credit claims, the lower the state level of support for the Democratic Party. And it’s worth noting that explaining this is a bit challenging. The trend is not simply because there are a lot of poor people in states that narrowly vote Republican: the child tax credit phases in for the poorest Americans and has limits on refundability, and it phases out for the richest. In other words, if GOP states were having their stats juked by large, low-income local minority populations who simply weren’t voting, it wouldn’t show up in this data, because low-income people cannot claim as large of credits. Plus, the most extreme Republican states are those with the highest claims, and Democratic-majority states have big minority populations as well.
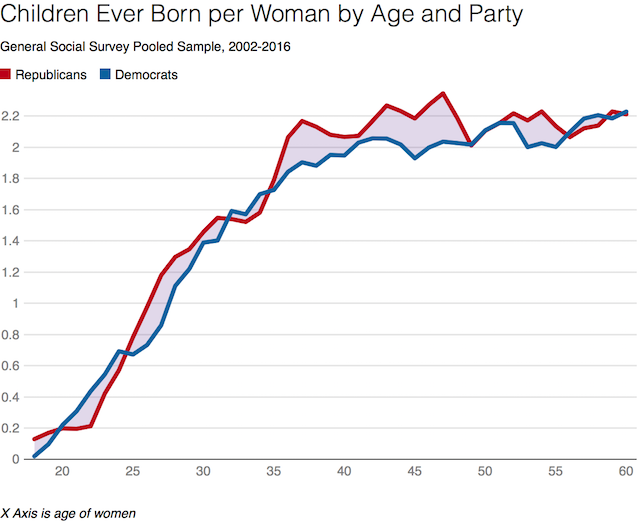
But it’s not higher Republican fertility either. Data from 2002-2016 of the General Social Survey suggests that Republicans and Democrats have about the same overall fertility rates. The graph below shows the number of children ever born to women ages 18 to 50 by partisanship.
Maybe the high-fertility Republicans and Democrats all cluster together in GOP-majority states, while the low-fertility Republicans and Democrats all cluster together in Democratic-majority states. It’s hard to say for sure. But one way or another, Red states end up being big beneficiaries of the child tax credit, and any expansion of the credit would overwhelmingly favor them.
Next, we can turn to another major proposal: many itemized deductions other than the mortgage interest deduction and the charitable deduction. Unfortunately, many of these deductions don’t have data breakouts from the IRS; the biggest one that does is the state and local tax deduction. Keeping in mind that this is the lion’s share of removed itemized deductions, here’s a graph of all itemized deductions other than the charitable and mortgage interest deductions:
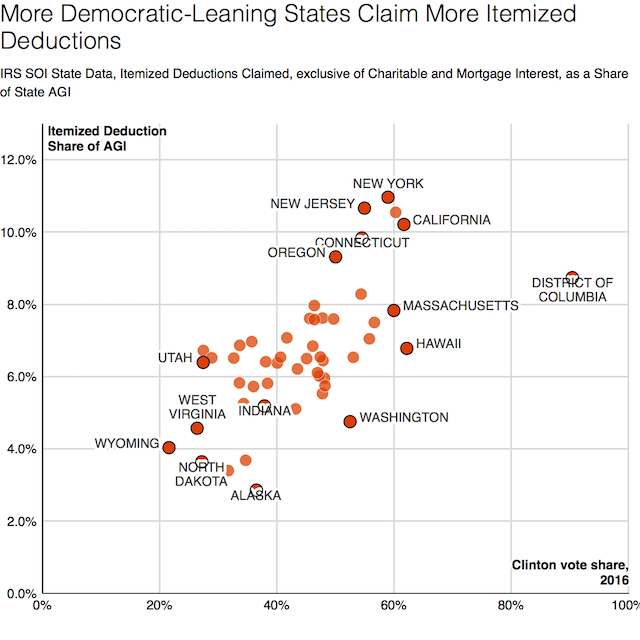
As you can see, this general elimination of numerous deductions falls disproportionately on Democratic-majority states. States claiming the largest state and local tax, education, childcare, educator expense, and other deductions tend to be more Democratic. Again, it’s tricky to say why this is: some of these trends reflect higher incomes, some reflect greater urbanization, some reflect higher state and local tax policies, and other factors are difficult to determine. But while the causal origin of this trend is unclear, the effect of tax reform is unambiguous: Blue states lose their favored deductions.
Moving on from these general deductions, we can look at the distribution of the charitable contribution deduction, which would be maintained, but since the standard deduction would be doubled, most middle-class families wouldn’t claim this deduction anymore. So, let’s look at the charitable contribution deductions only of taxpayers earning over $250,000 per year, as these are the people most likely to be impacted by keeping the charitable deduction alongside a much bigger standard deduction.
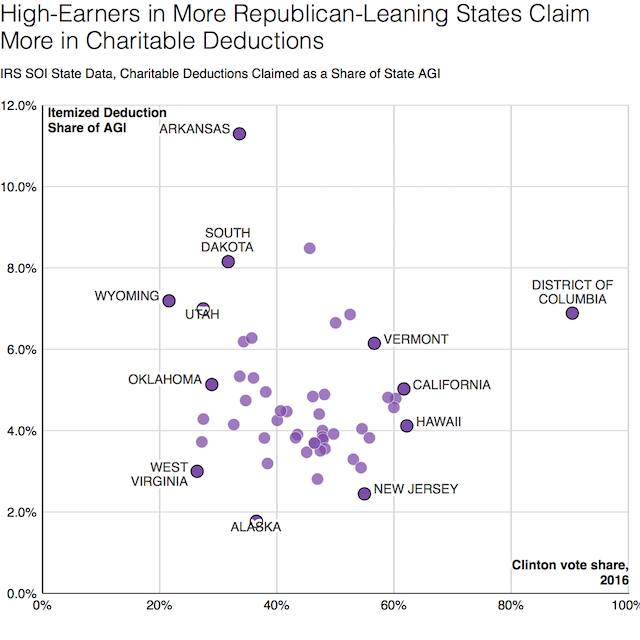
Once again, Republicans are keeping a tax provision that most favors Red states. Broadly speaking, while determining causality may be tricky, the higher the rate of deductible charitable giving among the high-earners in a state, the less Democratic its voting profile in the 2016 election. This is especially interesting because, for the charitable deduction generally, this trend doesn’t hold. The correlation between the Democrat vote share and charitable giving deductions as a share of income for the whole taxpaying population is -0.13, suggesting that variation in vote share explains less than 2% of the variation in charitable giving. But when we restrict to $200k+ earners, vote share explains 13% of the variation. Meanwhile, for middle-income taxpayers, there’s no correlation at all: the Red and Blue middle class have similar rates of deductible charitable giving across states.
So, the Republican plan ever so carefully preserves a deduction that will only be used by people who tend to live in red states: charitable deductions over the high standard deduction threshold.
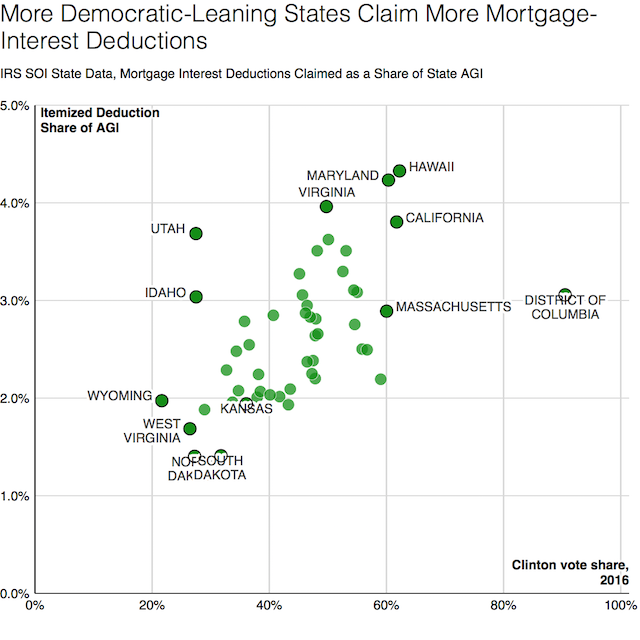
This litany of partisan-favored proposals finally cracks at the mortgage interest deduction: Blue states actually get much more of the benefit of this provision than Red states, partly due to high housing costs.
But there’s a catch! The mortgage interest deduction is capped. Very expensive homes would not be fully deductible. We can see which states would be impacted by this cap by looking at the average mortgage interest deduction claim size.
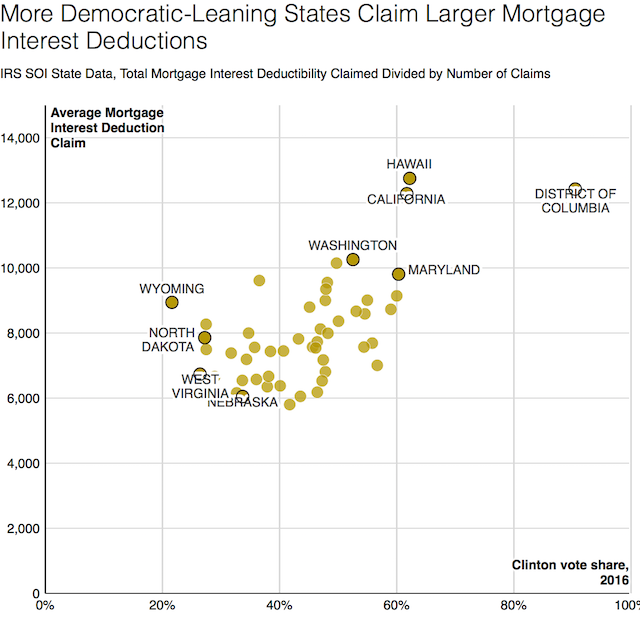
And once again, partisanship rears its head: Blue states tend to have a higher average claim size, suggesting a larger share of Blue state mortgage interest deduction claims would probably be subject to the cap established.
These trends can be read different ways. On the one hand, if you think the proposals are good on their face, then these proposals simply show that Blue states have been net beneficiaries of bad tax policy; complexity, this story goes, serves as an implicit subsidy of Blue states. On the other hand, if you’re a bit more skeptical of the value of, say, jacking up taxes on adoptive parents, then you may wonder what these policy changes are really about. They sure look like crass log-rolling; dumping the costs of the plan onto the Blue states, in order to deliver benefits to Red states.
Lyman Stone is a Research Fellow at the Institute for Family Studies, and an International Economist at the U.S. Department of Agriculture, where he forecasts cotton market conditions. He blogs about migration, population dynamics, and regional economics at In a State of Migration.