
Highlights
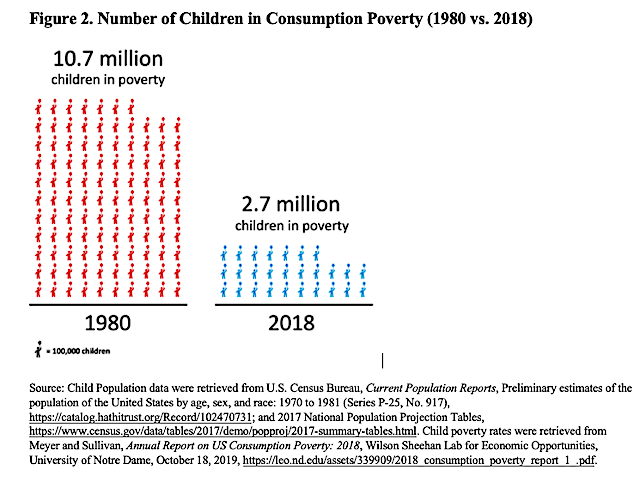
- Using the Meyer-Sullivan consumption poverty measure anchored to 1980 standards, we found that 8 million fewer children were in poverty in 2018 than 1980. Post This
- A comprehensive and honest look at child poverty in the U.S. shows that American children are doing better than ever; this progress was at least partly due to safety net program expansions for low-income children. Post This
- Child poverty in America has steadily declined for more than 50 years, and in 2018 (the most recent year of data we have), the child poverty rate was at an all-time low. Post This
Some politicians describe the United States as a nation unable (or unwilling) to address child poverty. One Presidential hopeful recently said that America has, “The moral obscenity of having the highest levels of child poverty in the industrialized world.” But in truth, child poverty in America has steadily declined for more than 50 years, and in 2018 (the most recent year of data we have), the child poverty rate was at an all-time low. When politicians and pundits suggest otherwise, not only do they mislead the American public, but they also make it harder to further America’s progress against child poverty.
Why is child poverty in America so misunderstood? One reason is because the measurement of poverty is rife with conflict (both globally and domestically). The poverty measures that portray the worst possible scenarios get the most attention, even when they are flawed. This is why, in a recent report, I present an alternative (and more accurate in my opinion) view on the state of child poverty in America. When people downplay the progress we have made, it provides support for the wrong policies that could harm rather than help those children who are the most in need.
Another reason child poverty is misunderstood is because the U.S. Census Bureau, the producer of the nation’s “official” poverty statistics, estimates two widely inadequate poverty measures. The Official Poverty Measure (OPM) vastly overstates poverty because it doesn’t consider the value of most government benefits for low-income people as income. The Census Bureau’s alternative Supplemental Poverty Measure (SPM) was supposed to fix this problem, but it is equally flawed because it defines who is poor based on relative income distribution rather than the typical expenses necessary to cover basic needs. This makes it impossible to assess the effects of anti-poverty policies over time.
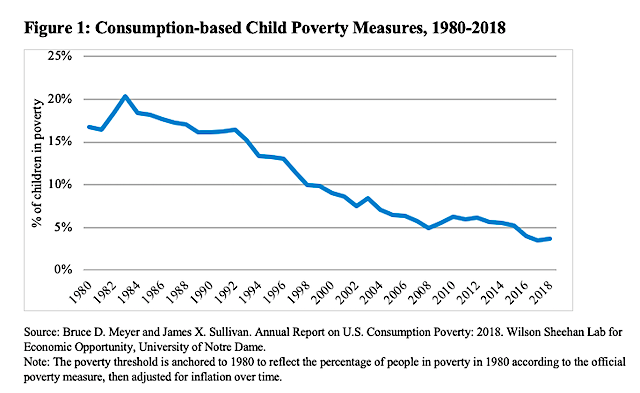
Fortunately, scholars have come up with better ways to measure child poverty, which give us a more accurate picture of progress than what is offered by the Census Bureau. Economists Bruce Meyer and James Sullivan have developed a consumption poverty measure that sets a standard of poverty and then measures a family’s consumption against that standard. Anchoring this standard to 1980, Meyer and Sullivan show that the child poverty rate was cut by about three-quarters between 1980 and 2018 (figure 1).
Others have also created alternatives to the Census Bureau’s flawed measures and those efforts tell the same story. A 2016 report by social scientist Scott Winship, a recent NBER working paper by my former AEI colleagues Richard Burkhauser, Kevin Corinth, and co-authors, and the 2019 Roadmap to Reducing Poverty report all found that child poverty has been cut by at least one-third (and likely more) since the 1960s.
These alternative measures of poverty reveal that millions fewer American children were in poverty in 2018 than in decades past. Using the Meyer-Sullivan consumption poverty measure anchored to 1980 standards, we found that 8 million fewer children were in poverty in 2018 than 1980, even though the population of children in the U.S. increased by 15% during this time.
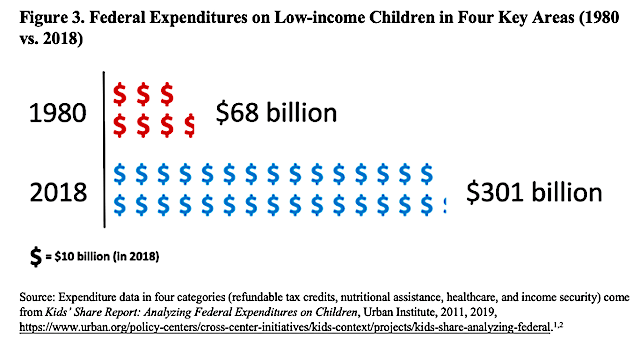
One major factor contributing to improvements in child poverty in the U.S. has been the federal government’s large increase in spending on programs for low-income children. As shown in my report, federal spending on low-income children was very limited in 1960, but by 2018, it increased 17-fold (in constant dollars) in four major categories of programs: refundable tax credits, health, nutrition assistance, and income security. In 2018 alone, the federal government spent $233 billion more on low-income children than it did in 1980 (almost 4.5 times the amount), corresponding with the dramatic declines in child poverty shown above.
None of the data presented here suggests that more progress on child poverty in America is not needed. But incorrect assessments of where we stand on this important issue could prompt leaders to pursue radical policies that do more harm than good. This is especially true when the perceived solution expands the role of the federal government while failing to address the potential negative behavioral effects of such interventions, such as decreased work effort or reduced marriage. When put into the proper context, policies that support work, such as the earned income tax credit, become much better suited to further reducing child poverty than expensive new programs that provide unrestricted cash payments, like a universal child allowance, for example.
A comprehensive and honest look at child poverty in the U.S. shows that American children are doing better than ever, and that this progress was at least partly due to safety net program expansions for low-income children. Better policies are still needed to counteract the unintended consequences of the federal government’s reach, but starting with an accurate assessment of where we are in terms of child poverty and how we got here is crucial.
Angela Rachidi is a resident scholar in poverty studies at the American Enterprise Institute.