Highlights
- American young adults have begun to take an extraordinarily dim view of the world and their own lives. Post This
- Unhappiness rose just 8 percentage points for married young adults, versus 18 percentage points for the unmarried in 2021. Post This
- The only factors that appear meaningfully protective against the post-COVID unhappiness spike are marriage and religious attendance. Post This
The last two years have been hard on everyone, with numerous disruptions to life of many kinds leading many of us to feel, as the General Social Survey (GSS) might put it, “not too happy.” Pandemic disease, lockdowns, protests, riots, crime, divisive politics, shootings, deaths of despair, an epidemic of loneliness—the list of reasons for being “not-too-happy” seem to be legion. Since 1972, the GSS has been asking Americans how happy they are, with three options: very happy, somewhat happy, and not too happy. That lowest option captures all those Americans who just don’t feel good about the world and their own place in it. Perhaps it is no surprise that the 2021 GSS round found the highest share of Americans who are “not too happy” ever measured.
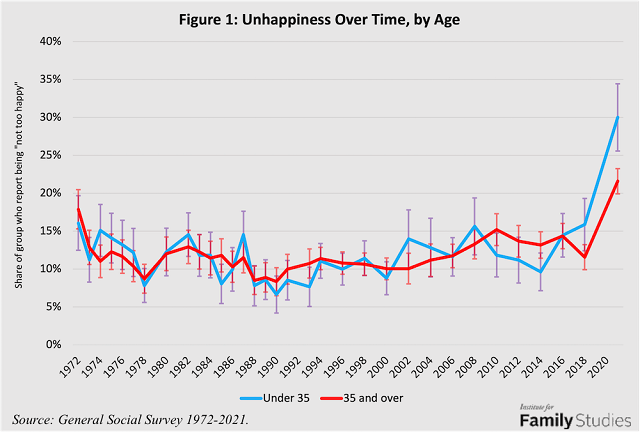
From 1972 to 2018, no more than 18% of Americans ages 35 and over had ever claimed to be “not too happy,” and no more than 16% of Americans under 35 had done so. In every year ever measured, people over and under age 35 had similar levels of unhappiness. But in 2021, unhappiness rocketed upwards for both groups, to 22% for those 35 and over, and a whopping 30% for those under age 35. These are both historic highs for each age demographic, but the unusually sharp increase for those under 35 points to a unique burden of unhappiness among young adults over the last few years. American young adults have begun to take an extraordinarily dim view of the world and their own lives. The path to understanding why unhappiness has risen so much more among young Americans begins by understanding the groups among whom it has risen the most.
Unhappiness by Groups
Among young adults, different groups had different levels of unhappiness even before COVID. Thus, for example, only about 6% of married people said they were “not too happy,” versus 16% of unmarried young adults. However, the better question is how has happiness changed within various groups: did married people and unmarried people see the same spike in unhappiness in 2021? What about men and women, or liberals and conservatives? The GSS contains a wide variety of control variables, making it possible to compare the typical prevalence of unhappiness for a given group of young adults before COVID (in this case, 2012-2018) and after it (2021). Figure 2 below shows the share of each group who were “not too happy” before and after COVID, after controlling for each of the other variables listed.
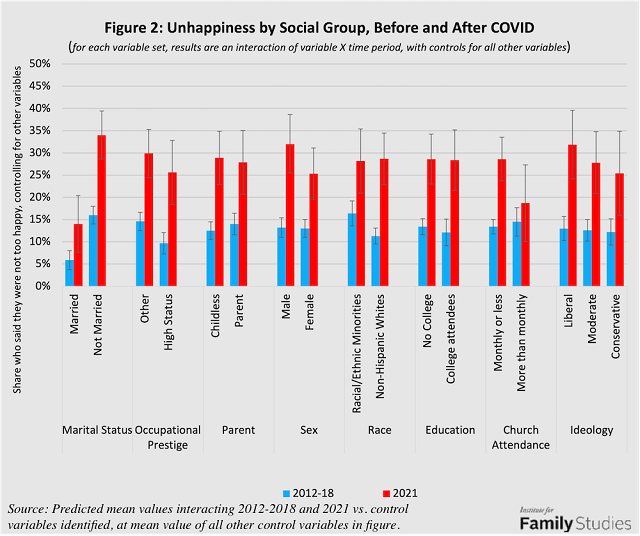
Several things immediately stand out. First, unhappiness rose for almost every group: the red bars are higher than the light blue bars in almost every case. Thus, group-level traits mostly did not shield individuals from the unhappiness spike around COVID. Having kids or a college degree didn’t spare people from the difficulties of the last few years.
Secondly, the exact amount that unhappiness increased in 2021 varied. Social class didn’t protect people very much: unhappiness rose about 16% for people with highly prestigious jobs, and 15% for other people. People who attended college saw their unhappiness prevalence rise by about 16 percentage points, versus about 15 points for those who did not attend college. Being educated and having a prestigious career simply didn’t provide any buffer to peoples’ sense of well-being in the face of a huge social disruption.
Some demographic traits did matter more: men saw their unhappiness rise 18%, versus just 12% for women. Unhappiness rose about 17% for non-Hispanic whites, versus about 12% for racial and ethnic minorities. But these differences are not statistically significant; they could have arisen just from random noise.
For most people, family forms the core of their social support system. And this leads to one of the most important findings of this analysis: unhappiness rose just 8 percentage points for married young adults, versus 18 percentage points for the unmarried. In fact, given the sample sizes involved, the confidence intervals for married people before and after the pandemic actually overlap: it’s not certain that unhappiness actually rose for married people at all, after controlling for their other traits. Marriage, then, served as a valuable buffer against unhappiness. Children, on the other hand, did not: childless young adults and parents saw similar increases in unhappiness (16 and 14 percentage points, respectively).
Finally, happiness changes varied in important ways across religiosity and politics. Among people who attended religious services at least two times per month, unhappiness rose only 4 percentage points, the smallest increase of any group. Among those who attended less often, unhappiness rose 15 percentage points. This difference was highly statistically significant, suggesting that participation in religious community may serve as a useful buffer against adverse events in life.
Relatedly, liberal Americans saw the largest increase in unhappiness of any group, at 19 percentage points. For moderates, it was just 15 percentage points, and for conservatives, 13 points. However, given the sample sizes involved, these differences are not statistically significant.
Conclusion
The COVID pandemic has made virtually everyone less happy. This effect is especially pronounced among younger Americans under 35. For young adults, the rise in unhappiness has been sharply felt, with pronounced rises across all socioeconomic and demographic groups, and throughout the ideological spectrum. The only factors that appear meaningfully protective against the post-COVID unhappiness spike are marriage and religious attendance. Married church-attenders are markedly happier than other young adults. Some of this may be selection bias, but some of it may also be causal effects of deeper social ties providing material and psychological resources for dealing with life’s challenges. Unfortunately for the happiness of young Americans, whereas in 1972 about 24% of people under 35 were married churchgoers, in 2021 just 7% were, leaving more and more young adults exposed to life’s troubles with little help, as shown in Figure 3.
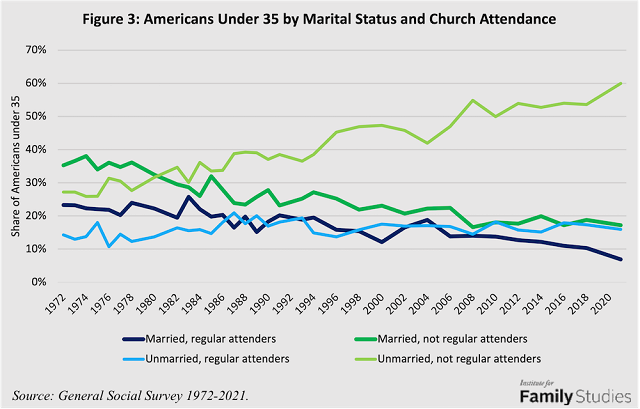
Meanwhile, more and more young Americans inhabit the unhappiest subgroup for their age: unmarried and not religious. Today, 60% of people under 35 fit this category. One possible result of this change, as we have seen these last few years, is that more young people lack the vital support of a spouse and a religious community, and thus new forms of adversity can rapidly lead to astonishingly severe levels of unhappiness.
Lyman Stone is a Research Fellow at the Institute for Family Studies, Chief Information Officer of the population research firm Demographic Intelligence, and an Adjunct Fellow at the American Enterprise Institute.