Highlights
- The 2020 Current Population Survey is yet another bellwether pointing to lower birth rates in the future. Post This
- About 20% of the decline in cohort fertility since the 1977-86 birth cohort can be directly explained by delayed and foregone marriage, and the rest by changing fertility patterns conditional upon marriage. Post This
You’ve probably seen the headlines: U.S. fertility rates in 2020 reached their lowest levels in history. But what does this really mean? Births in a single year are an obviously incomplete indicator for questions like, “How many children will the average woman have?” Annual birth rates are one tool for describing fertility, but not the only one. The Census Bureau recently released another crucial indicator: survey data on fertility history. The Current Population Survey periodically asks women how many children they’ve ever had, making it possible to take a retrospective look at fertility and directly answer questions about typical childbearing and family size. The results are concerning: across many age groups, childbearing as of 2020 was way down.
The figure below shows the average number of children women had ever had at selected ages across all the years the CPS has been operating. In general, women tend to have had more children as age increases, until age 35 or so. Beyond age 35, gains are much smaller.
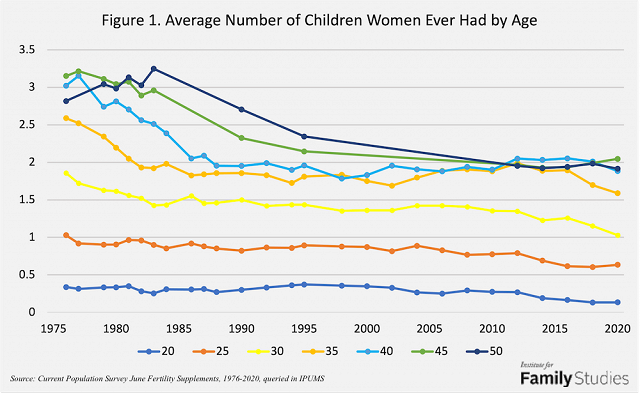
Strikingly, the average number of children ever born to women by age 20 has fallen from around 0.4 to 0.1 between the mid-1990s and 2020. Likewise for 25-year-olds, the decline has been from 0.9 in 2004 to 0.6 in 2020. For 30-year-olds, average births have fallen from 1.4 in 2008 to 1 in 2020. The decline for 35-year-olds has just recently begun, but since 2016, average births to 35-year-old women have fallen from 1.9 to 1.6. This decline hasn’t hit women in their 40s yet, but it likely will soon.
Looking at fertility completion in this way is a bit odd, however. The same women who were 20 in 1995 were 25 in 2000, and 30 in 2005, and 35 in 2010, etc. Looking at birth histories at specific ages over time is straightforward, but it’s not the best way to see how fertility is really changing. For that, we should look at cohorts: looking at the number of children ever born to women of a certain birth year, over their lifespan. To do this, I combine 10-year birth groups of women with 10-year groups including the youngest women in the 2020 sample in the most recent 10-year cohort.
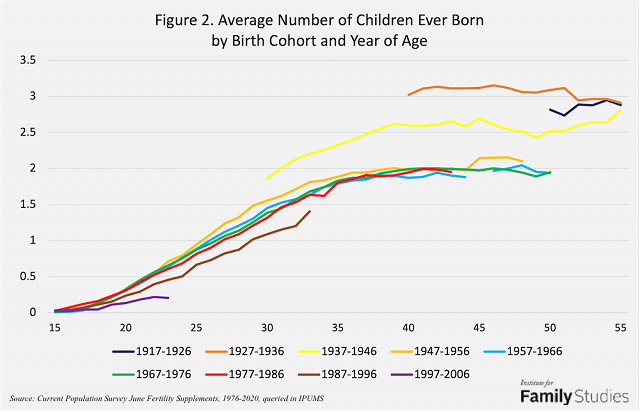
As can be seen, women born in the 1917-26, 1927-36, and 1937-46 cohorts all had relatively large families, ending up with around 2.5 or 3 children. Because the CPS fertility questions were not asked before 1976, trends for these women at younger ages aren’t available. But for women born 1947-56, average family size was much lower by the time those women were in their 40s, at around two children born per woman. Women born from 1957-66 and 1967-76 had about the same trends, ending up with around two children per woman. Women born in 1977-86 are still having children in some cases, but it looks like they will end up having around two children each as well.
Where big changes show up is for the 1987-96 cohort, and then the still-very-young 1997-06 cohort. For these two cohorts, births ever had at each age have fallen sharply—indeed by nearly as much as occurred between the 1937-46 cohort and the 1947-56 cohort. Obviously, women born in 1987 and later are still having children; many have hardly even begun to have children, so we can’t predict exactly what their childbearing will look like. But to a first approximation, it appears these women will end up having fewer children. If women born in 1987-96 have the same birth rates for ages 34 and beyond as women born in 1977-86, and women born in 1996-06 have the same birth rates for ages 24 and beyond as women born in 1987-96, the figure below shows how childbearing would develop.
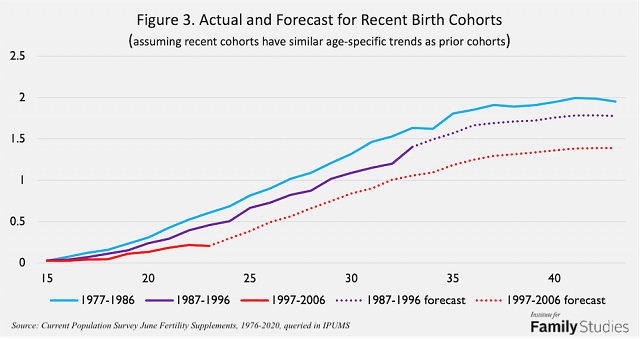
In this scenario, which is not fundamentally unreasonable on its face, women born in 1986-96 would end up having about 1.8 children each, and women born in 1997-06 would have about 1.4. ‘
Obviously, these are crude forecasts. Younger women having fewer children early in life are likely to try to “make up for lost time” later on, so their later-in-life birth rates may be higher. But will they be high enough for women in their 20s and early 30s today to reach 1.9 or 2 children each? That’s less clear, and the forces driving this change seem to imply that no major recovery in birth rates is around the corner.
These declining births are driven by multiple factors. To begin with, it’s helpful to compare the birth histories of women who had ever been married at a given age, to women who had never been married at a given age. Even though births out of wedlock are increasingly common, marriage remains a major predictor of fertility. The charts below show childbearing in those two groups, for each decadal birth-year group from above.
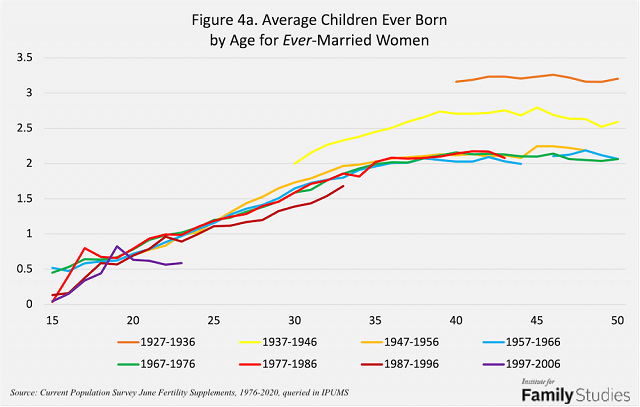
Among women who have ever been married, there has been a modest decline in births between the 1977-86 cohort and the 1987-96 cohort, and possibly a larger one among women born in the 1997-06 birth cohort. But these declines are, for the 1987-96 group, not all that large, and for the 1997-06 cohort, still very early in life and subject to change. So, while there has been some decline in births among women who have ever been married, this decline isn’t extremely large.
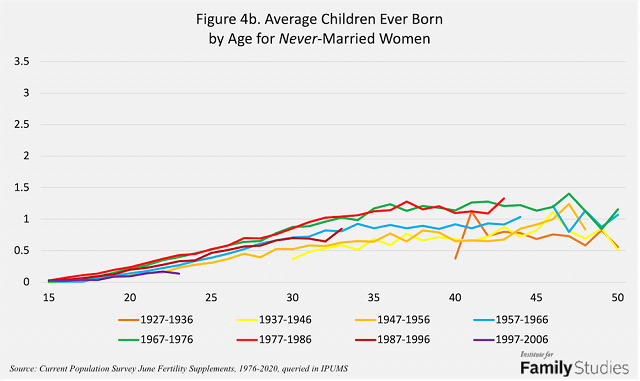
Among women who have never been married, the story is different. Women born 1987-96 who have never been married have about the same number of kids as women born 1957-66; never-married women born since 1997 are as unlikely to have children as women born in the 1940s. Birth trends among never-married women are returning to their pre-sexual-revolution levels. The absolute scale of this decline is not extremely large in the grand scheme of things, but the point is that there has not been an increase in childbearing totally-separated-from-marriage. There may have been some changes in who has nonmarital births, with college-educated women having more and less-educated women having fewer, but the overall connection between marriage and fertility persists. By and large, women who have never been married are not getting more likely to have kids over time, and indeed in recent cohorts, the link between marriage and fertility has actually become stronger.
Thus, among both ever-married and never-married women, births have generally declined. The absolute decline has been somewhat similar for the two groups, but this means that in historic comparison, the decline among never-married women is relatively larger.
And there’s also a crucial third factor in this equation: marital status itself. Figure 5 below shows the share of women who were married at each year of age for each cohort group.
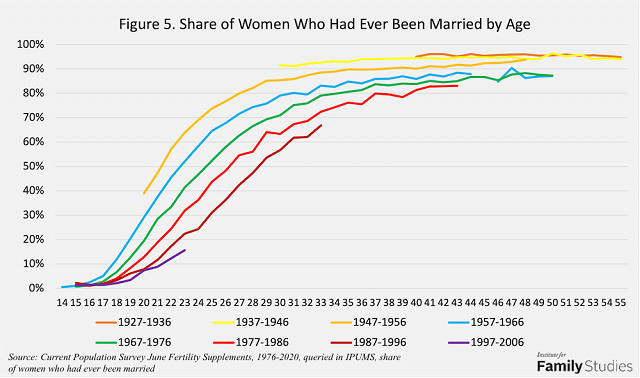
With every passing generation, the odds of being married at any specific year of age have fallen. Marriage is not only being delayed, it is being foregone altogether by a growing share of women. To the extent marriage rates do converge across generations, that convergence occurs by the time women are in their 40s and 50s, and these marriages have less influence on childbearing trends. In all the crucial years of childbearing, fewer women happen to have ever been in the married unions that tend to produce more children. This trend has continued at a similar pace across each generation with no sign of abating. It’s likely this trend will continue into the future, as many others have argued elsewhere, with women at any given year of age having spent less of their prior life married, and thus less of their life exposed to the social and relational conditions that tend to give rise to higher rates of childbearing.
The direct effect of changing marital behaviors can be easily quantified. If fertility conditional on marriage for women born after 1987 had followed the same trends it did in reality, but marriage rates are held constant equal to the marriage rates of the 1977-86 birth cohort of women, here’s what fertility would look like for the 1987-96 and 1997-06 cohorts:
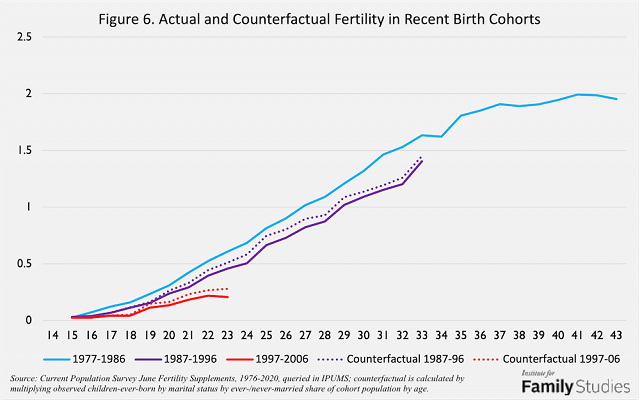
As can be seen, if marriage rates had been stable across these cohorts but fertility rates conditional upon marriage had still changed as observed, overall fertility would still have declined, though not by as much. Looking at the latest year of age of data for each cohort compared to the 1977-86 cohort, holding marriage trends constant changes the decline from the 1977-86 cohort to the 1987-96 cohort from -0.23 children born per woman to -0.18; it changes the decline from the 1977-86 cohort to the 1997-06 cohort from -0.4 children per woman to -0.32 children per woman. In other words, about 20% of the decline in cohort fertility since the 1977-86 birth cohort can be directly explained by delayed and foregone marriage, and the rest by changing fertility patterns conditional upon marriage.
Thinking about the future, then, the conclusion is clear: marriage will continue to be postponed or not entered into at all, resulting in women spending fewer fertile years in stable partnered unions that can provide better guarantees of help and support in childrearing, and as a result fertility will fall. This will continue to nudge fertility rates downwards. On top of this, declines in fertility conditional on marital status point to ongoing deeper changes in behavior that may have other causes. For all these reasons, the 2020 Current Population Survey is yet another bellwether pointing to lower birth rates in the future.
Lyman Stone is a Research Fellow at the Institute for Family Studies, Chief Information Officer of the population research firm Demographic Intelligence, and an Adjunct Fellow at the American Enterprise Institute.