Highlights
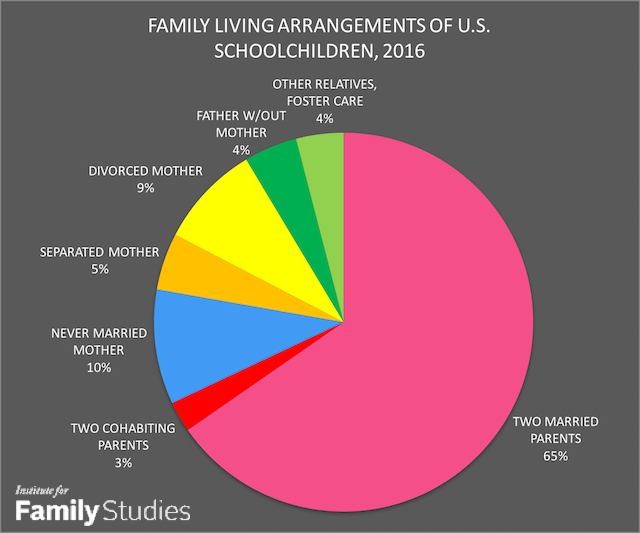
As of 2016, less than 65% of the 50 million school-aged children in the United States were living in households with two married parents.1 As shown in Figure 1, more than 12 million—24%—were living with their mothers only as a result of birth outside of marriage (10%), parental divorce (9%), or separation (5%). Moreover, 2.2 million (4.5%) were living with their fathers only for similar reasons. Another 2 million (4%) were living with neither birth parent, but with other relatives or in a foster family. And 1.3 million (2.6%) were living with two parents who had not (yet) married. How does the fact that so many students today come from non-intact or unmarried families affect their progression through school?
Students from unconventional family forms pose a challenge to teachers and school administrators who are striving to give all students the same opportunities to succeed. Single parents are often less able to devote as much time, attention, financial support, and consistent discipline to their children as married couples.2 Marital disruption is often accompanied by conflict, turmoil, and parental anger or depression. Parent education and family income levels are typically lower in single-parent and step-families than in married two-parent families, and poverty rates are higher.3 Furthermore, the racial and ethnic identities of students from non-traditional families are more likely to be African-American or Hispanic-American, whereas those of students from married two-parent families are more likely to be European-American or Asian-American.4 So, long-standing ethnic gaps in achievement, concerns about unequal opportunity, and racial sensitivities come into play as well.
Children’s conduct and performance in school are profoundly affected by the emotional support, intellectual stimulation, guidance, and discipline they receive at home. And they are more likely to get the attention, affection, and direction they need to thrive in school when they come from an intact, married family. A long line of studies, beginning with the 1966 Coleman Report, have shown this to be the case.5 More recently, our own analysis of trends in Arizona and Florida indicates that school districts tend to be more successful and safer when more of their families are headed by married parents.6 In this research brief, we examine data from a recent federal survey to explore the influence of family structure and family functioning on student achievement.
Data and Methods
The survey in question was the 2011-2012 National Survey of Children’s Health, a nationwide telephone survey of parents of some 96,000 children—61,000 of whom were of elementary and secondary school ages (6-17 years old).7 Three indicators of academic progress and classroom conduct were measured in the study:
- whether the parent had been contacted by the child’s school due to learning or behavior problems the child was experiencing at school;
- whether the child had repeated one or more grades; and,
- whether the child seemed positively engaged in his or her schoolwork by “caring about doing well in school” and “doing all required homework” “always” (as opposed to “usually,” “sometimes,” “rarely,” or “never”).8
We analyzed the extent to which each of these school performance indicators was associated with the type of family in which the child lived, dividing families into six types depending on whether the child lived with:
- two married parents;
- two parents who were cohabiting;
- a biological parent and a stepparent;
- single mothers who were separated or divorced;
- single mothers who had never married; or,
- single biological fathers, other relatives, or foster families.9
We also examined how the school performance indicators were associated with the:
- education level of the child’s parents;
- family income and poverty status;
- child’s race and ethnicity;
- child’s age in years; and,
- child’s sex.
We carried out multiple logistic regression analyses to adjust the relationship between each of the independent variables and the dependent variable for its association with the other predictors. We repeated these analyses with the national sample for each of the school performance indicators.10
Children Who Live with Married Parents Do Better in School
Our analyses showed that schoolchildren who live with both married parents do better on each of the three educational progress indicators. Family income and parent education were significantly associated with student performance as well, but children from married-couple families do better even after controlling for socioeconomic and demographic correlates of family structure. Here are our findings for each of the indicators in turn:
Parents contacted by school
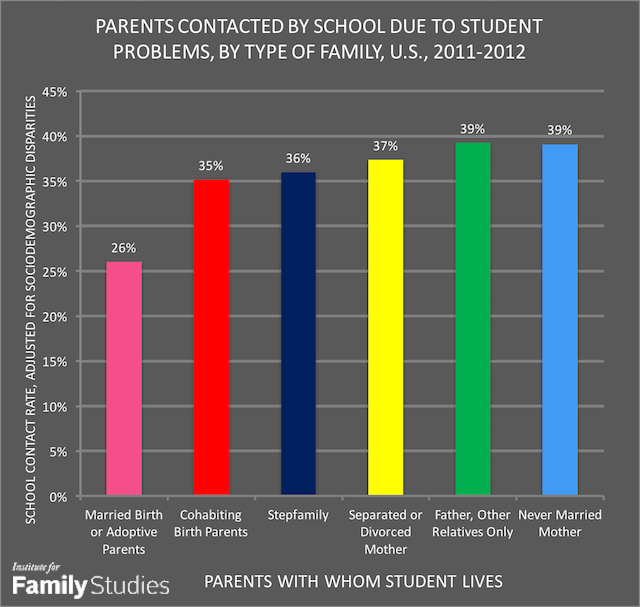
Nearly a third of U.S. parents of students ages 6-17 reported that they had been contacted by the child’s school at least once due to conduct or learning problems that their child was exhibiting in class. School contact is an indicator of student maladjustment and often foreshadows more serious disciplinary issues or learning failures to come. It may also be an indication that the student’s behavior is interfering with an orderly classroom environment, thus reducing other students’ opportunities to learn.
Forty-five percent of students living with never-married mothers had their parents contacted by their schools, compared with one-quarter of children living in married, two-parent families.11 Rates of school contact were also significantly higher among students living with separated or divorced mothers (40%), among those living in stepfamilies (37%), and among those living with unmarried fathers or other relatives or in foster families (42%). Even students living with cohabiting parents (i.e., unmarried biological parents) had higher rates of school contact (38%). The differences among single-parent and stepparent family types were not statistically significant, except that students in stepfamilies had significantly lower rates of school contact than did students living with never-married mothers.
After taking demographic and socioeconomic disparities into account, differences in school contact rates between students in intact families and those in unmarried, disrupted, or reconstituted families were reduced in magnitude but remained substantial (see Figure 2). The odds of school contact were between 1½ and 1¾ times higher in unmarried, disrupted, and reconstituted families than in married birth-parent families. The differences in school contact rates among the various forms of non-traditional families were not statistically significant, after adjusting for child age, sex, and race, and parent education, income, and poverty status.
Grade repetition
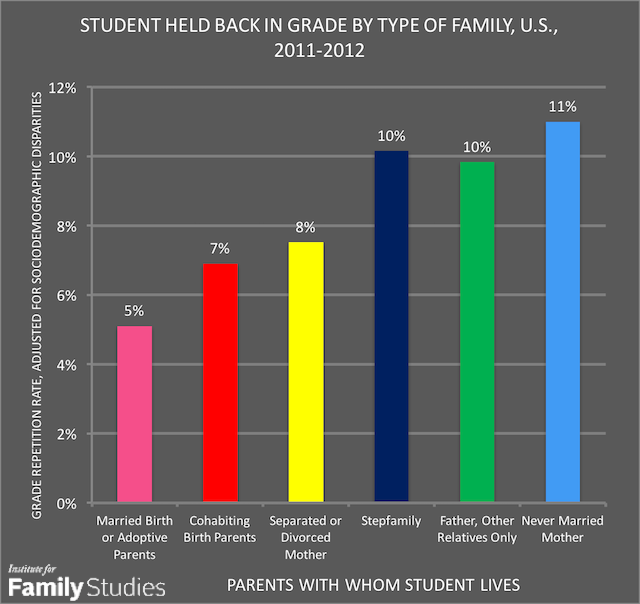
Being held back a grade in school is not only an indicator of current learning difficulties, it is also an early warning sign for later non-achievement and for dropping out of school. Among all U.S. elementary and secondary school pupils, 9% had to repeat one or more grades in school. The proportion of students who had repeated a grade was nearly four times higher among students from never-married families as among those growing up in intact, married two-parent families: 19% versus 5%. It was twice as high among students from formerly-married families, such as those living with separated or divorced mothers (12%), or in stepfamilies (13%). Children living with single fathers, other relatives, or in foster care were three times more likely to have repeated a grade (15%). Even children living with cohabiting biological parents had an elevated rate of grade repetition (10%). All of these differences were statistically significant.
Grade repetition differences were reduced somewhat when the figures were adjusted for demographic and socioeconomic disparities across family types, as shown in Figure 3. However, compared to students in intact married families, the adjusted odds of having to repeat a grade were still more than twice as high among students living with never- married mothers, in stepfamilies, and with fathers or other relatives. The adjusted odds were 1½ times higher among students living with separated or divorced mothers, and nearly as high among those with cohabiting parents. All these elevated odds ratios were statistically significant, except for cohabiting families, where it was only marginally significant.
Consistent engagement in schoolwork
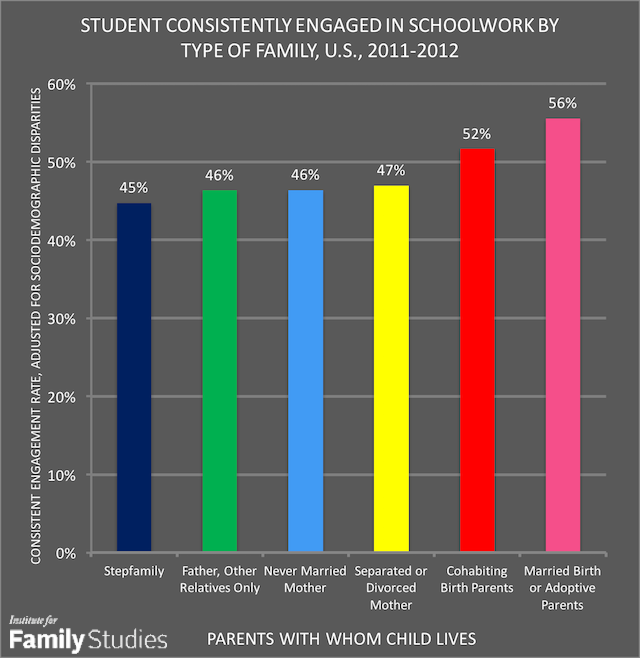
One of the key indications that a student is on a path to success in school is showing interest and engagement in schoolwork. Based on their analysis of several longitudinal studies, economist Greg Duncan and his colleagues found that a positive approach to learning activities in the early grades was one of the best predictors of future academic achievement as well as of later occupational advancement and earnings.12 School engagement was measured in the National Survey of Children’s Health by asking parents how often in the past month the student “cares about doing well in school” and how often he or she “does all required homework.” Only about half of all American schoolchildren (52%) “always” both cared about doing well in school and completed all required homework.
Among students living with both married parents, a 55% majority displayed consistent engagement in schoolwork. A majority of students living with cohabiting parents were also reported to be consistently engaged in schoolwork. Less than half of those living with separated or divorced mothers, in stepfamilies, or with other relatives showed similar engagement with their studies. These differences were statistically significant. Students living with never-married mothers were not statistically different from students in intact families in this regard.
After adjusting for demographic and socioeconomic differences across family types, students from married two-parent families showed more engagement than students from other family types, as shown in Figure 4. The odds of consistent engagement were from 65% to 71% lower among students living with never-married or formerly married mothers, in stepfamilies, or with other relatives. Students with cohabiting parents were not significantly different from those with married biological parents. Differences in schoolwork engagement among the various forms of non-traditional families were not statistically significant.
Student performance cannot be understood apart from the family.
Student success is predicated on staying out of trouble in school and on remaining meaningfully engaged in class and with homework. Our analysis of the National Survey of Children’s Health indicates that children from intact married families are more likely to avoid detours that can derail their educational performance and to be successful students, compared to children from unmarried or non-intact families. Specifically, children from unmarried or disrupted families are more than 1½ times more likely to have their parents contacted by their school for problem behavior, about twice as likely to be held back in school, and only two-thirds as likely to be engaged in class and with their homework, compared to children from intact married families—even after controlling for a range of sociodemographic factors. We also find that poverty and low parent educational attainment are associated with higher rates of schools contacting families and with a student being held back in school. Taken together, our results indicate that student outcomes across the U.S. are strongly associated with three important family factors: family poverty, parent educational attainment, and family structure.
In general, then, our results suggest that student performance cannot be understood apart from what’s happening in American families. Families struggling with material want, conflict, or instability appear to be less able to give children the resources, consistent attention and affection, and stability they need to avoid trouble and to thrive in school. Thus, policymakers, educators, business executives, and philanthropic leaders seeking to improve the educational fortunes of children must not lose sight of the ways in which strong families are seedbeds of educational success. To improve education, we also need to enhance the material and marital fortunes of American families. Policymakers, educators, and civic leaders should consider measures—such as a refundable child tax credit, a social marketing campaign on behalf of marriage, and a family life curriculum that explains the importance of marriage to schoolchildren—to strengthen and stabilize American families.
Nicholas Zill is a research psychologist and a senior fellow of the Institute for Family Studies. He directed the National Survey of Children, a longitudinal study that produced widely cited findings on children’s life experiences and adjustment following parental divorce. W. Bradford Wilcox is a senior fellow of The Institute for Family Studies and the Director of the National Marriage Project at the University of Virginia.
1. U.S. Bureau of the Census, Current Population Survey. (2016). Table C3: Living arrangements of children under 18 years. (Authors’ analysis of data in table.) Figure cited includes children living with married adoptive and stepparents.
2. Paul Amato, “The Impact of Family Formation Change on the Cognitive, Social, and Emotional Well-Being of the Next Generation,” Future of Children 15, no. 2 (2005): 75-96; Sara McLanahan and Gary Sandefur, Growing Up With a Single Parent: What Hurts, What Helps (Cambridge, MA: Harvard, 1994); Nicholas Zill, “Family Change and Student Achievement: What We Have Learned, What It Means for Schools,” in Family-School Links: How Do They Affect Educational Outcomes?, ed. Alan Booth and Judith F. Dunn (Mahwah, NJ: Erlbaum, 1996).
3. For example, in 2016, the proportions of U.S. children with college-graduate parents were 53% in married-couple families, 31% in divorced-mother families, 17% in separated-mother families, and 10% in never-married mother families. The proportions of children living below the poverty line were 10% in married-couple families, 28% in divorced-mother families, 46% in separated-mother families, and 47% in never-married mother families. These figures are from the Current Population Survey Annual Supplement, Table C3, cited in Note 1, and are based on all children under 18 years of age.
4. For example, in 2016, children in married-couple families were 59% non-Hispanic white, 23% Hispanic, 8 percent black, and 7% Asian. By contrast, children living with never-married single mothers were 22% non-Hispanic white, 28% Hispanic, 46% black, and less than one percent Asian. These figures are from the Current Population Survey Annual Supplement, Table C3, cited in Note 1, and are based on all children under 18 years of age.
5. James Coleman, et al., Equality of Educational Opportunity (Washington, DC: U.S. Government Printing Office, 1966); Anna J. Egalite, “How Family Background Influences Student Achievement, EducationNext 16, no. 2 (2016): 71-78; Ariel Kalil, Rebecca Ryan, and Michael Corey, “Diverging Destinies: Maternal Education and the Developmental Gradient in Time With Children,”Demography 49, no. 4 (2012): 1361-1383; Barbara Schneider and James Coleman (eds.), Parents, Their Children, and Schools (Boulder, CO: Westview, 1996).
6. W. Bradford Wilcox and Nicholas Zill, Stronger Families, Better Schools: Families and High School Graduation Across Arizona (Charlottesville, VA: Institute for Family Studies, 2016), and Wilcox and Zill, Strong Families, Successful Schools: High School Graduation and School Discipline in the Sunshine State (Charlottesville, VA: Institute for Family Studies, 2016).
7. 2011/12 National Survey of Children’s Health, Child and Adolescent Health Measurement Initiative (CAHMI), “Child Health Indicator and Subgroups SAS Codebook, Version 1.0,” 2013, Data Resource Center for Child and Adolescent Health, sponsored by the Maternal and Child Health Bureau, www.childhealthdata.org; National Center for Health Statistics, “Design and operation of the National Survey of Children’s Health, 2011-2012.”
8. National Survey of Children’s Health, 2011-2012: Questionnaire (CDC/National Center for Health Statistics, 2014), http://www.cdc.gov/nchs/slaits/nsch.htm.
9. Adopted children who lived with two married adoptive parents were included in the “two married parents” group in this analysis. An earlier study examined the school adjustment of students adopted from foster care and compared it with that of students who remained in foster care, using the same data set. See: Zill, N. & Bramlett, M.D. (2014). Health and well-being of children adopted from foster care. Children and Youth Services Review, 40: 29-40.
10. For more details, see: Nicholas Zill & W. Bradford Wilcox, Strong Families, Successful Students (Charlottesville, VA: Institute for Family Studies, 2016).
11. Percentages cited in the text are observed relative frequencies for students in different types of families. Percentages shown in graphs are adjusted for demographic and socioeconomic disparities among family types
12. Greg Duncan, et al.,“School Readiness and Later Achievement,” Developmental Psychology, 43 (2007): 1428–1446.