Highlights
- 23% of all U.S. students were described by their parents as having one or more disabilities in 2019: more than one in four boys (28%) and nearly one in five girls (18%). Post This
- The odds that a child will be diagnosed with a disability are greater for children from some family backgrounds than others. Post This
- Three times as many students with disabilities have been suspended or expelled from school. Post This
It can be challenging for both families and school systems to address the unique needs of students with disabilities. These challenges stem from a series of federal laws and regulations that mandate free, “appropriate” education for children with disabilities in “minimally restrictive environments.”1 This legislation was passed with the best of intentions for assisting children with disabilities and their families, but without solid evidence as to how or even whether these goals could be accomplished. As is often the case, the laws mandated new rights for individuals and requirements for educational institutions, providing some financial incentives for state governments but not sufficient resources for implementing the far-reaching changes to existing practices the laws required. This puts parents, teachers, individual schools, and entire school systems in a disability dilemma.
A recent article in the New York Times shared how some public-school administrators manage to exclude troublesome children with disabilities from classes without formally suspending them. More than 1,100 readers posted on-line comments or wrote letters in response to the article. Parents described difficulties they encountered getting suitable placements and instruction for their children with disabilities. Teachers detailed disruptions some students with disabilities create to the operation of a class composed mainly of students without disabilities. Special education experts wrote of the need for more training and resources to help teachers cope with the demands of integrating disabled students into general education classrooms.
Here are three quotes from Times’ reader responses to illustrate the different perspectives:
From a parent of a child with disability:
I have an autistic son who is also intellectually disabled. He has frequent loud meltdowns that can last up to an hour. He hits himself and bangs his head on his desk. He needs a quiet environment with few transitions. He needs the same teacher all day. His academics are at primary level. Our school district insisted that his high school LRE [least restrictive environment] was gen-ed [general education], without an aide. It took a whole year and thousands of dollars in legal fees to get him assigned to a special public school for children with disabilities… During the time he was in forced inclusion, the poor teachers were beside themselves, calling us to try and figure out how to handle him. It was horrible. He lost a whole year of learning and cried all day every day…
From a public high school science teacher in Houston, TX:
Students with disabilities absolutely deserve a free and public education, like everyone else. But when the needs of these students aren’t met in a regular classroom, some can be disruptive or violent, and teaching them alongside regular education students becomes impossible. Why should the educational experience be ruined for 25 kids because one student became disruptive? Why should I be forced to educate all of these kids together when they clearly have different needs, and therefore I can meet none of them? These issues are so severe that teachers are quitting in droves and public schools are failing...
From two special education professors in New York City:
The informal removal of students points to insufficient teacher training and cracks in the overburdened school system. Educators are teaching an increasingly neurodiverse student population...Students with disabilities often learn alongside their general education peers. While this is a win for special educators, who have long championed the academic and social benefits of inclusion for both general and special education students, teacher training has not kept up with these increases...
What do federal surveys and testing programs tell us about how the special education of disabled students is working? The U.S. Department of Education has data on college programs that could provide statistical evidence on how many students are identified as having disabilities; the conditions they have; their demographic characteristics; and how they are doing in elementary and secondary schools around the country. But these data sources have not been mined adequately to examine the academic performance and school adjustment of these students, nor to depict their individual and family characteristics. What follows is such a depiction.
Students With Disabilities
A remarkable 23% of all U.S. students were described by their parents as having one or more disabilities in 2019: more than one in four boys (28%) and nearly one in five girls (18%). Fewer students were said to be receiving services under an Individualized Education Plan or IEP (11%), while 8% were attending special education classes.2 The number of children with disabilities served by special education programs in public schools nearly doubled between the 1976-77 and 2020-21 school years, according to reports from state and local education agencies.3 It went from 8.3% to 14.5% as a proportion of total enrollment. The increase was due largely to growth in the proportions of students classified as receiving services for specific learning disabilities, developmental delay, autism, and “other health impairments.”4
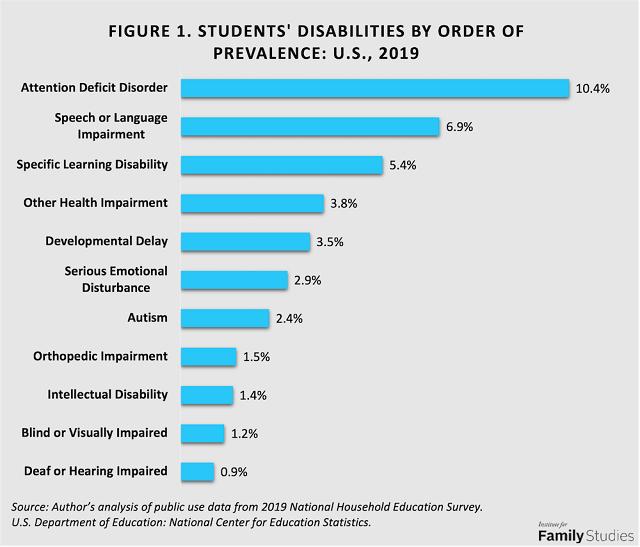
As the chart below shows, most of the conditions do not involve sensory or physical impairment, such as being blind or deaf. Most are neurological or psychological conditions, such as those just listed and Attention Deficit Disorder (ADD or ADHD). Figure 1 shows the prevalence of each of these and other leading conditions among U.S. elementary and secondary school students in 2019, as reported in a national survey of parents.5
Demographics of Disability
Are students with disabilities predominantly from single-parent families, poor families, families with less educated parents, or minority families? Some are, to be sure. But most are not:
- 60% of students with disabilities live with two parents, at least one of whom is the child’s biological parent.
- 56% are white.
- 49% are from families with incomes of $60,000 or more.
- 38% are from families where at least one parent has a college education.6
That being said, the odds that a child will be diagnosed as having a disability are greater for children from some family backgrounds than others.7
- Children who have been separated from both birth parents early in life have substantially higher odds of receiving a disability diagnosis. Adopted students have five times the odds of being identified as disabled as students living with both married birth parents. Those living with grandparents, other relatives, or unrelated foster parents have two-and-a half times the odds. Overall, 13% of students with disabilities live with neither biological parent.
- Children living with never-married or divorced single mothers have one-and-a-half times the odds of having a disability as those living with both married birth parents. The same is true for those living with a birth parent and step parent. Overall, 27% of students with disabilities live with a single parent.
- Children living in households with incomes of $20,000 or less have double the odds of having a disability as those in households earning $100,000 or more. Overall, 30% of children with disabilities are from low-income families compared with 18% from high-income families.
- Asian students have only one-third the odds of being diagnosed with a disability as white students. Black students and Hispanic students have only 60% the odds.8
- 62% of all students with disabilities are male.
The higher prevalence of disability among students from low-income households applies to learning and emotional conditions rather than sensory or physical impairments. Twice the proportion of students from low-income families as non-poor families have ADD (19% to 9%), speech or language impairments (12% to 6%), specific learning disabilities (10% to 5%), serious emotional disturbances (6% to 3%), and autism (4% to 2%). Income-related differences are not statistically significant for hearing, visual, or orthopedic impairments.
The higher prevalence of disability among boys as girls also applies to learning and language rather than sensory or physical disabilities. Four times the proportion of males as females have autism (4% versus 1%). Twice the proportion have ADD (14% to 7%) and speech or language impairments (9% versus 5%). One-and-a-half times the proportion have specific learning disabilities (6% versus 4%). On the other hand, sex differences are minimal for serious emotional disturbances, visual, hearing, or orthopedic impairments, and other health conditions.9 Finally, 41% of males from low-income families have a current disability and 23% have ADD.10
Why the Association Between Family Type and Disability?
What accounts for the association between family structure and student disability? One explanation is that the child’s disability is genetic11 or prenatal in origin and precipitates a family breakup, perhaps due to the financial and emotional stresses of dealing with the child’s disability.12 An alternative hypothesis is that one or both birth parents have a health or substance abuse condition that increases the likelihood of family disruption and chaos, which may influence the child’s disability through a combination of heredity, prenatal exposure, and early childhood deprivation or trauma.13 For young people who wind up cared for by grandparents, other relatives, or foster parents, there have been multiple changes in attachments and care arrangements, which magnify the risk to the child.14 In the case of adoption, there may also be a mismatch between the child’s capabilities and interests and the expectations of affluent, well-educated adoptive parents. This may lead to the parents seeking a disability diagnosis for the child so that he or she receives extra help in meeting the challenging demands of the good schools in which they place the child.15
School Performance
Many students with disabilities are placed in regular education classrooms: 90% of public-school teachers have at least one student with a disability in their class, as signified by the student(s) having an Individualized Education Plan or IEP. Only 14% of public-school teachers have special education as their main teaching assignment.16
More students with disabilities are spending time in regular schools inside general education classes. The proportion who spend 80% or more of their school time in such classes has doubled, from 32% in 1989 to 66% in 2020. Meanwhile, the proportion who spend 40% or less of their time in such classes has nearly been cut in half, falling from 25% to 13 percent. Fewer students are attending separate schools for students with disabilities or living in separate residential facilities. The proportion who do so has also been cut in half.17
Reading and Math
Students with disabilities have reading and math skills well below those of their peers not identified as disabled. That is the story told by data from the National Assessment of Educational Progress (NAEP), a federal testing program that periodically assesses representative samples of 4th, 8th, and 12th graders in reading, math, and other subjects.18
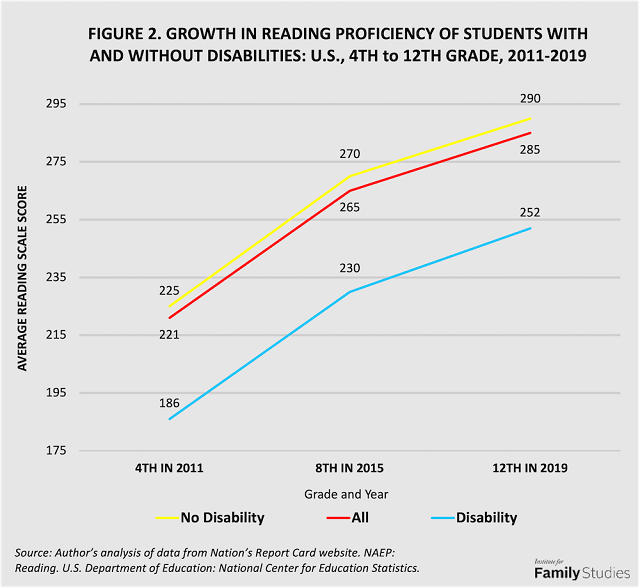
Do students with disabilities become better readers as they advance through the grades? They do, as may be seen in Figure Two. It shows the average Reading Assessment scale scores of the cohort of non-disabled and disabled students who were in the 4th grade in 2011, 8th grade in 2015, and 12th grade in 2019.19 Do their advances enable them to become as proficient readers as non-disabled students? They do not, as may also be seen in the figure. Disabled students score 39 points below non-disabled students in 4th grade, 40 points below them in 8th grade, and 38 points below them in 12th grade.20 Both groups progress, but the gap between them does not narrow.21 Indeed, the average reading achievement level attained by disabled students in 12th grade was 18 points below that attained by non-disabled students in 8th grade. In other words, disabled students were four grades behind in reading skills, on average. As high school seniors, their reading skills were comparable to those of middle schoolers.
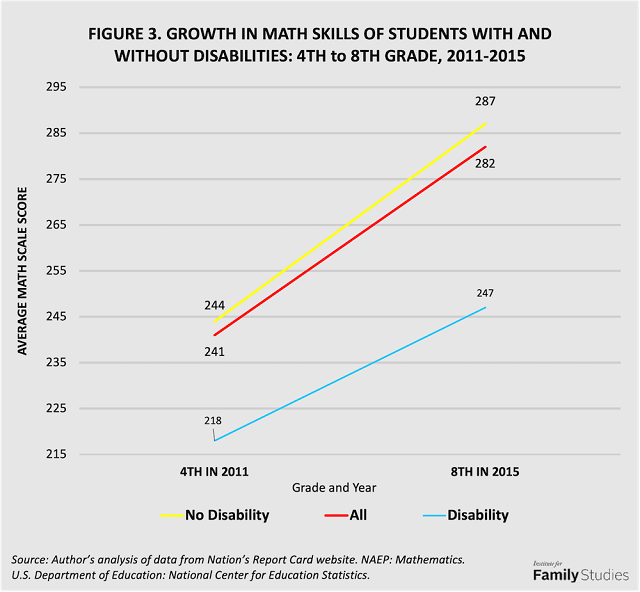
What about math skills? Figure 3 shows the NAEP Mathematics Assessment scores of the same cohort in 2011 and 2015.22 Again, both disabled and non-disabled students developed better math skills as they progressed from 4th to 8th grade. But in 4th grade, average math scale scores of disabled students were 26 points below those of non-disabled students in the same grade. Average assessment scores of disabled students increased by 29 points between 4th and 8th grades, whereas those of non-disabled students increased by 43 points. Thus, by 8th grade, the achievement gap had widened to 40 points.23 Further, the average Math score of disabled 8th graders was scarcely different from the average score of non-disabled 4th graders. Disabled students were four grades behind in this subject area as well.24
These results raise the question of why disabled students are being promoted from grade to grade at the same rate as other students, when their academic skills lag so far behind those of others.
Over the time period 2009 to 2022, NAEP Reading Assessments in grades 4th, 8th, and 12th have not shown improvement in the reading proficiency scores of successive cohorts of special education students. Nor have NAEP Math Assessments shown gains in their math skills at each of the three grade levels over the same time period. If anything, there have been gradual declines in the math scores of successive cohorts of 4th and 8th graders with disabilities between 2009 and 2022, and a more abrupt decline in the math scores of non-disabled students in those grades from 2019 to 2022, the period of the Covid pandemic.25
Indicators of Academic and Behavioral Difficulties
Indicators of difficulties students with disabilities experience or create in school are available from the National Household Education Survey (NHES), a recurring federal survey of parents. As shown in Figure 4, an analysis of the 2016 NHES data reveals that teacher struggles and classroom disruptions are not rare occurrences.26
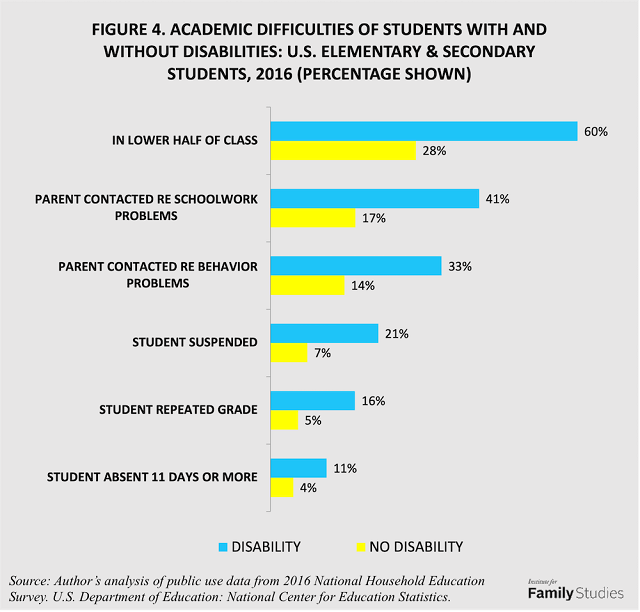
Compared to students without disabilities:
- Three times as many students with disabilities have been suspended or expelled from school.
- Three times as many have repeated a grade.
- Two-and-a-half times as many had their parent contacted by teachers because of schoolwork problems.
- Two-and-a-half times as many have been absent from school for two weeks or more during the current school year.
- Twice as many had their parents contacted by teachers because of the student’s problem behavior.
- Twice as many received report cards that put them in the bottom half of the class.
High School Diplomas
How many 12th grade students with disabilities graduate from public high schools in the U.S. with a regular diploma within four years of starting 9th grade? In the 2019-20 academic year, the national rate was 71 percent.27 This was 16 percentage points below the on-time graduation rate for all students, which was 87% in that year. There was also a good deal of state-to-state variation in the disability graduation rate, ranging from lows of 56% in South Carolina and the District of Columbia and 59% in Alaska and Idaho to a high of 88% in Oklahoma. Given the evidence just presented, however, it is likely that most of these diplomas were certificates of effort or attendance rather than academic achievement.
Resolving the Disability Dilemma
I began this research brief by asking what federal testing and survey data tell us about the school performance and adjustment of students with disabilities. Based on these findings, the answer to “How are they doing?” is “Not very well.” The good news is that assessment data show substantial growth in their average reading and math skills as these students move from elementary to middle to high school. The bad news is that their academic skills remain substantially below those of non-disabled students at each grade level. Their parents report being contacted by teachers or guidance counselors due to the child’s schoolwork or behavioral problems twice as often as parents of other students. They are also twice as likely to have extended absences from school. They repeat grades or are suspended or expelled from school three times as often. Despite these lagging test scores and more frequent adjustment problems, more than two-thirds manage to graduate high school “on time” and with regular diplomas. How is this possible? The answer appears to be that they are receiving diplomas that testify to persistence rather than accomplishment.
The lagging achievement and frequent adjustment difficulties of students with disabilities likely also have an impact on the learning of the majority of students without disabilities and on the morale of teachers and school administrators who try to educate both groups. There are no good statistics to quantify these impacts. But the outpouring of comments by parents and professionals, such as those in response to the New York Times article, certainly provide anecdotal evidence as to their reality.
What changes are needed in public and private schools to help resolve the disability dilemma? The call of many special education professionals is for “more money” for school systems and “more training and support” for regular teachers as they try to accommodate students with disabilities in their general education classrooms. Before making additional investments, however, it is essential to collect rigorous evidence that the inclusion model really can work as promised. It would also be wise to balance the high cost of special education programs or schools against the resource needs of the majority of non-disabled students. School administrators and policy makers must try to determine where extra money will do the most good.
Nicholas Zill is a research psychologist and a senior fellow of the Institute for Family Studies. He directed the National Survey of Children, a longitudinal study that produced widely cited findings on children’s life experiences and adjustment following parental divorce.
1. Federal laws establishing rights of young people with disabilities and related requirements for educational institutions are the 1973 Rehabilitation Act, especially Section 504 of the Act; the 1975 Education For All Handicapped Children Act; the 1990 Individuals With Disabilities Education Act (IDEA); and the 1990 Americans With Disabilities Act (ADA) and its 2008 amendments. See here.
2. Author’s analysis of data from the 2019 National Household Education Survey public use data file. *Students likely to be receiving services under an IEP included those with autism (83%), intellectual disability (82%), specific learning disability (79%), developmental delay (77%), and speech or language disorder (63%). Less than half of those with ADD (48%) or serious emotional disturbances (43%) were receiving such services. Similarly, students likely to be enrolled in special education classes were those with an intellectual disability (83%), autism (71%), developmental delay (71%), specific learning disability (67%), and speech or language impairment (51%). Less than half of those with a serious emotional disturbance (38%) or ADD (33%) were enrolled in such classes.
3. 2021 Digest of Education Statistics. Table 204.30. Children 3 to 21 years old served under Individuals with Disabilities Education Act (IDEA), Part B, by type of disability: Selected years, 1976-77 through 2020-21. U.S. Department of Education: National Center for Education Statistics.
4. Ibid. The proportion classified as receiving services for a specific learning disability rose from 1.8% to 4.8% from 1976-77 to 2020-21, while those categorized under “other health impairments” went from 0.3% to 2.2% over the same period. Those classified as receiving services for autism rose from 0.2% in 2000-01 to 1.68% in 2020-21, while those categorized under developmental delay increased from 0.5% to 1.0% over that same period. Both autism and developmental delay were not tabulated as separate conditions prior to 2000-01.
5. Author’s analysis of public use data file from the 2019 National Household Education Survey. Parent respondents were asked: “Has a health professional told you that this child has any of the following conditions?” The questionnaire then listed the names of the conditions one by one. Proportions of children receiving services under an IEP for each of the conditions may be found in the Digest of Education Statistics Table 204.30. Op. cit. Attention deficit disorder is not listed as a separate category in the table.
6. Author’s analysis of public use data file from the 2016 National Household Education Survey.
7. Author’s logistic regression analysis of public use data from the 2016 National Household Education Survey. Odds ratios have been adjusted for family type, income, parent education, student race and ethnicity as well as the child’s age group and sex.
8. State education agency reports of students with disabilities served under an IEP show smaller racial disparities, suggesting possible underreporting by parent respondents to the NHES. In 2020-21, the proportions receiving disability services were: 14.5% total; 14.9% of White students; 16.8% of Black students; 14.1% of Hispanic students; 7.5% of Asian students; 11.5% of Pacific Islander students; 18.6% of American Indian/Alaska Native students; and 14.9% of multiracial students. See: 2021 Digest of Education Statistics, Table 204.40.
9. State education reports of students with disabilities served under an IEP show two-and-a-half times as many males as females receiving services for emotional disturbances and 2.4 times as many for other health impairments. Sex ratios for other disabling conditions are generally in line with parent reports in the NHES. See 2021 Digest of Education Statistics, Table 204.50.
10. Author’s analysis of data from the public use file for the 2019 National Household Education Survey.
11. DeFries, J.C. & Alarcón, M. (1996) Genetics of specific reading disability. Developmental Disabilities Research Review, Vol. 2, Issue 1, pp. 39-47. Rosti, R.O., Sadek, A.A., Vaux, K.K., & Gleason, J.G. (2013). The genetic landscape of autism spectrum disorders. Developmental Medicine and Child Neurology. Vol. 56, Issue 1. Pp. 12-18. Scully, J. L. (2008). Disability and genetics in the era of genomic medicine. Nature Reviews Genetics: Vol. 9, pp. 797-802.
12. Zill, N. & Schoenborn, C. A. (1988) Developmental, learning, and emotional problems: Health of Our Nation’s Children, U.S. Department of Health and Human Services, Public Health Service: National Center for Health Statistics. Corman, H. & Kaestner, R. (1992) The effects of child health on marital status and family structure. Demography, 29, 389–408. Mauldon, J. (1992). Children’s risks of experiencing divorce and remarriage: Do disabled children destabilize marriages? Population studies: Vol 46, Issue 2. Pp. 349-362. Hartley, S. L., Barker, E. T., Seltzer, M. M., Floyd, F., Greenberg, J., Orsmond, G., & Bolt, D. (2010). The relative risk and timing of divorce in families of children with an autism spectrum disorder. Journal of Family Psychology, 24(4), 449–457. Reichman, N.E., Corman, H., & Noonan, K. (2008). Impact of child disability on the family. Maternal and Child Health Journal: Vol. 12, Pp. 679-683. Swaminathan, S., Alexander, G., Boulet, S. (2006). Delivering a very low birth weight infant and the subsequent risk of divorce or separation. Maternal and Child Health Journal, 10, 473–479. Urbano, R.C., Hodapp, R.M., & Floyd, F. (2007). Divorce in families of children with Down Syndrome: A population-based study. Am J Ment Retard: 112 (4): 261–274.
13. Zill, N. "Substance Abuse, Mental Illness, and Crime More Common in Disrupted Families." Institute for Family Studies. March 24, 2015.
14. Zill, N. & Bramlett, M.D. (2014) Health and well-being of children adopted from foster care. Children and Youth Services Review: Vol. 40, May, Pp. 29-40.
15. Zill, N. "The Adoptive Difference: New Evidence on How Adopted Children Perform in School." Institute for Family Studies, 2018.
16. 2021 Digest of Education Statistics. Table 209.42. Percentage of public-school teachers who teach English Language Learner (ELL) students and students with disabilities and percentage with selected qualifications or coursework, by selected teacher and school characteristics: 2020-21.
17. 2021 Digest of Education Statistics. Table 204.60.
18. The proportion of identified students with disabilities who were assessed in NAEP Reading rose from 43% in 1992 to 88% in 2022. After 1998, accommodations such as allowing more time and special assessment sessions and cueing to keep students on task were allowed for those with disabilities. See 2022 Technical Appendix for NAEP Reading Assessment and Math Assessment for further details.
19. NAEP is not a longitudinal study. Independent national and state probability samples of students were tested in 2011, 2015, and 2019. Growth in the skills of these cohorts is being inferred from these cross-sectional samples of students who were in the same grades in the specified years.
20. Average reading scale score results are based on the NAEP reading scale, which ranges from 0 to 500. The NAEP reading assessment scale is a composite combining separately estimated scales for each type of reading (literary and informational) specified by the reading framework...Average scale scores are computed for groups of students; NAEP does not produce scores for individual students. The results for all grades assessed are placed together on one reporting scale. In the base year of the trend line, the assessed grades are analyzed together to create a cross-grade scale. In subsequent years, the data from each grade level are analyzed separately and then linked to the original cross-grade scale established in the base year. Comparisons of overall national performance across grade levels on a cross-grade scale are acceptable... Note that while the scale is cross-grade, the skills tested and the material on the test increase in complexity and difficulty at each higher grade level.” Excerpt from: Interpreting Reading Results, 2022 Nations Report Card: Reading.
21. The gap does get slightly narrower in percentage terms, going from 17% to 15% to 13% lower.
22. "NAEP began administering assessments periodically in the 1990s and administered the mathematics assessment every two years beginning in 2003 with the exception of 2021 due to the COVID-19 pandemic. NAEP mathematics results are reported as average scores on a 0–500 scale at Grades 4 and 8 and on a 0–300 scale at grade 12.”
23. The gap expands from 11% to 14% in percentage terms.
24. It was not possible to extend the math growth comparison to the 12th grade because the advisory board to the NAEP Mathematics Assessment chose, in its wisdom, to change the scoring scale for that grade to a different one that ranges from zero to 300 points. On that new scale, disabled 12th graders in 2019 were 35 points or 23% behind non-disabled students on average. Using a simple and perhaps inappropriate arithmetic conversion, this would be equivalent to a very substantial 58-point difference on the old scale.
25. See average score tables in 2022 Nation’s Report Card in Reading and Mathematics.
26. Author’s analysis of public use data file from 2016 National Household Education Survey.
27. 2021 Digest of Education Statistics. Table 219.46. Public high school 4-year adjusted cohort graduation rate (ACGR), by selected student characteristics and state: 2010-11 through 2019-20.