Highlights
When it comes to family, red states have a bad reputation. From the media to the academy, red states have acquired a reputation for talking a conservative game regarding family, but utterly failing to deliver on their old-school aspirations in the real world. The most thoughtful proponents of this view, scholars Naomi Cahn and June Carbone, have argued that the “red” family model—which discourages premarital sex, encourages younger marriage, restricts abortion access, and idealizes the male-breadwinner/female-homemaker family—is simply unworkable, and maybe even destructive, in the twenty-first century. They point to comparatively high divorce and teen pregnancy rates in many red states as one sign that the red state model has outlived its usefulness.
Cahn and Carbone argue that if more Americans followed the “blue” script of prizing sexual and economic autonomy, focusing on education and professional development in their twenties, and delaying marriage until around age 30, with kids coming after, families would be better off. More generally, they contend that the blue state family model is now better equipped, in today’s economy and culture, to provide children with the kind of stable family that is most likely to secure their welfare.
We bought the Cahn and Carbone thesis about the superiority of the blue family model until last month. But a recent piece at The Upshot showing that conservative areas raise children’s likelihood of later getting married got us thinking. After all, in today’s world, where 41 percent of children are born out of wedlock, and where children born out of wedlock are much more likely to experience family instability and single parenthood, might the relative strength of marriage in red state America translate into an advantage in family stability for children growing up in red states? That is, even if red states have somewhat higher divorce rates, they might also have more children being born into married families; this, in turn, could boost red state family stability over that of blue states.
Or, as Cahn and Carbone might predict, do blue states deliver more stability than red states by stressing the importance of a newer model of family life, one that prioritizes education and delayed family formation?
Exploring Family Stability in Red and Blue America
Answering these questions requires bearing in mind that red states and blue states differ on more than just politics. They also differ in education and income levels and racial and ethnic composition in ways that don’t always line up with political ideologies. Considering family life differences in the light of these additional factors leads to quite different conclusions about whether red states or blue states deliver more family stability for children. This Institute for Family Studies brief, using data from the Census Bureau’s American Community Survey, illustrates this point. We examined the chances that a teenager will grow up with his or her married birth parents throughout childhood, and how this measure varies across predominantly Republican and predominantly Democratic states. It is the first study that we know of to explore the state-level link between geographic trends in partisan voting and family stability for children in the United States (although earlier research has explored the relationship between partisanship and family trends at the county level).
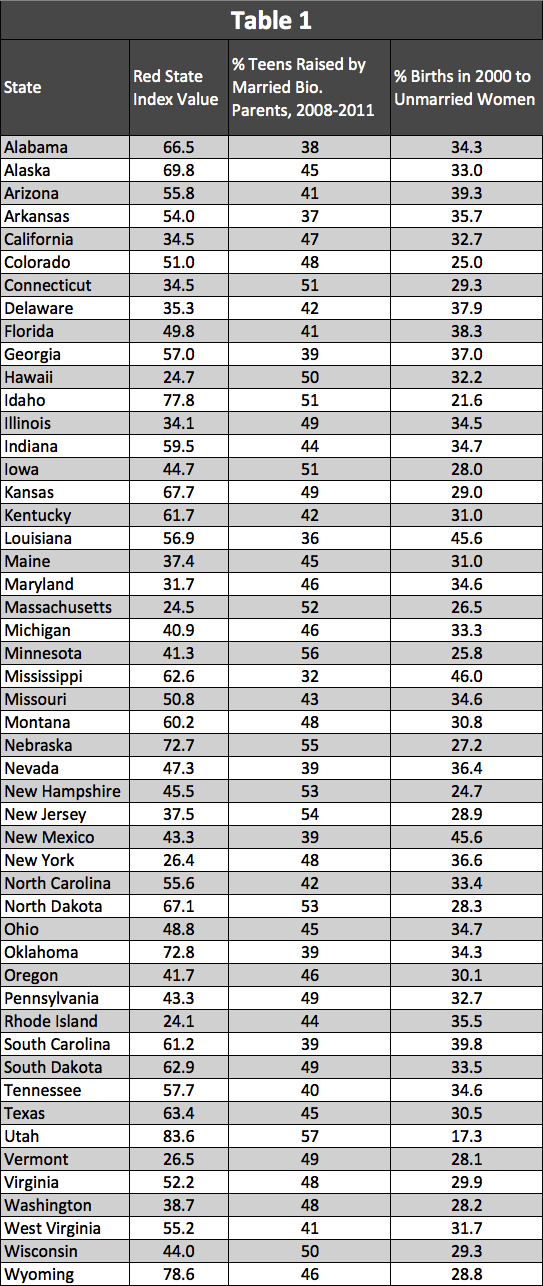
Rather than merely classifying states as either red or blue, we constructed a Red State Index for each of the 50 states, based on the average margin of victory (or defeat) for the Republican candidate in the six U.S. presidential elections between 1992 and 2012.i Index numbers above 50 signify increasingly red (or Republican) states, whereas index numbers below 50 signify increasingly blue (or Democratic) states. The index ranges from 24.1 (for Rhode Island) to 83.6 (for Utah). The index value for each of the 50 states is shown in Table 1, at the end of this brief.
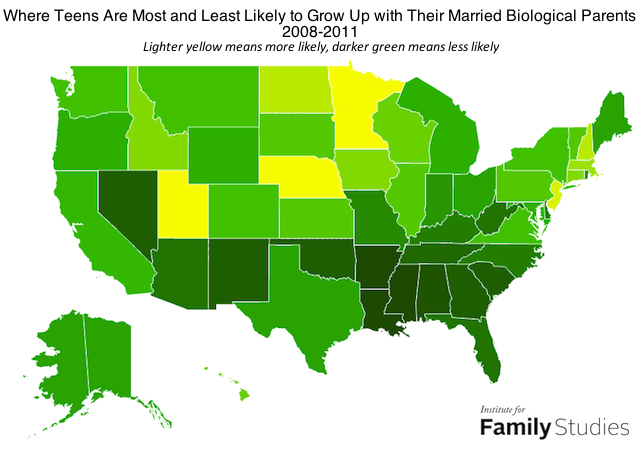
We derived the proportion of teens who grew up living with their married biological parents throughout childhood from the 2008-2011 American Community Survey.ii The teens were 15 to 17 years old at the time of the survey. The percentage varies from 32 percent in Mississippi to 57 percent in Utah, as the below map illustrates, and the value for each state appears in the second column of Table 1.
Mapping Family Stability in America: The Role of Education and Ideology
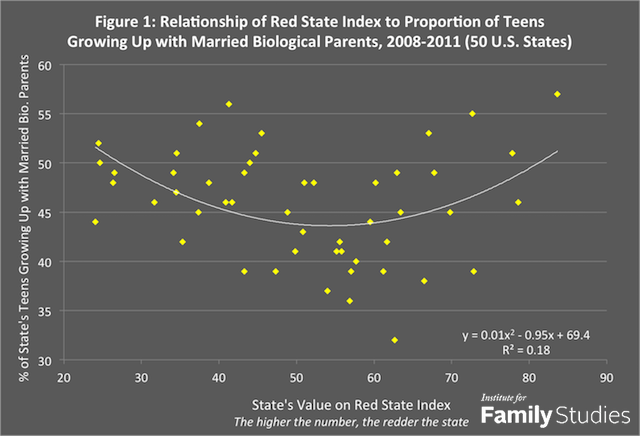
When we look at how teens’ likelihood of growing up with their married parents varies across red states and blue states, we find a U-shaped relationship with the Red State Index (see Figure 1). States voting consistently Republican, such as Utah, Nebraska, and Idaho, are more likely than average states to have their adolescents grow up with married parents, but so are states voting consistently Democratic, such as Massachusetts, Minnesota, and New Jersey. States less strongly red or blue in their presidential preferences have lower proportions of teens growing up with married parents. The curvilinear relationship is statistically significant, with the Red State Index accounting for 18 percent of the variance in the marital upbringing variable.
As we noted above, however, states vary not just in political ideology but also in demographic and socioeconomic attributes that relate to couples’ likelihood of getting and staying married. Among these factors are the level of educational attainment and the ethnic makeup of the state population. Adults with college degrees are more likely to get and stay married than adults with only a high school education or less, and they are less likely to have children outside of marriage. African Americans are less likely than whites to get and stay married, and they are more likely to have children outside of marriage. Hispanic Americans fall in between blacks and whites on these measures, while Asian Americans are most likely to be married and least likely to have children while unmarried.
To investigate the impact of these factors on states’ family stability, we carried out a regression analysis combining the Red State Index with the percent of the state population possessing bachelor’s degrees (or more advanced degrees), as well as the percent of residents who are black, the percent who are Hispanic, and the percent who are Asian. Together, these five variables do a good job accounting for cross-state variation in the marital upbringing variable: they account for nearly three-quarters of the variance in the proportion of teens who grew up with their married birth parents.
There are two key takeaways from our analysis. First, one major reason the bluest states have a high share of children in intact families is that they are home to comparatively high numbers of college-educated adults, who tend to get and stay married nowadays.
Second, adjusting for education and race/ethnicity transforms the relationship between the Red State Index and marital upbringing from a curvilinear to a linear one. The redder the state, the more likely is a teen to grow up with his or her married birth parents. The relationship is modest but statistically significant. For every ten-point increase in the Red State Index, the proportion of teens living with both parents rises by one percentage point. This suggests that red state family culture is associated with increased odds of being raised in an intact, married family.
Red State America Is More Married
The proportion of a state’s teens enjoying household stability isn’t the only family indicator that varies depending on the local political ideology: The Red State Index is strongly associated with the odds that adults are married in states across the country. Specifically, the Red State Index is positively related to having more married residents, as is the proportion of state residents who are college graduates. The more black residents there are in a state, the lower the proportion of married residents. The five variables listed above—Red State Index score, percent of residents with college degrees, percent African American, percent Hispanic, percent Asian—also do a good job of accounting for cross-state variation in the proportion of the adult population aged 15 and over who are currently married. Together they account for more than three-quarters of state-to-state variation.
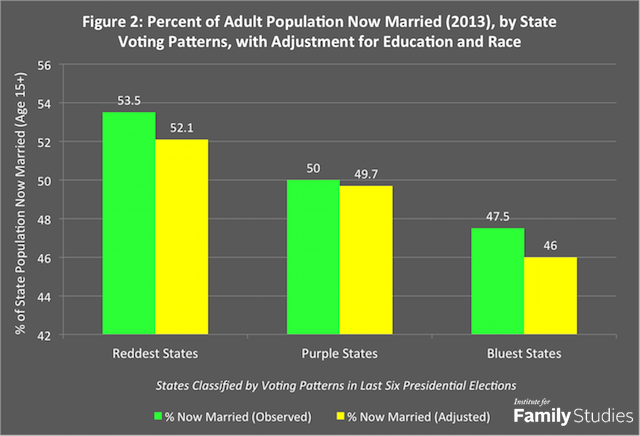
As shown in Figure 2, consistently red states have higher proportions of married adults than purple states, which have higher proportions than consistently blue states.iii Adjusting for differences across states in educational attainment and racial composition increases the differences between red, blue, and purple states in the proportions now married. Unsurprisingly, the percentage of adults who are married is positively related to the proportion of teens growing up with both married parents.
Nonmarital Births Are Lowest in the Bluest and Reddest States
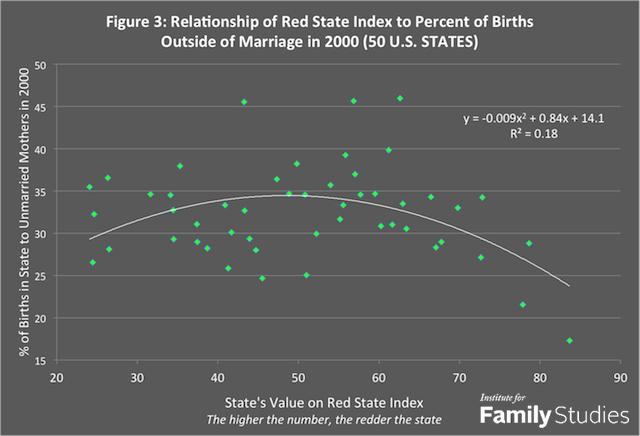
How, then, is political partisanship related to the odds of being born outside of wedlock? Figure 3 indicates that children in the bluest states and the reddest states were the least likely to be born out of wedlock in the year 2000, around the time the teens we studied were born. And, again, the low levels of nonmarital childbearing in the bluest states can be partly explained by higher levels of education, just as the low levels of nonmarital childbearing in the reddest states can be explained in part by red state family culture.
Some couples who are unmarried when their child is born go on to forge lifelong marriages, and some married couples go on to divorce, but in general children born outside of wedlock are significantly more likely to experience family instability and single parenthood. Given that, it’s no surprise that we find that nonmarital childbearing in 2000 is a key predictor of family instability among today’s teens. In other words, states with low levels of nonmarital childbearing in 2000 witness high levels of family stability for their adolescents today because marriage is linked with family stability. Thus, one reason the bluest states and reddest states deliver more family stability to their adolescents is that they share relatively low levels of nonmarital childbearing.
Red and Blue Families
The reddest and bluest states in America are most likely to provide today’s teens with the kind of stable, married family life that fosters optimal child outcomes. This Institute for Family Studies brief suggests that education and political ideology help to explain the links between geographic location and family stability. As Cahn and Carbone would predict, strongly blue regions like New England have high proportions of teens growing up with married parents in large part because their populations are highly educated (but also because they have fewer minority residents). The blue state model works fairly well in Northeastern and Midwestern states like Massachusetts and Minnesota.
Strongly red states like Utah and Nebraska also have high proportions of teens growing up with married parents, even though red state Americans are less educated than those in strongly blue states. But their residents are more likely to have deep normative and religious commitments to marriage and to raising children within marriage. And these strongly red states also have relatively low proportions of minorities. The red state model works fairly well in the West and the Midwest.
Red states such as Alabama and Texas, on the other hand, have lower levels of teens growing up with married parents both because they have lower education levels and because they have high proportions of black or Hispanic residents, whose families are less stable on average than white and Asian families. The educational and ethnic factors overwhelm the predominantly conservative orientations of the state populations in these Southern states. Thus the red state model does not appear to be successful in the American South.
The conventional wisdom among scholars about family in America suggests the red state family model has failed to deliver the stability that boosts children’s odds of thriving in today’s world. But we find that the reddest states in America are more, not less, likely to raise their children in a stable, married home, other things being equal. Yet insofar as residents of blue America prioritize education and work, and postpone family formation, in the ways that Cahn and Carbone prescribe, they too have a path towards stable, two-parent families.
Our bottom line: In understanding the confusing contours of political and family geography, it looks like both education and ideology matter. That’s why the bluest and reddest states in America register the highest levels of family stability in the nation.
W. Bradford Wilcox is a senior fellow at the Institute for Family Studies, a visiting scholar at the American Enterprise Institute, and the co-author of “For Richer, for Poorer: How Family Structures Economic Success in America.” He also directs the Home Economics Project at the American Enterprise Institute and the Institute for Family Studies. Nicholas Zill is a psychologist and survey researcher who has written on indicators of family and child wellbeing for four decades. Prior to his retirement, he was the head of the Child and Family Study Area at Westat, a social science research corporation in the Washington, D.C., area.
![]()
i. Nationwide, four of these elections were won by Democrats (Bill Clinton in 1992 and 1996; Barack Obama in 2008 and 2012) and two by a Republican (George W. Bush in 2000 and 2004). We converted the numerical vote difference between the Republican and Democratic candidate in each state to a percentage by dividing it by the total presidential vote in the state, including votes for candidates from parties other than the two major ones. Then we multiplied the percentage difference by 100 and added the result to 50 (or subtracted it from 50 in the case of Republican defeats). The resulting index has a mean of 50.7 and a standard deviation of 15.8 (with all states weighted equally, regardless of population size).
ii. The proportions are estimated from PUMS files for each state, following the procedure described in Fagan and Zill (2011). The percent growing up with married biological parents has a mean of 45.7 and a standard deviation of 5.6 (again, with all states weighted equally).
iii. Figure 2 shows the percentage of adults age 15 and over who are currently married for the reddest red states and bluest blue states (those in the top and bottom ten percent of states on the Red State Index), as well as for the purple states (those in the middle 20 percent of the distribution).