Highlights
One-quarter of all children in the United States are the offspring of first-generation immigrant parents.1 Some commentators see the influx of immigrants and refugees, particularly those who don’t speak English or practice a non-Christian religion, as a threat to “the American way of life.” Yet children of immigrants are more likely, not less likely, than children of native-born Americans to be growing up in traditional families, i.e., with two married parents. Compared to single-parent, step, or foster families, married-parent families are associated with better life outcomes, including greater educational attainment, career advancement, financial success, and emotional well-being for both child and adult family members.2
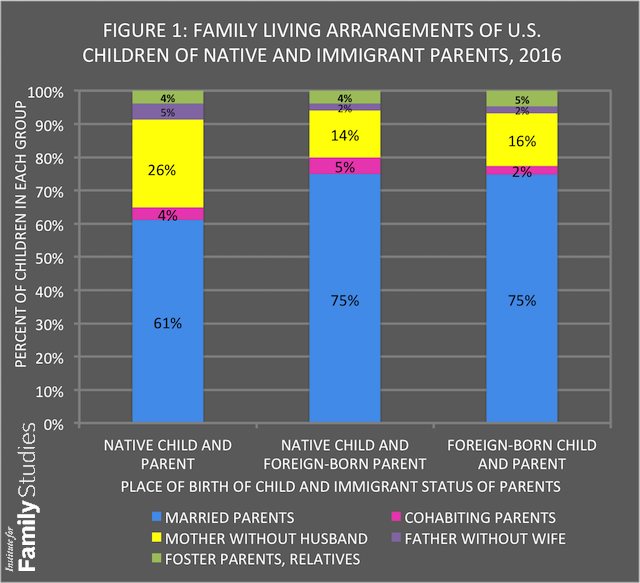
Indeed, the latest data from the Census Bureau on the family living arrangements of U.S. children show that 75 percent of immigrant children live in married-couple families, compared to 61 percent of children of U.S.-born parents.3 The figure is the same for immigrant children who were born in this country as for those who were foreign-born.4 Children of immigrants are less likely than native children to be living with divorced, separated, or never-married mothers: 14 percent lived with their mothers only, compared to 26 percent of children of U.S.-born parents (see Figure 1).
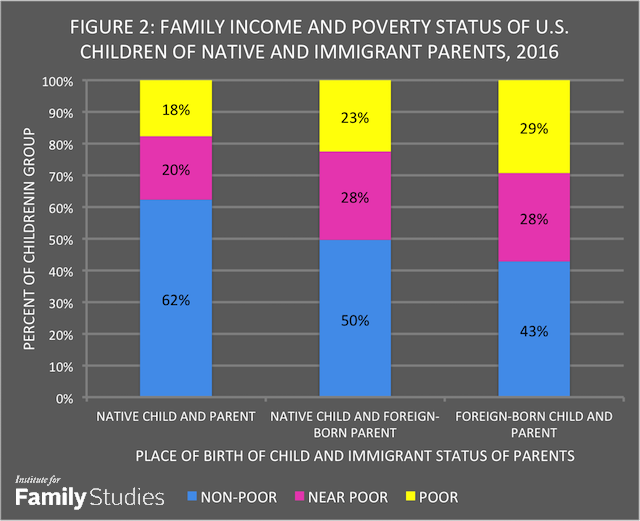
Furthermore, immigrant parents stay together despite the fact that many are living below or close to the poverty line. Half of U.S.-born children of recent immigrants are in families that are poor or near poor,5 with nearly a quarter living in families below the poverty line. The circumstances of foreign-born immigrant children are worse: 57 percent are in families that are poor or near poor, with 29 percent living in families below poverty. The comparable figures for native children are 38 percent in poor or near-poor families, with 18 percent below the poverty line6 (see Figure 2).
The principal reason why immigrant families are worse off financially is that three times as many immigrant adults as U.S.-born adults have not finished high school (29 percent versus 9 percent), and a greater proportion have only a high-school education or less (52 percent versus 38 percent).7 At the upper end of the educational continuum, there are essentially as many immigrant adults as native adults with college degrees (29 percent versus 31 percent), as well as equivalent numbers with graduate or professional degrees (12 percent versus 11 percent). However, as with U.S.-born adults, poorly-educated immigrants tend to start having children earlier and to have more children than highly-educated immigrants.
Despite their higher poverty levels, immigrant families with children are no more likely than native families with children to be receiving government welfare benefits. As Figure 3 below shows, 21 percent of children of immigrant parents are in families receiving food stamps, compared to 20 percent of children of U.S.-born parents. And just 2 percent of children of immigrants are in families receiving cash welfare payments, compared to 3 percent of children of native parents.8

Given the large numbers of recent immigrants with low education levels, reform proposals aimed at tilting immigration policies to favor higher-skilled applicants seem warranted. But we should also recognize the strong work ethic and robust family values that many immigrant families exemplify. Far from undermining our traditions, they may be showing us the way to “make America great again.”
Nicholas Zill is a psychologist and survey researcher who has written on indicators of family and child well-being for four decades. Prior to his retirement, he was the head of the Child and Family Study Area at Westat, a social science research corporation in the Washington, D.C., area.
1. According to the Census Bureau’s Current Population Survey, there were 18.3 million children of foreign-born parents in the U.S. in 2016, out of a total of 73.7 million children under the age of 18. There were also 220 thousand foreign-born children with native parents, who were either foreign adoptees or children of U.S. parents born when the parents were stationed abroad. See Table C3. Living Arrangements of Children Under 18 Years. https://www.census.gov/hhes/families/data/cps2016C.html
2. Sara McLanahan, & G. Sandefur, Growing up with a single parent. What hurts. What helps. (Cambridge, MA: Harvard University Press, 1994); Paul R. Amato, & B. Keith, "Parental divorce and the well-being of children: A meta-analysis," Psychological Bulletin, 110, No. 1 (1991): 26-46; Paul R. Amato & B. Keith, "Parental divorce and adult well-being," Journal of Marriage and Family, 53, No. 1 (1991): 43-58.
3. These figures include 2.7 million native children and 112 thousand foreign-born children who were living with neither biological parent, but with other relatives or in foster families. I have allocated the native children proportionally to “native born immigrant child” and “native child” categories and placed all the foreign-born children in the “foreign-born immigrant child” category. If only children living with one or both parents were considered, 78 percent of native-born immigrant children and 79 percent of foreign-born immigrant children would be living in married-couple families, as opposed to 64 percent of native children.
4. 16 million children of first-generation immigrant parents were born in this country; 2.3 million were born abroad.
5. Near poor means between 100% and 199% of the poverty line.
6. U.S. Bureau of the Census, Current Population Survey Annual Supplement. Table C8. Poverty Status, Food Stamp Receipt, and Public Assistance For Children Under 18 Years. https://www.census.gov/hhes/families/data/cps2016C.html
7. U.S. Bureau of the Census, 2015 American Community Survey One-Year Estimates. Selected Characteristics of the Native and Foreign-Born Populations. The cited figures are for adults 25 years old and older. Retrieved from the American Fact Finder website.
8. U.S. Bureau of the Census, 2016 Annual Supplement to the Current Population Survey, Table C8. op cit. footnote 5.