Highlights
- Generally speaking, it remains the case that moms and dads do different types—but similar amounts—of work. Post This
- Breadwinner moms edge out breadwinner dads most years, and stay-at-home moms absolutely massacre stay-at-home dads out of the workforce. Post This
- Robert VerBruggen takes an updated look at the paid and home working hours of moms and dads. Post This
Back in 2019, I wrote a provocative piece for this blog called “The Myth of the ‘Lazy’ Father.” I drew attention to something that had irked me, as a husband and father, for a long time: Repeatedly, researchers had shown that for married couples with kids in the modern U.S.,1 total work time was pretty equitable between spouses when paid work and home work were combined—indeed, if anything, dads work a little more. And yet, the narrative always ran in the other direction, focusing on the particular types of work where moms shouldered more of the burden, such as child care, and ignoring the possibility that couples’ division of labor might simply reflect the varying preferences of men and women.
Digging deeper into the American Time Use Survey (ATUS), I showed that total work time was remarkably equal even among couples where both worked or both worked full-time (contrary to notions of a “second shift” for working moms); that breadwinners tended to work more than stay-at-home parents; and, in a finding indeed embarrassing to men, that stay-at-home moms worked way more than stay-at-home dads.
As I noted and my critics emphasized, there are many nuances to this issue and the measurement of work time—for instance, time is classified by “primary” activity, so if a parent watches TV while the kids play upstairs, that doesn’t count as child-care time. But these data jibe poorly with simple narratives of oppressive patriarchy, at least within married couples and on average.
It’s time for a follow-up. My earlier piece combined ATUS data from 2013 to 2017, but now we have numbers through 2022. By applying the same methods I used previously to every available year, I can extend the analysis through the post-pandemic years—though ATUS data collection was paused during the peak of the pandemic itself, from March 17 to May 10 of 2020. I can also bring the analysis back in time to 2003, to see if my earlier numbers were missing important details from the preceding decade.
Here’s what I found.
The ATUS asks respondents to write down exactly what they did on a single day, and the Bureau of Labor Statistics has a classification system for grouping these responses into activity types, which include traveling to the activities in question. As I did in 2019, I added up total work including employment, caring for household members, shopping, and household activities like cleaning and yard work,2 and I multiplied the daily minutes by 7/60 to estimate weekly hours.
Here’s the broadest possible look at these data: Take all married moms and dads with minor kids, calculate their average total work time in every single year, and plot them against each other in an epic two-decade showdown of the sexes. I’ve set up the shaded areas so that when they don’t overlap, the differences are considered statistically significant at the 5% level.3
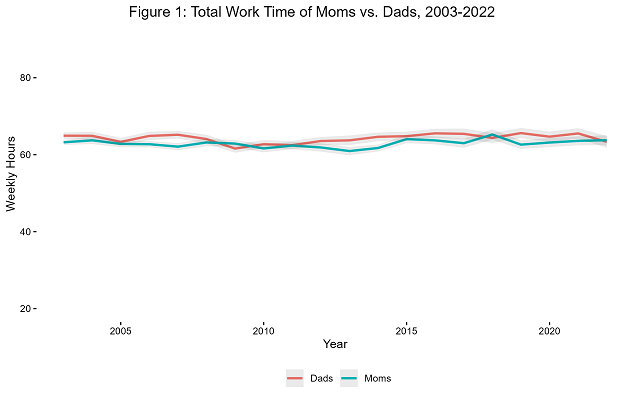
Source: Author’s analysis of American Time Use Survey, accessed via: Sarah M. Flood, Liana C. Sayer, Daniel Backman and Annie Chen. American Time Use Survey Data Extract Builder:Version 3.2 [dataset]. College Park, MD: University of Maryland and Minneapolis, MN: IPUMS, 2023. https://doi.org/10.18128/D060.V3.2. Notes: When shaded areas do not overlap, differences are significant at the 5% level; 83.4% confidence intervals are calculated for this purpose. Because data collection paused during the early pandemic, 2020 data exclude March 18 to May 9. Total work time includes care for household members, housework, shopping, and paid work.
My previous result is pretty consistent. The totals are fairly even, and, if anything, dads work a little more. One noticeable pattern, though, is that the Great Recession reduced the total work time of dads but not moms. Something else I found surprising, even though the peak pandemic months are not covered, is that recent years don’t show too sharp a break with previous trends. (One weird thing I’ll come back to is the apparent drop in men’s hours in 2022, though.)
Of course, as in my previous analysis, the total numbers mask a lot of differences in terms of division of labor—with women working less for pay, and being more likely to stay home with kids entirely—which may or may not concern you, depending on how compelling you found my arguments about the differing preferences of men and women, and how obsessed you generally are with parity in all things. Here’s how those totals break down by activity type:
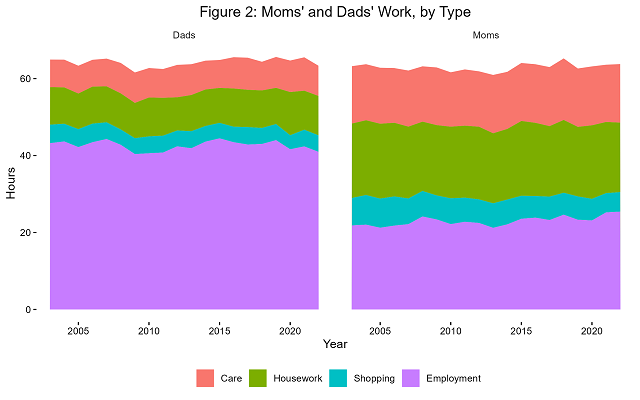
Source: Author’s analysis of American Time Use Survey, accessed via: Sarah M. Flood, Liana C. Sayer, Daniel Backman and Annie Chen. American Time Use Survey Data Extract Builder: Version 3.2 [dataset]. College Park, MD: University of Maryland and Minneapolis, MN: IPUMS, 2023. https://doi.org/10.18128/D060.V3.2. Notes: Because data collection paused during the early pandemic, 2020 data exclude March 18 to May 9. Total work time includes care for household members, housework, shopping, and paid work.
There’s not too much going on in terms of changes over time, though it’s mildly interesting how paid work hitched downward in 2020, especially for men, but was made up for with unpaid work.
What if we only look at couples where both work, even if only part-time?
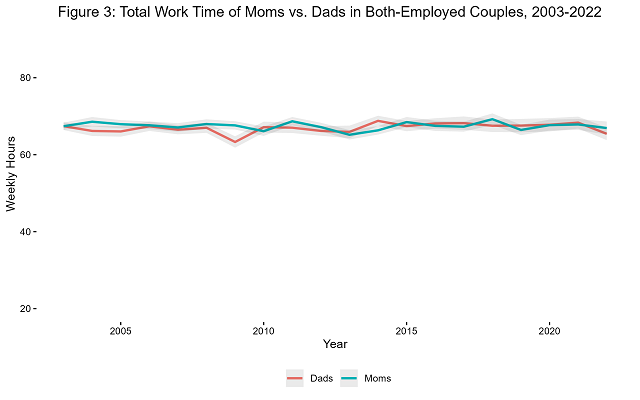
Source: Author’s analysis of American Time Use Survey, accessed via: Sarah M. Flood, Liana C. Sayer, Daniel Backman and Annie Chen. American Time Use Survey Data Extract Builder: Version 3.2 [dataset]. College Park, MD: University of Maryland and Minneapolis, MN: IPUMS, 2023. https://doi.org/10.18128/D060.V3.2. Notes: When shaded areas do not overlap, differences are significant at the 5% level; 83.4% confidence intervals are calculated for this purpose. Because data collection paused during the early pandemic, 2020 data exclude March 18 to May 9. Total work time includes care for household members, housework, shopping, and paid work.
That shows pretty consistent equity in terms of total time, especially since 2010. So on to couples where both mom and dad work full-time, 35 hours per week or more—where the results are a bit more interesting:
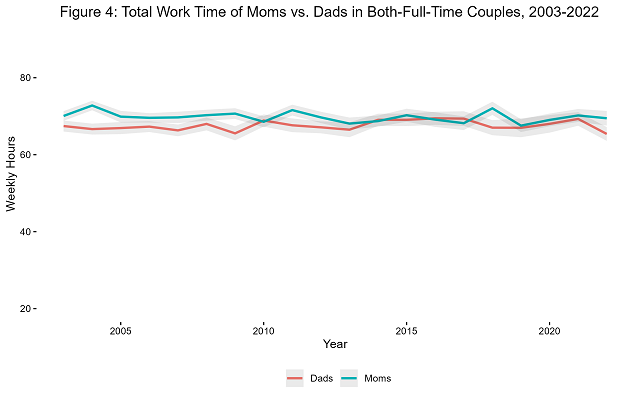
Source: Author’s analysis of American Time Use Survey, accessed via: Sarah M. Flood, Liana C. Sayer, Daniel Backman and Annie Chen. American Time Use Survey Data Extract Builder: Version 3.2 [dataset]. College Park, MD: University of Maryland and Minneapolis, MN: IPUMS, 2023. https://doi.org/10.18128/D060.V3.2. Notes: When shaded areas do not overlap, differences are significant at the 5% level; 83.4% confidence intervals are calculated for this purpose. Because data collection paused during the early pandemic, 2020 data exclude March 18 to May 9. Total work time includes care for household members, housework, shopping, and paid work.
The 2013-2017 period I focused on previously seems particularly even, and the other years add useful context. There was a “second shift” for moms of a few hours a week back in the 2000s; and while the individual-year differences usually aren’t statistically significant, the raw totals for full-time moms seem to be running slightly higher again since 2017. This is something to keep an eye on.
The final thing I did in 2019 was to look at couples where one person worked full-time, while the other was out of the labor force but not disabled. So, let’s see the year-by-year totals for breadwinner moms and dads, compared with stay-at-home moms and dads, all on one graph. Note that since sole-earner mom/stay-at-home dad couples are rare, smaller sample sizes lead to noisier estimates for those categories—the shaded areas are larger, and the central estimates bounce around from year to year. (Also note that this starts in 2008 because a disability variable I rely on was not collected until then.)
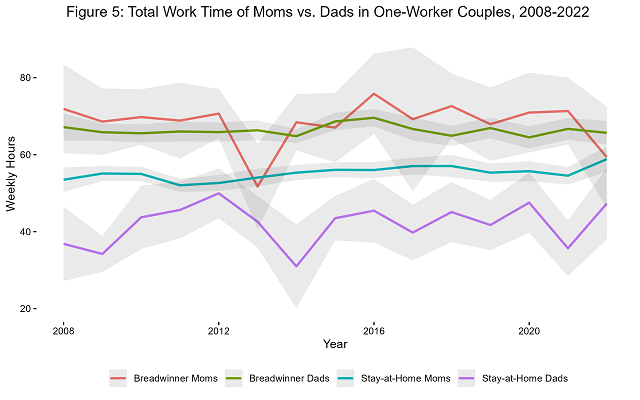
Source: Author’s analysis of American Time Use Survey, accessed via: Sarah M. Flood, Liana C. Sayer, Daniel Backman and Annie Chen. American Time Use Survey Data Extract Builder: Version 3.2 [dataset]. College Park, MD: University of Maryland and Minneapolis, MN: IPUMS, 2023. https://doi.org/10.18128/D060.V3.2. Notes: When shaded areas do not overlap, differences are significant at the 5% level; 83.4% confidence intervals are calculated for this purpose. Because data collection paused during the early pandemic, 2020 data exclude March 18 to May 9. Total work time includes care for household members, housework, shopping, and paid work.
Total work is higher for the full-time employees in these couples. But breadwinner moms edge out breadwinner dads most years (even if the individual-year differences aren’t statistically significant), and stay-at-home moms absolutely massacre stay-at-home dads out of the workforce. Get it together, dudes.
Lastly, let’s clean up a few odds and ends.
For instance, while the data don’t cover the peak pandemic months, it’s an interesting question how couples muddled through that period. Abruptly, work hours decreased as businesses shut down, and child care needs surged as schools shut down, too—and it wouldn’t surprise me if that combination fell harder on moms, who already specialized more in child care. I doubt we’ll ever know with certainty how that played out given the difficulty of survey work during that rough time, but a particularly interesting May 2020 survey out of Rutgers asked partnered respondents (though not just parents) to estimate what share of unpaid work fell on them vs. their partners, both before and during the pandemic.
Perhaps most amusingly, there was a big gap between how men and women assessed the preexisting burdens. Men thought they’d been doing about 45% of the unpaid work before the pandemic, but women thought their partners had been doing just 31 percent! But changes in the perceived burdens were surprisingly modest. Women assessed their partners’ share falling from 31% to 29%; men assessed their share rising from 45% to 48%. Both men and women estimated their paid work hours fell by about 10.
And what about that weird dip in the 2022 work hours of men, concentrated in paid work (and also possibly occurring among breadwinning moms, if you look at the last chart carefully)? It could just be a blip; I wouldn’t make too much of a single year’s data. But if it continues, it’s conceivable that it could stem from remote work. If workers are saving time by not commuting—and if men, especially, are just “pocketing” that time rather than using it to take on more housework—this could unbalance previous equilibria. A study by my former Manhattan Institute colleague Christos Makridis has some related analysis.
But, generally speaking, it remains the case that moms and dads do different types, but similar amounts, of work—and that we should respect the decisions they make.
Robert VerBruggen is a fellow at the Manhattan Institute and an IFS research fellow.
1. Daniel Hamermesh has made a similar point at the international level, what he calls “iso-work”: As he and two coauthors once summarized, “In rich non-Catholic countries, men and women average about the same amount of total work.”
2. This is the more comprehensive of the two definitions my previous piece used. Variable names are BLS_HHACT, BLS_PURCH, BLS_CAREHH, and BLS_WORK.
3. This corresponds to an 83.4% confidence interval. Standard errors, calculated with replicate weights, are multiplied by 1.385 and then both added and subtracted from the point estimates to draw the boundaries of the shaded areas.