Highlights
Median household income is up and poverty is down among most demographic groups for the second consecutive year, according to the U.S. Census Bureau in a series of reports released earlier this week. The reports, which include income and poverty, health insurance coverage, and the Supplemental Poverty Measure, contain a treasure trove of data that the Census Bureau releases each September, including some encouraging news about families in poverty that we think are noteworthy.
1. Median household income increased for families. Americans saw an increase in “real annual household income” for the second consecutive year: up by 3.2% overall between 2015 and 2016. Family households experienced an increase of 2.7% in median household income for 2016. For married-family households, the real median income increased by 1.6%, while it increased 7.2% for female-householder families between 2015 and 2016.
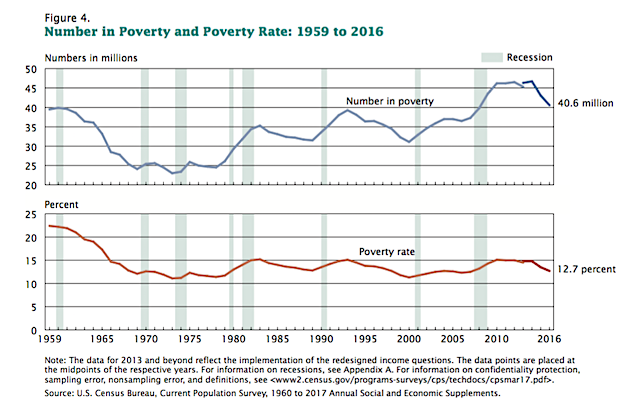
2. Poverty is down for most groups. The number of people in poverty declined between 2015 and 2016 for most groups, except for those age 65 and older. In 2016, 40.6 million individuals were in poverty, which is 2.5 million less than the previous year, and 6.0 million less than in 2014 (see figure below). The overall poverty rate dropped from 13.5% in 2015 to 12.7% in 2016 (although the report notes the 2016 poverty rate is “not statistically different than in 2007, the year before the most recent recession”). The total number of senior Americans (ages 65 and older) in poverty increased, from 4.2 million to 4.6 million.
3. Fewer families are living in poverty. The official poverty rate for “primary families” declined from 10.4% in 2015 to 9.8% in 2016 (primary families are defined as “a group of two or more people, one of whom is the householder, related by birth, marriage, or adoption, and residing together”). For married families, the poverty rate stayed about the same: 5.1 percent of married-couple families were in poverty in 2016 (or 3.1 million families). However, the poverty rate for both female-householder and male-householder families declined, as indicated in the figure below. Between 2015 and 2016, the poverty rate for female-householder families dropped from 28.2% to 26.6%. For male-householder families, the poverty rate declined from 14.9% in 2015 to 13.1% in 2016.
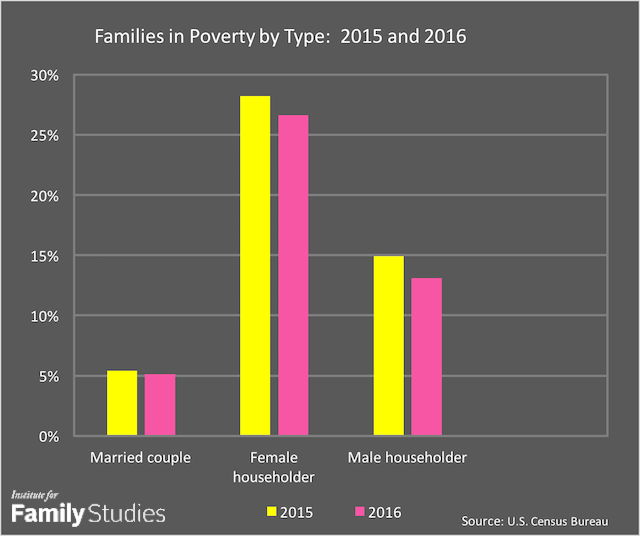
Source: U.S. Census Bureau, Income and Poverty in the United States: 2016, Table 4.
4. Child poverty declined but remains high. The percentage of children living in poverty continues to be too high in the United States, although it is declining. While children account for 23.0% of the total population, they represent 32.6% of people in poverty.
The Census estimates children poverty in two ways: by looking at all children under age 18 who are living in poverty and at “related children” in poverty (defined as: “people under age 18 related to the householder by birth, marriage, or adoption, who are not themselves householders or spouses of householders”).
The percentage of all children in poverty dropped from 19.7% in 2015 to 18.0% in 2016. For related children, the poverty rate declined from 19.2% in 2015 to 17.6% in 2016. If we look at child poverty by family structure as shown in the figure below, we see that the percentage of related children in married families who are in poverty is much lower at 8.4% in 2016 (down from 9.8% in 2015). By comparison, the percentage of children in poverty in single-mother families (or families headed by a female householder, with no husband present) was 42.1% in 2016, which the Census says is not "statistically different from 2015." However, the percentage of related children in poverty in single-father households (or male householder families, with no wife present) fell from 25.9% in 2015 to 19.9% in 2016.
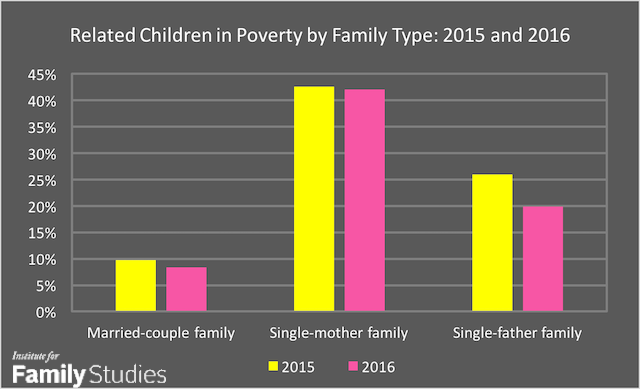
Source: U.S. Census Bureau, Income and Poverty in the United States: 2016.
The poverty rate for young children (under age 6) also declined, from 21.0% in 2015 to 19.5% in 2016. Family structure makes a big difference when it comes to poverty, especially for children. According to the Census report, in 2016,
about half (49.1 percent) of related children under age 6 in families with a female householder were in poverty. This was more than four times the rate of their counterparts in married-couple families (9.5 percent).
5. How poverty is measured affects the poverty rate. In addition to measuring the official poverty rate for various groups, the Census Bureau also reports on the Supplemental Poverty Measure (SPM). The SPM calculates poverty by “taking account of many of the government programs designed to assist low-income families and individuals that are not included in the official poverty measure,” including deducting “necessary expenses for goods and services from income” (like taxes, child care expenses, and child support payments). Even though the SPM is not used to determine eligibility for government aid programs, it is another helpful tool for measuring the financial health of individuals and families. And as the report explains, “When tax credits and noncash benefits results are included, this results in lower poverty rates for some groups.”
Children are one of the groups where a decline in the poverty rate occurs with the SPM. Including non-cash benefits and other measures, the child poverty rate for 2016 is 15.1%, a decline of nearly 3% from the official child poverty rate of 18%. The poverty rate for cohabiting partners also drops significantly using the SPM, from 26.3% to 12.9% in 2016. On the other hand, when the SPM is used, the poverty rate for married couples increases by about 3%. The Census website has an interesting graphic depicting the percentage of various groups in poverty by the supplemental and the official poverty measure.