Highlights
Who’s gay? Social scientists have long known that the answers to this question are very different if you ask about self-identified sexual orientation, sexual attraction, or sexual behavior. Alfred Kinsey’s groundbreaking work on sex midway through the 20th century introduced the idea that 10% of the population was gay or lesbian, but rigorous subsequent analysis with national data put the true number closer to 2 or 3 percent.
But that was then. More recent data from Gallup suggest an explosion in the number of Americans who identify as LGBT, up to 7 percent. For Zoomers (Generation Z; anyone born between 1997 and 2012), a full 20% identify as LGBT. That’s a big jump.
The reasons for this shift are obviously complex and won’t be examined at length here. There’s no real way to prove or disprove any of the usual arguments. Instead, I’ll explore whether the sharp uptick in LGB identification corresponds to a shift in sexual behavior.1
There are two broad possibilities. The first is that self-identified sexual orientation is fluid, but sexual behavior isn’t. If this argument is right, more people are identifying as LGB but their sexual behavior hasn’t changed. Writing for Quillette, political scientist Eric Kaufmann recently made this argument based on an analysis of data from the General Social Survey (GSS). The second possibility, of course, is that the surge in LGB identification corresponds to an increase in same-sex sexual behavior.
The National Survey of Family Growth (NSFG), a repeated cross-sectional survey, offers excellent data for exploring these issues. The sample size is large, and the data includes detailed measures of sexual behavior. For most analyses, I sort respondents by generation. Generation X is anyone born from 1965 to 1980, Millennials are born from 1981 to 1996, and Generation Z (Zoomers) are from 1997 to 2012. It should be acknowledged that these cohorts are a product of journalists, not social scientists. The cut-points weren’t chosen because they correspond to established differences in behavior or attitudes. But these generation names enjoy broad cultural currency, so they’re a useful shorthand for exploring differences across American birth cohorts (the social science name for the year somebody was born). In a previous IFS post, I demonstrated that there’s no clear trend in sexual behavior between 2011 and 2019, so I’ll focus on differences in birth cohort (and, to a lesser extent, age).2 As we’ll see, this is an important consideration.
I examine data from the last four waves of the NSFG, reflecting data collected between 2011 and 2019. This provides a nationally representative sample of over 42,000 respondents, all aged 15-50.3 A large sample is necessary for examining relatively uncommon segments of the population, like, say, young gay and lesbian Millennials. Sexual activity is measured as any sex in the past year. Elsewhere I’ve shown that survey measures of sexual behavior are reasonably accurate.
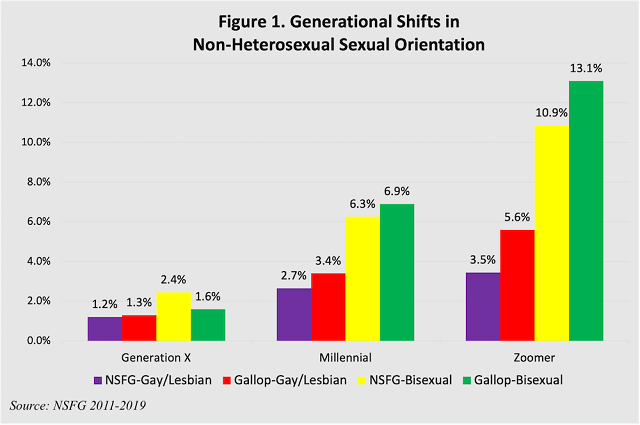
How do the NSFG data stack up against the 2022 survey results from Gallup? To make the comparison as direct as possible, I’ll present data just from the most recent survey wave, collected between 2017 and 2019. As shown in Figure 1, NSFG data indicate fewer LGB Americans than the Gallup data suggest, although the differences aren’t large for the most part. The largest gaps between the two surveys are for Zoomers, where the Gallup data show substantially more LGB respondents. This isn’t surprising: Zoomers are young, and therefore still changing. This also makes them more susceptible to trends, including all of the ideological tumult of 2020.
Both the Gallup and NSFG data make clear where the biggest shifts have been: the percent of Americans who identify as bisexual. The rising number of lesbians and gays is much more modest, especially in the presumably more reliable NSFG data.
It’s one thing to claim an identity in a survey; it’s another thing to act on that identity. Indeed, an annual tally of NSFG data reproduces the result Kaufman obtained with the General Social Survey: sexual orientation has changed a lot more than sexual behavior over the past decade.
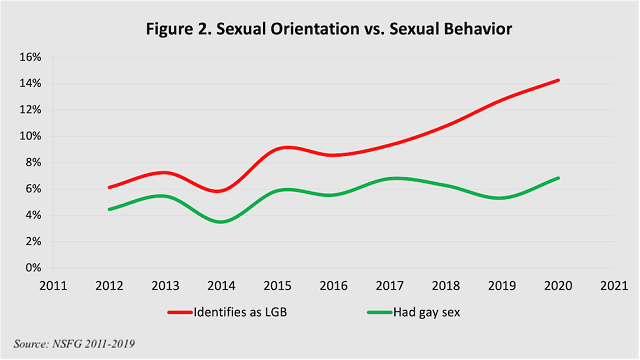
But that’s not the end of the story, as the results shown in Figure 2 rely on assumptions that might not be tenable. First, and more obviously, they combine results for gay/lesbian and bisexual survey respondents. As most of the growth in LBG identification is for bisexuals, it makes sense to separate the two groups. Second, an annual tally implies that year-to-year trends are what drive sexual orientation and sexual behavior. But what if it’s birth cohort—the years someone grows up in—or even age? Indeed, psychologist Jean Twenge and her colleagues have shown that some dimensions of youthful sexuality are indeed the product of birth cohort, not period. Third, younger people are just having less sex in general. This dynamic alone could produce the disjuncture apparent in Figure 2.
Figure 3 shows how sexual activity varies by cohort and sexual orientation. For Millennials and members of Generation X, there’s little that’s remarkable in the relationship between sexual orientation and sexual behavior. Almost everyone—around 90%—reported having sex in the past year, and rates of celibacy don’t vary much by sexual orientation.
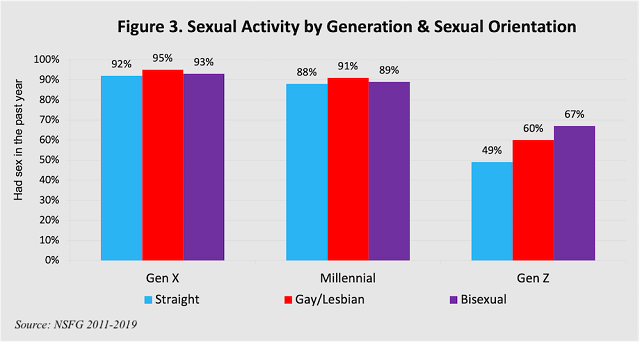
The story for Generation Z is completely different. The Zoomers in the NSFG data range in age from 15 to 23, so it’s not surprising far fewer of them are sexually active compared to Millennials or Generation Xers. Above and beyond the familiar sex recession, some Zoomers are just plain young. Moreover, as I reported in an IFS post last year, college-educated young people, especially women, seem to be putting sex on the back burner until getting their careers established.
None of that detracts from the interesting part regarding Generation Z’s sexual behavior: Zoomers who identify as gay or lesbian, or—especially—bisexual are having way more sex than young straight people. Only 49% of heterosexual Zoomers have had sex in the last year, compared to 60% of their gay/lesbian peers, and 67% of those who identify as bisexual. These differences, based on a sample of over 6,500 Zoomers, are conspicuously large.
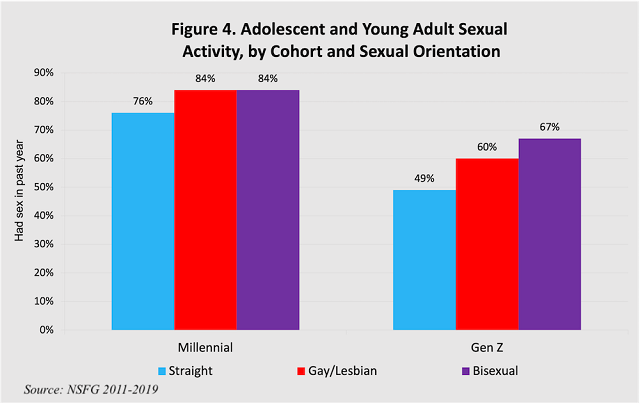
Striking as the figures for Zoomers might seem, they’re misleading. One obvious difference between Zoomers and older generations is that the Zoomers, all born after 1996, are all relatively young—and young people have distinctive patterns of sexual behavior. This point is made clear in contrasting these data with a sub-sample of Millennials in the same age range: 15-23. This comparison appears in Figure 4. The biggest takeaway is that irrespective of sexual orientation, Zoomer adolescents and young adults are having a lot less sex than Millennials did at the same age. The gaps between straight, gay/lesbian, and bisexual survey respondents look fairly similar across cohorts, with one exception: the gap in sexual activity between heterosexuals and bisexuals is especially great for Zoomers. Put another way: the sex recession appears to have hit straight young people the hardest.
The sexual activity of bisexual Americans raises an obvious question: is this sex with same-sex or opposite-sex partners? Figure 5 has the answer. While Generation Z is having less sex, it doesn’t appear that the sexual preference of bisexuals has changed much. Both Millennial and Generation Z bisexuals in the 15-23 age range are about 50% more likely to opt for opposite-sex partners rather than same-sex partners. The sharp rise in bisexual orientation for Zoomers doesn’t seem to have affected partner preference.
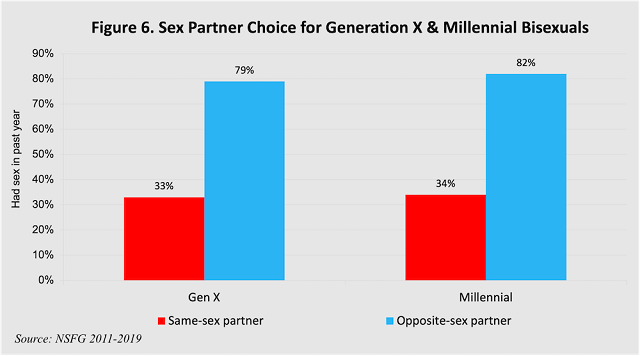
We should also note that youth seems to make having a same-sex partner a little more likely. All the teenagers and young adults depicted by Figure 5 opt for opposite-sex partners about twice as often as same-sex partners. If we look at Generation X and Millennial bisexuals of all ages, they’re more than two and a half times as likely to have opposite-sex partners rather than same-sex partners, and the straight-sex-to-gay-sex ratio was pretty much the same for the two cohorts (Figure 6). In other words, as bisexuals age out of their teens and early 20s, they’re more likely to choose opposite-sex partners. What’s more, the gay-straight partner ratio is virtually identical for Millennials and Generation Xers.
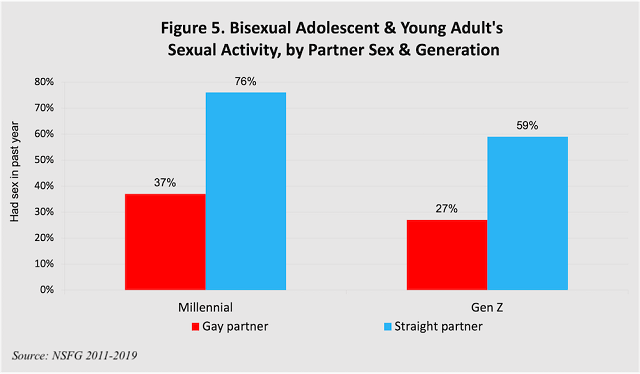
The most startling finding offered by Figure 5 only emerges in conjunction with Figure 4: Zoomer bisexuals are having more straight sex than are straight Zoomers. Fifty-nine percent of Generation Z bisexuals have had a opposite-sex partner in the previous year (Figure 5), compared to 49% of heterosexual Zoomers (Figure 4). Conversely, gay and lesbian Zoomers are more than twice as likely (60% vs. 27%) to have had a same-sex partner than their bisexual peers. Taken together, these data show that the sex recession has been strongest for heterosexual Zoomers, and weakest for their bisexual contemporaries.
What does all of this mean? First, there has been modest growth in the people who identify as gay or lesbian but very high growth in the number of bisexual Americans. Second, the generational sex gap is substantial: Zoomers are having a lot less sex than their counterparts from previous generations. This is especially apparent when we contrast Zoomers with Millennials in the same age range, 15-23 (Figure 3). Third, the period data (Figure 2) and the cohort data (Figures 3 & 4) offer somewhat contradictory findings on whether sexual behavior has changed along with sexual orientation. The annual comparison in Figure 2 suggests that same-sex trysting hasn’t increased alongside LBG identification. Nonetheless, Figure 4 suggests that the only Zoomers whose level of sexual activity hasn’t cratered are gay or lesbian, or, especially, bisexual. Put another way, the sex recession has hit straight Zoomers the hardest. Conversely, bisexual Zoomers are having the most sex—sex that’s no straighter or no gayer than it was for young Millennials. A lot has changed, but one thing that hasn’t is the sexual preferences of young bisexuals.
Social scientists are good at describing the world, but notoriously terrible at predicting the future. With that caveat firmly in hand, I’ll speculate about what these data mean for the future.
In a few words, probably not that much. More Zoomers are identifying as bisexual, but their sexual choices are the same as Millennials of the same age—albeit with less sex overall. Young Millennials and Zoomers opt for straight partners at a better than 2:1 ratio. Older Millennial and Gen X bisexuals choose straight partners at a rate of over 2.5:1. In other words, many bisexuals act straighter as they get older.
Keep in mind that Zoomers are young, no older than 26. The average Zoomer in the NSFG data is just 18 years old, while the average Millennial is 27. A recent study of over 12,000 young people showed that fluidity in sexual orientation was common from adolescents through the late 20s. We’ve already seen that bisexual survey respondents in their mid 20s are already having fewer same-sex encounters than their younger peers. In short, many bisexual Zoomers may continue to identify as bisexual, but behave like heterosexuals in the long run.
In another recent study, Sociologist Arielle Kuperberg and Alicia Walker looked at college students who called themselves straight but had same-sex hookups. The results speak to the trends apparent in the NSFG data. Kuperberg and Walker deemed the majority of these encounters to be experiments, but others were engaged in “performative bisexuality.” Still, others may have been unsure about their sexual orientation but reluctant to come out of the closet.
It’s young people in this last group who probably reflect the small but real increases in the NSFG respondents identifying as gay or lesbian. Small changes in national data are generally more likely to connote durable phenomena. These are folks who might have stayed in the closet in a less supportive era, but now feel more comfortable living openly as gay or lesbian.
And both experimenting and “performative bisexuality” may well characterize some bisexual Zoomers. This seemingly reflects the population of young people who are most interested in sex. Most of this will be straight sex, but about 1 in 4 bisexual Zoomers will have a same-sex partner. Based on the behavior of earlier cohorts, most of these Zoomers will stick with opposite-sex partners as they get older.
In a recent blog post, American Enterprise Institute pollster Daniel Cox offers complementary insights. Cox notes that until Generation X, gays and lesbians outnumbered bisexuals. The explosive growth in the number of bisexuals may reflect something more than just an increase in the number of people who profess a proclivity for both men and women. Instead, posits Cox, “Americans whose sexuality is not something that fits neatly in a check box may find that bisexuality comes closest, even if it’s not completely right.”
The NSFG data don’t allow too much insight into that sexuality, but one thing seems very clear: Zoomer bisexuals are young people who are more interested in sex than their peers, whether it’s gay or straight sex. Why else would bisexuals be having more straight sex than straight people themselves?
And finally, some caveats. The first concerns the measure of sex reported here, sex in the past year. Obviously, this is a snapshot of sexual behavior, not a complete sexual history. It’s limited to actual sex, and therefore excludes episodes of canoodling. Second, the newest NSFG data are now four years old, and sexual behavior appears to have changed since 2020. In particular, the 2022 General Social Survey data indicates a sharp uptick in sex for adults aged 18-29. Third, the nine years of NSFG data presented here truncates both Generation X and, more importantly, Generation Z. The oldest members of Gen X aren’t represented, as are younger Zoomers. Third, the NSFG is a cross-sectional survey. This means I’m making inferences about the future based on past behavior. Panel data would be better, but obviously we won’t know the full story about Zoomers for a while. Finally, I’ve ignored the gendered dimension of the Gen Z bisexual revolution. Women outnumber men 4 to 1 in the ranks of Zoomer bisexuals, a much higher ratio than for earlier generations. This is a topic for a future post.
Nicholas H. Wolfinger is Professor of Family and Consumer Studies and Adjunct Professor of Sociology at the University of Utah. He is the author of Thanks for Nothing: The Economics of Single Motherhood since 1980, coauthored with Matthew McKeever, forthcoming from Oxford University Press.
Editor's Note: The opinions expressed in this article are those of the author and do not necessarily reflect the official policy or views of the Institute for Family Studies.
1. LGBT” is a misnomer for this analysis, as I’ll only be examining the LGB (Lesbian-Gay-Bisexual) portion. Transgender Americans themselves vary in sexual orientation, and cannot be identified with the NSFG data analyzed here.
2. This touches on the age-period-cohort problem, a well-known social science concern when analyzing trend data. I wrote about the APC problem 20 years ago. Since then the field has been revolutionized by the introduction of the intrinsic estimator.
3. The upper age limit of NSFG respondents was increased from 45 to 50 for the two most recent survey waves, fielded between 2015 and 2019. Therefore, there are relatively few respondents in this age group, but that’s largely irrelevant given my focus on younger generations.


