Highlights
- Significant shares of Americans between ages 5 and 25 are taking a medication for ADHD. Post This
- White kids (4.5%) are more likely than black (2.5%) or Hispanic (1.8%) kids to be on ADHD meds. Post This
- 62% of all children ages 2-17 with ADHD are taking stimulant medications like Adderall and Ritalin to treat their symptoms. Post This
By best estimates, there are a lot of children who have been diagnosed with Attention Deficit and Hyperactivity Disorder (ADHD). Between 1997 and 2016, the incidence of ADHD among children almost doubled, from 6.1% to 10.2 percent. As of 2019, 10% of children, including 13% of 12- to 17-year-olds, had ever been diagnosed with ADHD. More controversially, many of these children—62% of all children ages 2-17 with ADHD, e.g.—are taking stimulant medications like Adderall and Ritalin to treat their symptoms.
But who are these kids? And what can we say about their families? The data I review below suggest that medication use for ADHD is common across many groups of people, but that it is consistently more common in some family types than others.
To learn more about the ADHD-medicated population, I identify minors in the 2017-2018 National Health and Nutrition Examination Survey, the most recent available wave of that survey before data collection was interrupted by the Covid pandemic. The NHANES is a biennial survey of the health and nutrition of American adults and children, combining interviews with a physical examination. Among other information, the NHANES collects information on prescription drugs respondents are taking, and for what purpose. In this article, I identify respondents taking drugs for ADHD using this information.
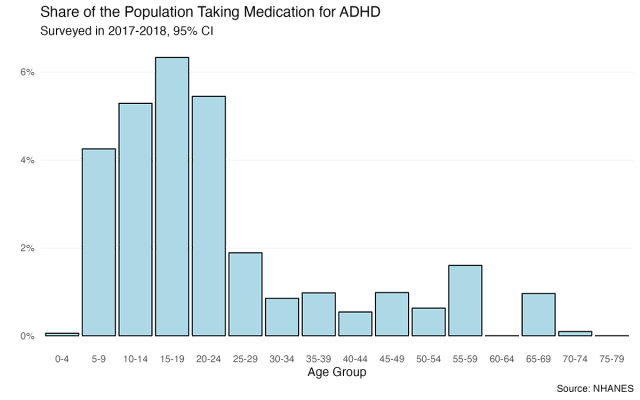
Prescriptions for ADHD have increased dramatically in the United States over the past two decades. The resultant surge in medication use, as the figure above indicates, is concentrated among younger age groups, with significant shares of Americans between ages 5 and 25 prescribed and taking a medication for ADHD. It’s hard to say, without more years of data, whether this is an “age” effect or a “cohort” effect, i.e., whether we should expect young people to age out of taking ADHD medications, or whether they will persist in taking them the rest of their lives.
What characterizes the home lives of these young people, especially the kids? To answer that question, I zoom in on demographic characteristics of respondents under 18 living with at least one other person at home. The NHANES tells us some information about both these kids and their parents.
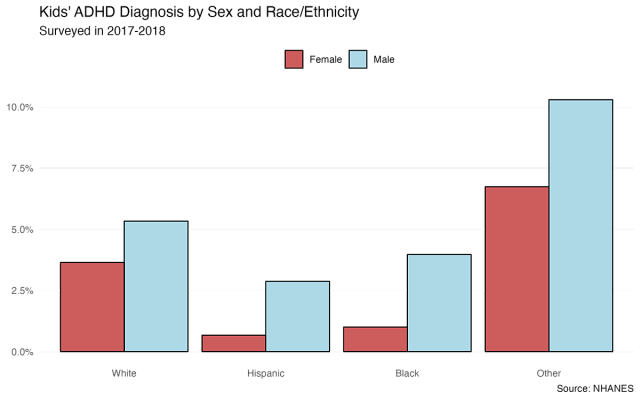
It should be noted that overall, a relatively small fraction of respondents—about 4%—have an ADHD diagnosis. (This rate may be smaller than the population incidence above because it reflects those with a current diagnosis and medicated for it, both of which are a subset of everyone diagnosed.) But within that group, there are some notable patterns. Boys (5.1%) are about twice as likely as girls (2.9%) to take ADHD meds, in line with the relative prevalence of ADHD between sexes. By race, white kids (4.5%) are more likely than black (2.5%) or Hispanic (1.8%) kids to be on ADHD meds; “other” kids have a higher prevalence, at 8.5%, but that estimate has a much less precisely estimated due to the small number in the sample.
What about family structure? ADHD kids have similar family sizes (4.47 people on average) to non-ADHD kids (4.52). The NHANES also provides details on the respondent’s head of household (although it’s unclear how they identify who the head of household is). In households where the head is married—man or woman—about 3.6% of kids have an ADHD diagnosis. By comparison, the figure was 9.1% in households where the household head was a divorced mother, vs. 2% in households with unwed mothers as heads. (There weren’t enough single-male-headed households in the sample to make reliable estimates.) This spread—divorced mothers see a comparatively high rate of ADHD kids, while unwed mothers see a low one—may reflect a real disparity in ADHD diagnoses, but also a disparity in access to medication to treat ADHD.
On the other hand, ADHD diagnoses seem to exist across the socioeconomic spectrum. Breaking respondents up by household income, there is little pattern across the socioeconomic spectrum, with the poorest respondents not distinguishable from the richest ones. A similarly non-linear pattern obtains when looking at head-of-household education levels: 1.5% of respondents whose head of household has less than a high-school education report ADHD medication, compared to 5% of those with a H.S. degree or some college, and 3% of those with a college degree.
The next logical question is how all these variables interact. While there is no way to determine what factors may or may not increase the risk of being diagnosed with ADHD, we can use this data to see which variables remain significantly different between ADHD and non-ADHD prescription households.
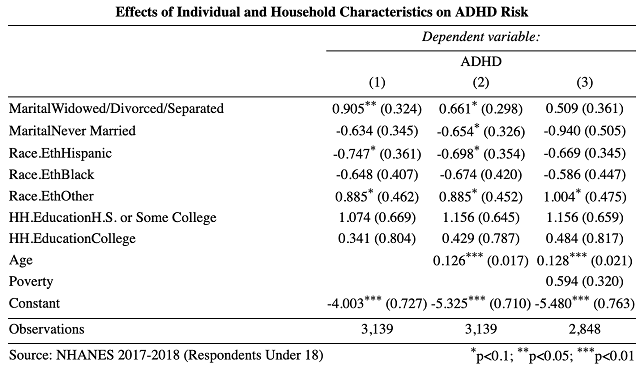
The table above reports results from several regressions to attempt just that. In each model, the variable of interest is whether or not the respondent is medicated for ADHD. The independent variables are measures of household-head marital status, respondent’s race/ethnicity, household head’s level of education, age, and two different measures of income—a binary indicator of if the family is above or below the poverty line (model 3) or if they are above or below $65,000, roughly national median income at the time of the survey (model 4). Because my outcome is dichotomous—either yes or no—I use logistic regression. The coefficients are a little complicated to interpret, but suffice to say that a larger value represents more of an effect.
So which factors hold up in predicting ADHD risk when compared to each other? Interestingly, both race/ethnicity and household-head education level are not, or only marginally, related to ADHD risk. As expected, divorce has a large, risk-increasing, and significant effect on ADHD risk when controlling for ethnic and educational factors. But it becomes smaller and only marginally significant when controlling for respondent’s age and is no longer significant when adding in our poverty measure. Age, in fact, is consistently the strongest predictor, reflecting rising ADHD diagnosis and medication with age. One interpretation is that the observed two-way relationship between divorce and ADHD is mostly a function of age: divorced parents have older kids, and older kids are more likely to be diagnosed with ADHD.
What is most interesting, then, is how few of the variables reliably predict ADHD prescription. It does not, within this limited data, appear concentrated among any particular subgroup. Whether that’s good or bad is a matter of one’s judgement about the negative or positive effects of medicating for ADHD. But it should at least surprise anyone who assumes otherwise.
Charles Fain Lehman is a fellow at the Manhattan Institute and a Contributing Editor of City Journal.