Executive Summary
This report maps the geography of family structure in the United States, identifying areas where married and married-parent households are either highly prevalent or notably scarce. Using newly-constructed maps and rankings based on 2020 Census data, we introduce two related concepts—marriage deserts and married-family deserts—to describe places where stable, married-family life is uncommon, alongside their counterparts, marriage gardens and married-family gardens, where it is most prevalent.
The analysis is motivated by a large body of research showing that family structure is closely associated with economic mobility and broader measures of social capital. As other research has found, the share of children growing up in two-parent households is one of the strongest predictors of upward mobility within a community. Yet this aspect of social life is not evenly distributed across the United States. This report and its corresponding maps seek to visualize these differences, mapping America’s family divide.
To do so, we examine two measures at the level of Public Use Microdata Areas (PUMAs), geographic units that generally contain 100,000 to 200,000 individuals each. First, we measure the share of householders ages 15–64 who are married. Second, we measure the share of households with children that are headed by married couples.
This report also serves as a complement to our Get Married Maps, which illustrate parts of the country with particularly high or low marriage rates. While the Get Married Maps will be of most use to those looking to find a spouse, the maps in this report can help newlyweds determine which areas have particularly large shares of other married couples—and, thus, potentially stronger communities and support networks.
Key Findings
1. Marriage is far more common in certain parts of the United States than in others.
Higher marriage rates tend to be found in suburban regions, whereas lower marriage rates are often found in the center of major cities.
Here is a look at the top- and bottom-10 PUMAs by marriage share. In the nation’s top marriage deserts, the share of householders ages 15–64 who are married is between approximately 13% and 17%.
2. The percentage of households with children that are led by a married couple tends to be higher in more affluent, suburban regions, but lower in urban centers and parts of the Southeastern US.
As the following tables show, in the top married-family deserts, only around 18% to 26% of households with children are headed by married couples. Meanwhile, in the top married-family gardens, the corresponding figure rises to approximately 86% to 89 percent.
3. The largest grouped marriage desert in the US, with over 686,000 householders between 15 and 64, is found in Lower Manhattan and Brooklyn.
Meanwhile, the largest grouped marriage garden, with over 630,000 householders in this same age range, is located in the Dallas-Fort Worth suburbs, identified by grouping together contiguous PUMA-level marriage deserts and marriage gardens.
4. The largest grouped married-family desert, with around 178,000 households with children, is located in Manhattan and the Bronx.
It is located relatively close to the largest grouped married-family garden, which spans from the suburbs of DC to those of Philadelphia and includes around 386,000 households with children.
Introduction
Neighborhood family structures—whether experienced in apartments, public schools, or the local store—inform each other with a complex set of norms. As shown in research by Harvard economist Raj Chetty, “the most predictive factor of upward mobility in a community was the share of homes with two parents present in the household.
And yet, there is a sharp divide in the experience of family across the United States dependent upon income. As IFS Senior Fellow Brad Wilcox and report author Chris Bullivant wrote in a previous paper, higher levels of marriage and stability are prevalent among high-income families. Conversely, lower levels of marriage and stability are prevalent among low-income families.
This “social capital divide” is of concern because, across multiple metrics, children growing up in stable-married families have better life outcomes than their counterparts who grow up in less-stable cohabiting or single-parent households.
So the predictive—though certainly not deterministic—quality of the share of homes with two parents present in the household begs the question: where are these neighborhoods located? And where are they not located? This question matters because if we can see where they are, it may be easier to bridge the social-capital divide to create equal access to stable, married-family life and the relational security it confers.
Importantly, this report does not seek to establish causal relationships between marriage rates, family structure, and economic or social outcomes. Nor does it attempt to explain why these patterns have emerged. Instead, it provides a descriptive foundation: a way of identifying where different family-structure environments exist, and how they vary in scale and intensity across the country. The maps and tables are offered as tools for further research, analysis, and discussion.
The variety of family formation patterns visualized in this way across the United States is descriptive. It attempts to capture in a “freeze frame” picture an enormously complicated and dynamic pattern of interconnected institutions and relationships. As with all big data projects it comes with a health advisory, that large-form data is never particularly sensitive to an individual’s story. And yet, at the perspective these maps do provide, there are clearly some communities, where stable, married family structures remain the dominant social norm; in others, they are comparatively rare.
The stark differences between community experience suggest that the “social-capital divide” in the United States is not only economic but also relational, embedded in the everyday environments in which individuals form relationships and raise children.
Marriage Deserts
This work was inspired by the Opportunity Atlas published by Opportunity Insights—in particular, their upward mobility maps, which include the share of people who are married by age 30. Their maps reveal a patchwork quality to marriage rates at a census tract level. Bullivant described the low marriage rates neighborhoods in these maps as “marriage deserts” in an article with Brad Wilcox. Just as it is harder to buy healthier groceries in a “food desert,” it is likely more difficult to enter into stable married families in a “marriage desert.” This is simply where relationships styles are learned in the context of existing relationships.
Motivated by the Opportunity Insights maps, we wanted to create our own, humbler, family-focused versions that focused on two measures:
- The share of householders aged 15-64 who are married.
- A sense of the share of households with children that are stable, two-parent homes. (In this case, we use married couples as a proxy.)
What This Report Does Not Do
Beyond listing and describing areas with a particularly low and high prevalence of married and married-family households, we offer minimal analysis as to causes.
It is also beyond the scope of our research to establish a causal relationship between low rates of marriage and low rates of married families, or their converse, high rates of marriage and high rates of married families. While the connection may seem obvious, there are areas where higher rates of marriage do not correlate with higher rates of married families, and there are areas where low marriage rates correlate with higher shares of married families.
However, these maps are presented with the knowledge that areas of low marriage and weak family stability are more prone to less upward social mobility. And we hope that these are a useful tool for inspiring further research and analysis.
Marriage Deserts and Marriage Gardens
In this report, marriage deserts are defined as PUMAs in which the share of householders ages 15 to 64 who are married falls below 33% (the rounded 10th percentile for this metric), representing the lowest-observed marriage rates nationally. Meanwhile, marriage gardens are defined as PUMAs in which the share of householders ages 15 to 64 who are married is at least 61%, representing the highest-observed marriage shares nationally. (See the Executive Summary for a nationwide map that shows which PUMAs are either deserts or gardens, and which PUMAs fall in between.)
Marriage Deserts
The table below ranks the 10 PUMAs with the lowest shares of married householders ages 15–64. Across these areas, the married share of householders ranges from 13% to 17 percent. This implies that more than 80% of householders ages 15–64 in these PUMAs are not married.
These marriage deserts are located in 10 major U.S. metropolitan areas across seven states—Georgia, Illinois, Massachusetts, Michigan, Missouri, Ohio, and Wisconsin—as well as the District of Columbia. Ohio appears three times in the top 10, making it the only state represented more than once. All 10 PUMAs are located east of the Rocky Mountains.
Marriage Gardens
The table below ranks the 10 PUMAs with the highest shares of married householders ages 15–64. Across these areas, the married share of householders ranges from 74 to 79 percent. This implies that around 3 in 4 householders ages 15–64 in these PUMAs are married, roughly the inverse of the pattern observed in the nation’s largest marriage deserts.
These marriage gardens are located across six states—Connecticut, Florida, New Jersey, Tennessee, Texas, and Utah. Texas appears three times in the top 10, while Utah and New Jersey each appear twice. They tend to be located in suburban areas, unlike marriage deserts, which are more commonly found in the middle of cities.
Observable Differences
Family Structure Polarization
The differences between the Top 10 marriage deserts and the Top 10 marriage gardens are stark, with a 60+ percentage-point spread between these two extremes:
- Marriage deserts: 13%–17% married
- Marriage gardens: 74%–79% married
Even the marriage desert in tenth place, Chicago (17%) has less than one-quarter the marriage share of the 10th-ranked marriage garden in Thompson Station Town/Fairview, (74%). This does not appear to describe small variations around shared national norms, but rather two distinct family-formation regimes, so stark it could even be described as family structure polarization.
No state appears on both top 10 lists. This suggests an element of geographic polarization in family structure at the extremes. At the same time, this comparison should not be overinterpreted: a broader review of national maps shows that it is common for states to contain both marriage deserts and marriage gardens, often in close geographic proximity. The polarization observed here reflects the most extreme cases, not complete state-level segregation.
Ohio stands out as a negative outlier. Three Ohio PUMAs—Cleveland, Columbus, and Cincinnati—appear among the top 10 marriage deserts, while none appear among the top 10 marriage gardens. In the full national distribution, Ohio contains seven marriage gardens, with the largest—Delaware County (South), Ohio—ranking 41st nationally. Further research examining changes in marriage shares over time may help clarify whether Ohio’s pattern reflects long-term post-industrial family decline distinct from the experiences of coastal, urbanized areas. Ohio stands in contrast to Texas, which features three marriage gardens in the top 10, while not appearing in our list of the top 10 marriage deserts.
Implications for Children
What do these patterns imply for children? While the analysis above focuses on the share of householders who are married, the underlying motivation is to understand how local family structure shapes the social capital environments in which children are raised. A substantial body of research indicates that children’s life outcomes are strongly influenced by relational stability within the family of origin, as well as by the prevalence of married-couple households in their surrounding community.
The top 10 married-family deserts and top 10 married-family gardens are therefore identified using the share of households with children of their own that are headed by married couples. This is with a view to considering a child’s relational security—the degree of stability, continuity, and reliability in the family and community relationships that surround them.
The Executive Summary contains a map that shows which parts of the country fall into each married-family category.
Married-Family Deserts and Married-Family Gardens
In this analysis, married-family deserts are defined as PUMAs in which the share of households with children that are headed by a married couple falls below 52 percent. In these areas, children are less likely to be raised in a household headed by married parents and less likely to be surrounded by peers growing up in married-couple families—conditions associated with lower levels of relational security at both the household and neighborhood level.
Married-Family Deserts
The table below ranks the 10 PUMAs with the lowest shares of households with children headed by a married couple. Across these areas, the share of households with children headed by a married couple ranges from 18% to 26 percent. In all 10 of these married-family deserts, fewer than 1 in 3 households with children are headed by a married couple.
Married-Family Gardens
In this analysis, married-family gardens are defined as PUMAs in which the share of households with children that are headed by a married couple is at least 79 percent. In these areas, children are most likely to be raised in households headed by married parents and to be surrounded by peers growing up in married-couple families—conditions associated with higher levels of relational security at both the household and neighborhood level.
The next table ranks the 10 PUMAs with the highest shares of households with children headed by a married couple, among PUMAs with substantial numbers of households with children. Across these areas, the share of households with children headed by a married couple ranges from 87% to 89%. In all 10 married-family gardens, fewer than 1 in 7 households with children are not headed by a married couple.
Put differently, in these PUMAs, households with kids are roughly 6 to 8 times more likely to be headed by married parents than to be headed by single or unmarried parents.
These 10 married-family gardens are located primarily in the suburban and exurban communities of major U.S. metropolitan areas across seven states—California, Connecticut, Illinois, Massachusetts, New Jersey, Texas, and Utah. California, New Jersey, and Utah each contain two married-family gardens in the top 10.
A Stark Social Capital Divide
The differences between the Top 10 married-family deserts and the Top 10 married-family gardens are stark, with a difference of roughly 70 percentage points between the extremes.
- Lowest married-family desert: 18% of households with kids headed by a married couple
- Highest married-family garden: 89% of households with kids headed by a married couple
Married-couple households constitute a supermajority of families with children in the top 10 married-family gardens (>86%), but only a small minority in the top 10 married-family deserts (<26%). As with the marriage deserts/gardens, this comparison between married-family deserts and gardens demonstrates not just a variance around shared national norms, but a structural divergence in family structures. Over the course of childhood, these differences imply substantially different levels of exposure to married-couple households in children’s everyday social environments.
This represents a significant discrepancy in lived experience for children growing up in these distinct environments. Those in married-family gardens grow up with married parents, in neighborhoods, schools, and after-school activities where most peers experience the same. These children will be observing marriage as a stable, ordinary feature of adult life. This will create stronger social capital networks, with a greater alignment between school, families, and community, overlapping stable inter-family interactions over a childhood and adolescence, creating denser networks of adult supervision, stable peer networks, and deep relational literacy.
By contrast, for children in married-family deserts, there is likely to be much greater churn in adult relationship stability, and greater inconsistency in supervision, where marriage and stable relationship bonds are atypical or distant from everyday norms—both for these children and their peers. Greater intergenerational kinship, such as grandparent care, and demand on public resources, such as schools, may seek to compensate for this gap; however, it is likely that children in married-family deserts will still experience less social capital and relational literacy, than those in married-family gardens.
Households With Children
The previous analysis focuses on the share of households with children that are headed by married couples. An additional question is whether places with different family structures also differ in the overall prevalence of households with children. In other words, do married-family deserts and married-family gardens differ not only in how children are raised, but in how common it is for households to include children at all?
A clear pattern emerges when comparing the top 10 married-family deserts with the top 10 married-family gardens. PUMAs with markedly different family structures also differ substantially in the share of households that include children.
Among the top 10 married-family deserts, the share of households with children ranges from a low of 15% in a Detroit PUMA to a high of 26% in a western-Chicago PUMA. In contrast, among the top 10 married-family gardens, the share of households with children ranges from 34% in Illinois’s Northfield & New Trier Townships, to 57% in a western Utah-County PUMA.
On average, households with children account for 21% of all households in the top 10 married-family deserts, compared with 44% in the top 10 married-family gardens. In practical terms, the share of households with children is approximately twice as high in the top married-family gardens as in the top married-family deserts.
This pattern is consistent with prior research showing that fertility in the United States is increasingly concentrated among married households and those with greater economic stability. Research by IFS Senior Fellow Lyman Stone, for example, finds that recent declines in fertility have been driven disproportionately by lower birth rates among the unmarried and among lower-income populations. While the present analysis does not establish causality, the association between married-family structure and higher concentrations of households with children suggests that family norms and household formation are closely intertwined with contemporary fertility patterns.
Married-family deserts appear, on this evidence, to function increasingly as adult-oriented or post-family spaces, while married-family gardens appear to be environments that are more conducive to having and raising children. For children growing up in married-family deserts, this means not only being raised within a context of greater relational instability but also living in environments where having children in the household is itself less common. Parenting, as well as marriage, is therefore less frequently observed as a dominant adult role within the community.
These differences have implications for schools, housing markets, tax bases, welfare systems, local politics, and the balance between services oriented toward children and those oriented toward older populations. Over time, environments with fewer children may also face challenges in sustaining the institutions and informal networks that support family life.
At the same time, these results should be interpreted with caution. When we examine all PUMAs in our dataset, we find a weaker relationship between married-family shares and the percentage of all households with children. In fact, our marriage metric (i.e. the percentage of householders ages 15-64 who are married) is a better, though still imperfect, predictor of the percentage of households with children. In short, while we do see an association between higher married-family rates and higher child prevalence, additional factors—particularly housing availability, affordability, and local institutional capacity—are likely to shape how strongly marriage translates into higher fertility in different places.
Grouped PUMAS
The preceding analysis listed the top marriage deserts and marriage gardens at the level of individual PUMAs. This is useful for identifying the most extreme examples, but it only provides a partial picture. A cursory review of the maps shows that many marriage deserts and marriage gardens are located next to one another and thus form larger clusters of areas with similar family-structure characteristics.
In the next set of analyses, we consider the same four features (marriage deserts, marriage gardens, married-family deserts, and married-family gardens) but examine them using grouped PUMAs rather than individual units. These groupings are formed by adjacent PUMAs that meet the same criteria.
Grouped marriage gardens and deserts are ranked by the total number of householders ages 15-64 that they contain, and grouped married-family gardens and deserts are ranked by the total number of households with children that they contain. (This approach diverges from our individual-PUMA rankings, which were based on percentages rather than populations.)
The map below visualizes the top 10 grouped marriage deserts and gardens; following it is a map of the top 10 grouped married-family deserts and gardens. (Because grouped deserts are often located in densely populated urban areas, they are often harder to make out than grouped gardens.)
Top 10 Grouped Marriage Deserts
The table below ranks the largest grouped marriage deserts by the total number of householders ages 15–64 (regardless of marital status) who live within contiguous PUMAs that meet the marriage-desert criteria. In these groupings, the minimum and maximum marriage shares reflect variation across adjoining neighborhoods within the same grouped region rather than isolated extremes.
Across these areas, the married share of householders ranges from 14% to 33 percent. This means that over two-thirds of householders ages 15–64 in each of these grouped PUMAs are not married.
This list pulls in new cities and new states, primarily because it draws in America’s largest cities, and with a higher maximum share than in the individual list. By contrast to the individual list, we now see we are researching a large phenomenon, with—in the case of the largest grouped marriage desert in New York—a total of 686,520 households.
These marriage deserts are located in major U.S. metropolitan areas across 11 states (California, Georgia, Illinois, Indiana, Massachusetts, Maryland, New Jersey, New York, Ohio, Pennsylvania, and Texas) and the District of Columbia.
New York has two of the largest deserts, in Manhattan and Queens, sharing a total of over 1.2 million householders in PUMAs with low shares of married individuals. California and Texas also join the Top 10, which means that grouped marriage deserts are present on both sides of the Rockies. California's grouped desert, which stretches from central Los Angeles to Santa Monica, is the fourth largest in the country.
What these top 10 grouped marriage deserts show, and not least among the 1.2 million households in New York, is that low marriage rates are not necessarily restricted to extreme examples. For extensive geographies or commuter distances, low marriage rates are broadly normalized. Given New York’s unique importance in American cultural, media, and corporate leadership, it is worth noting that the context in which significant numbers of participants in the region work does not appear to promote shared norms around stable, married family life. While it is likely that executives and leaders in these industries live in the adjacent marriage gardens and married-family gardens, there is a clear divide between the family-haves and the family-have-nots that likely mirrors other forms of inequality in the region.
Top 10 Grouped Marriage Gardens
In this report, marriage gardens are defined as PUMAs in which the share of householders ages 15 to 64 who are married is at or above 61%, representing the highest observed marriage rates nationally.
The table below shows the 10 largest grouped marriage gardens. Across these areas, the married share of householders at the PUMA level ranges from 61% to 78 percent. At a minimum, this implies that 3 out of 5 householders in these PUMAs are married, and in several parts of these grouped PUMAs, over three-quarters are married.
These marriage gardens are located in major metropolitan areas across 13 states—California, Connecticut, Illinois, Maryland, Massachusetts, Minnesota, New Hampshire, New Jersey, New York, Pennsylvania, Texas, Virginia, and Utah.
The Suburban Dallas-Fort Worth marriage garden is the largest grouped marriage garden in the country. At 636,086 householders ages 15-64, it is around 7% smaller than the largest grouped marriage desert in the previous table.
Connecticut, Texas, Utah, and New Jersey are represented in both the top 10 grouped marriage gardens and the top 10 individual-PUMA marriage gardens. This suggests that marriage gardens in these states combine high marriage rates with breadth across multiple neighborhoods, indicating depth as well as scale in their marriage ecosystems. New states appearing in the grouped marriage gardens include California, Illinois, Maryland, Minnesota, New York, New Hampshire, and Pennsylvania.
Notably, there are seven states that not only appear in the top 10 grouped marriage gardens but also feature in the top 10 grouped marriage deserts: California, Illinois, New York, New Jersey, Maryland, Massachusetts, and Pennsylvania. In many cases, the grouped deserts are located within the urban core of a given metropolitan region, whereas the grouped gardens are in suburban parts of that same region. Indeed, the geography of marriage gardens is overwhelmingly suburban and exurban in character, standing in clear contrast to the urban-core concentration observed among marriage deserts.
Top 10 Grouped Married-Family Deserts
In this analysis, married-family deserts are defined as PUMAs in which the share of households with children that are headed by a married couple falls below 52 percent. In these areas, children are less likely to be raised in households headed by married parents and less likely to be surrounded by peers growing up in married-couple families—conditions associated with lower levels of relational security at both the household and neighborhood level.
The table below ranks the 10 grouped PUMAs with the lowest shares of households with children headed by a married couple, where groupings consist of contiguous PUMAs that meet the married-family desert criteria. Across these grouped married-family deserts, the PUMA-level share of households with children headed by a married couple ranges from 18% to 52%.
These 10 grouped married-family deserts are located in eight major U.S. metropolitan areas across 10 states—California, Georgia, Illinois, Indiana, Maryland, Michigan, New York, New Jersey, Ohio, and Pennsylvania—and a significant married-family desert that includes parts of the Mississippi Delta in Louisiana, Mississippi, Arkansas, and Tennessee.
America’s largest grouped married-family desert is located in the Bronx and Manhattan, with 178,144 households with children. New York is also home to the seventh-largest grouped married-family desert, which is located in Brooklyn. Combined, New York’s two married-family deserts hold over 250,000 households with children who are living in married-family deserts.
A significant member of this top 10 list is the Mississippi Delta, which ranks second. In fact, 155,492 households with children across a large, contiguous, mostly-rural geography fall within this married-family desert, where the share of households with children headed by a married couple ranges from 27% to 52 percent. Notably, this married-family desert does not coincide with one of the largest grouped marriage deserts. However, a review of the maps shows that it overlaps with contiguous PUMAs in which overall marriage rates are below the national average. This alignment suggests that married-family deserts may emerge in regions where marriage prevalence is already depressed, even if those areas have not yet reached the lowest national marriage shares.
Finally, four metropolitan areas—Atlanta, Cleveland, Chicago and Detroit—appear in both the individual and grouped Top 10 married-family desert tables. This suggests a prevalence and persistence in both depth and scale of lower shares of households with children headed by married couples in these cities.
Top 10 Grouped Married-Family Gardens
In this analysis, married-family gardens are defined as PUMAs in which the share of households with children that are headed by a married couple is at or above 79%. In these areas, children are more likely to be raised in households headed by married parents and to be surrounded by peers growing up in married-couple families—conditions associated with higher levels of relational security at both the household and neighborhood level.
The 10 grouped married-family gardens that contain the largest number of households with children are shown in the following table. Across these grouped married-family gardens, the share of households with children headed by a married couple ranges from 79% to 89 percent.
These grouped married-family gardens are located in 10 mostly suburban and exurban regions across the District of Columbia and 12 states—California, Connecticut, Illinois, Maryland, Massachusetts, New Jersey, New York, Pennsylvania, Utah, Texas, Virginia, and Washington. This is the first part of our findings in which the state of Washington appears within a top 10 ranking.
Key Differences in the Grouped Married-Family Deserts and Gardens
Geographically, the grouped married-family gardens—like the individual Top 10 married-family gardens—are generally concentrated in suburban and exurban areas rather than central metropolitan cores. Many are located in high-income regions with limited housing availability, such as the San Francisco Bay Area and Northern Virginia. These characteristics are consistent with patterns of residential sorting and may help explain the relatively narrow range between minimum and maximum married-family shares observed within grouped gardens.
It is also notable that several of the largest grouped married-family gardens are located in regions that are economically affluent and institutionally influential, including Northern Virginia, the Bay Area, and parts of Connecticut. In the New York area, two large married-family deserts (encompassing parts of the Bronx, Manhattan, and Brooklyn) are near married-family gardens in New Jersey and Long Island. This juxtaposition highlights the degree to which sharply different family-structure environments can exist in close geographic proximity within the same broader labor and housing markets.
Six states (California, Illinois, Maryland, New York, New Jersey and Pennsylvania) are each home to top 10 grouped married-family gardens and grouped married-family deserts. This in part reflects that these are populous states, but it also means that, even within state lines, there is a huge discrepancy in childhood experience. These states are also located within our lists of the top 10 grouped marriage deserts and gardens, making them arguably the most divided states in America for family experience.
Four Features Beyond the Top 10s
So far, we have reviewed the top 10 individual and grouped deserts and gardens for our percent married and married-family metrics. In this section, we want to briefly outline some observable features of the entire map, which point to interesting opportunities for future research.
1. Double Deserts
Marriage deserts and married-family deserts in the same geography
Chicago. Certain areas constitute both marriage deserts and married-family deserts. Within these areas, there is both a low share of householders who are married and a low share of households with children headed by married families. We see this, for example, in parts of Atlanta, Baltimore, Chicago, Cleveland, Detroit, Los Angeles, Newark, New York, Philadelphia, and Washington D.C., among other cities.
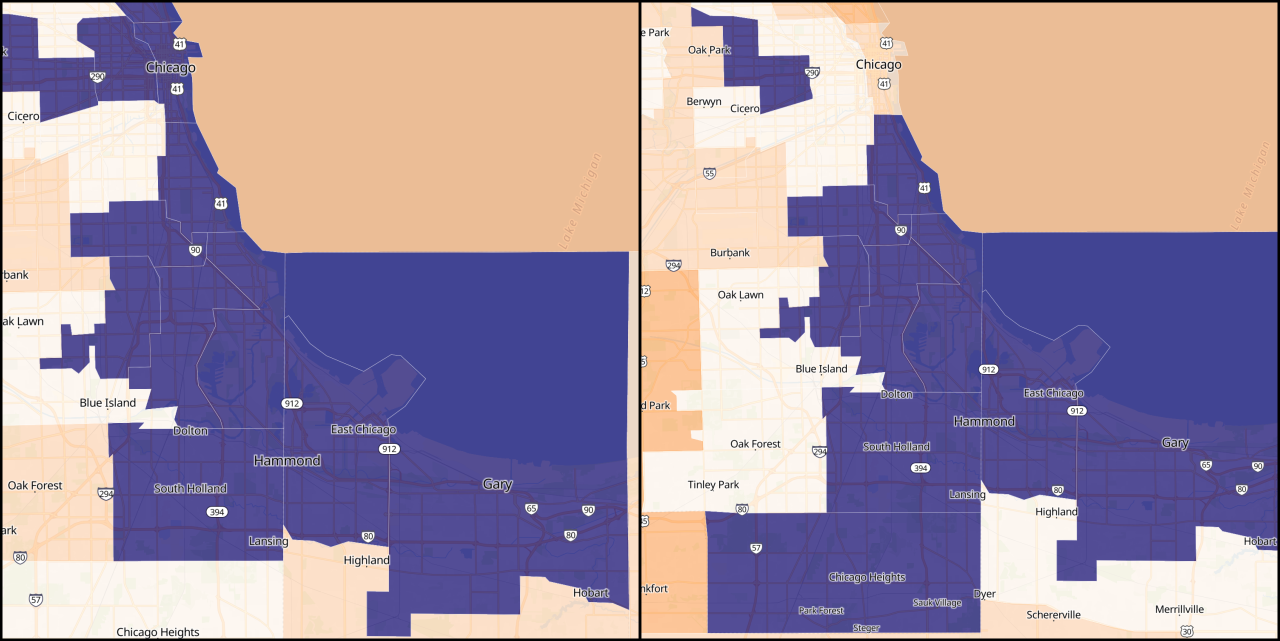
In this figure, we can see there are some PUMAs that are both marriage deserts and married-family deserts. We have termed these areas double deserts.
Further research is needed to see if householders in these areas experience a persistent difficulty in entering into marriage and stable family life, and whether a lack of role models of stable, family life reproduces itself, limiting people’s lifestyle choices.
2. Delayed-Marriage Deserts
Marriage deserts give way to married-family gardens once children are in the picture
Manhattan and Brooklyn. There are some marriage deserts with significant, low rates of marriage. However, in the same geography, the share of householders with children who are married is relatively high. In other words, marriage deserts do not equal married-family deserts. Such areas include college towns, for example.
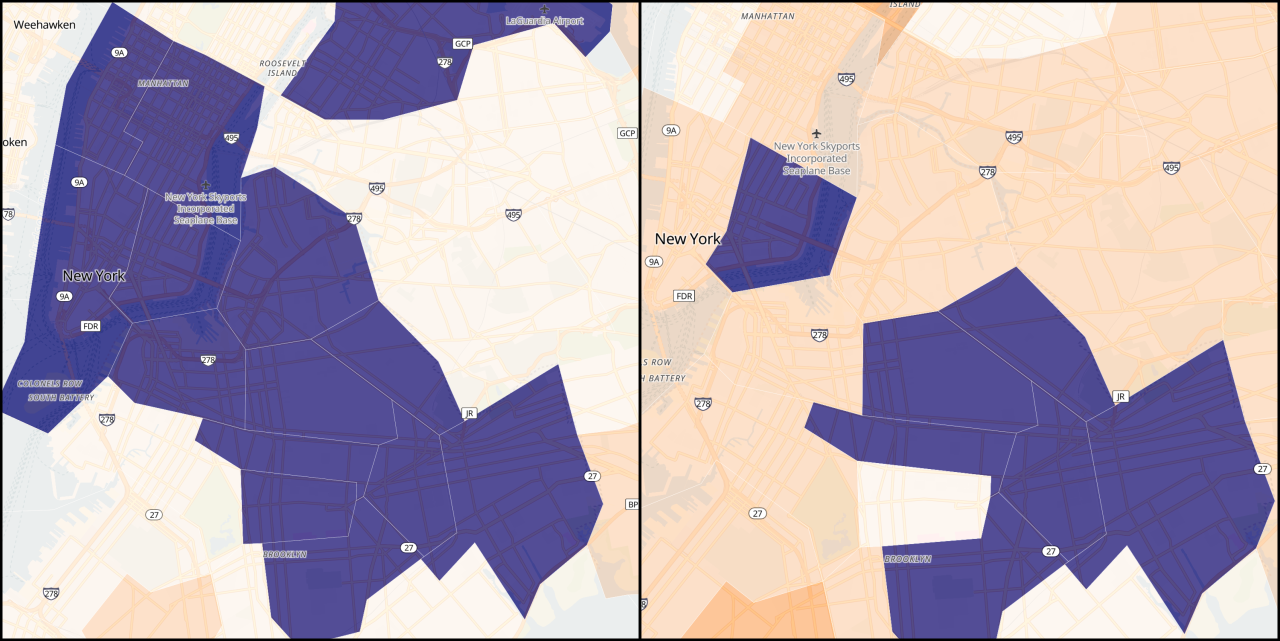
But these areas also appear in those economically active zones that attract young people from across the country, such as certain neighborhoods within Washington D.C., Los Angeles, and New York. Once we compare these marriage deserts with the share of households with children headed by a married couple, we see the deserts quickly give way to regions with higher shares of married families.
In the figures above, we can see that while certain PUMAs are both marriage deserts and married-family deserts, other PUMAs are both marriage deserts and areas with higher shares of married families. We have termed these areas delayed-marriage deserts, though this hypothesis requires additional research.
It is possible that, in these areas, young people remain single longer but ultimately get married prior to having children, provided that they remain in the area. This may be in defiance of surrounding communities that remain double deserts. If this is occurring, it could suggest that, when young people come to an area that has low marriage and low married-family rates as part of inward work migration, they bring high levels of social capital and relational literacy with them and replicate the norms they grew up with elsewhere. This interpretation is speculative and intended as a prompt for further research, rather than a conclusion.
3. Desert Corridors
Lower-share marriage regions combined with large married-family deserts
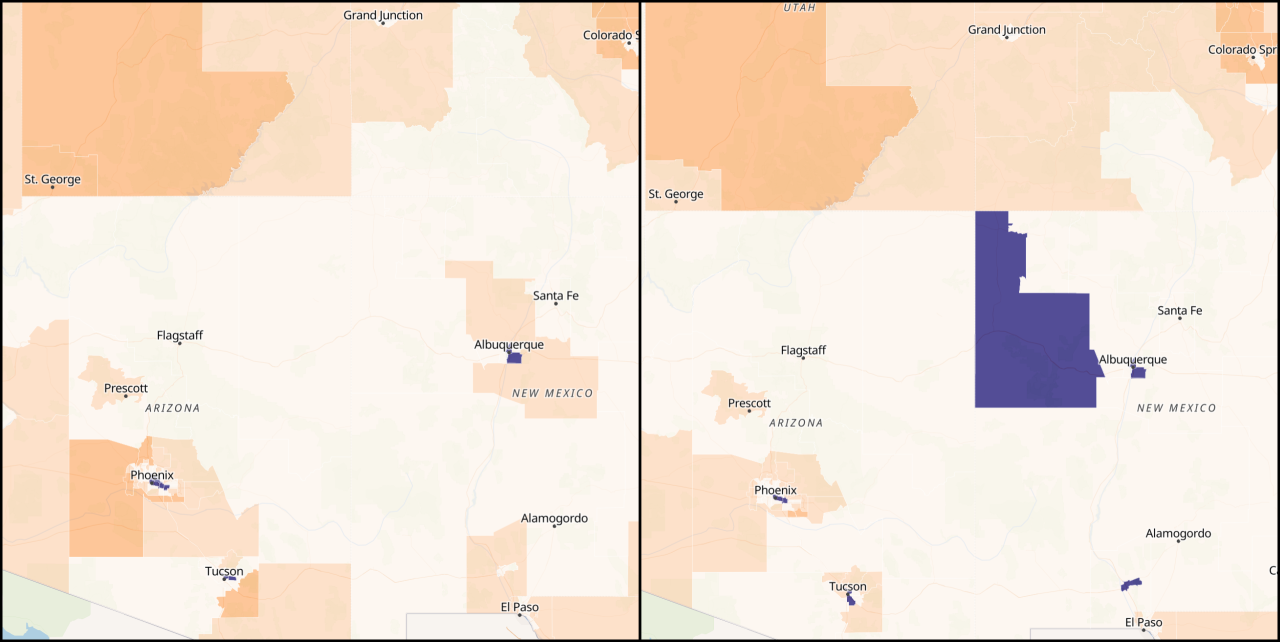
The Mississippi Delta. Several large, contiguous regions within the US have lower (but not desert-level) shares of adults ages 15-64 who are married, together with desert-level married-family rates. Low marriage rates appear to be associated with married-family deserts. This is in contrast to the delayed marriage deserts discussed earlier, where lower marriage rates coexist with higher married-family rates.
We see these desert corridors in parts of the Mississippi Delta and New Mexico.
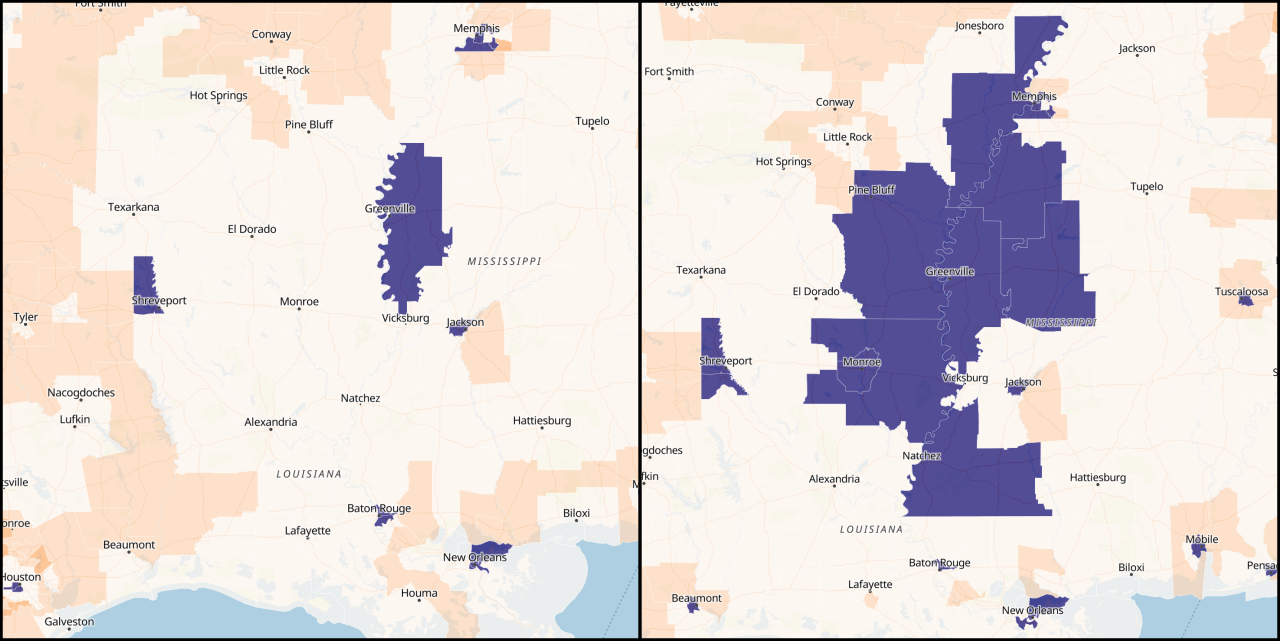
The Mississippi Delta is home to America’s second-largest married-family desert. In this side-by-side comparison with its corresponding share of householders ages 15-64 who are married, we can see that these married-family deserts exist in the context of a large area where marriage rates are lower than normal.
Further research could investigate whether low marriage rates cause low married family rates and whether this share is growing across generations. If a given generation of children lacks exposure to married parents (except, perhaps, on TV), it is plausible that, upon entering adulthood, such children may reproduce the relationship patterns they experienced growing up. This would, in turn, reduce the share of householders ages 15-64 who are married. This may well put downward pressure on fertility rates and result in fewer children, but the share of children in married-family deserts would likely increase. These desert corridors, therefore, are vulnerable to becoming double deserts in the coming decades. In this desert growth, we perhaps witness in these corridors the growth of tomorrow’s double deserts.
New Mexico. In the Southwest, we see that New Mexico has lower-share marriage rates and several married-family deserts. The married-family deserts encompass both Native American reservations and more urban areas.
4. Inverse Desert Corridors—Rural America
High marriage prevalence but low married-family shares
An inverse pattern appears to be the case in rural areas of the United States and in particular central Appalachia. In these PUMAs, we see above-average marriage rates among householders ages 15-64. However, when we look at the share of households with children that are headed by married couples, we see that these same areas have lower shares of married families.
This is the inverse of what we see in the Mississippi Delta, where low rates of marriage are coterminous with low rates of married families.
Further research is required to understand this pattern conclusively and in what direction it is traveling. One possibility is that older adults in these regions generally chose to get married, but their adult children are having children without first getting married.
Central Appalachia. The area between West Virginia and Kentucky contains large areas with higher-share marriage rates but lower-share married-family rates. This, for example, is a pattern visible in both central California and rural Nevada.
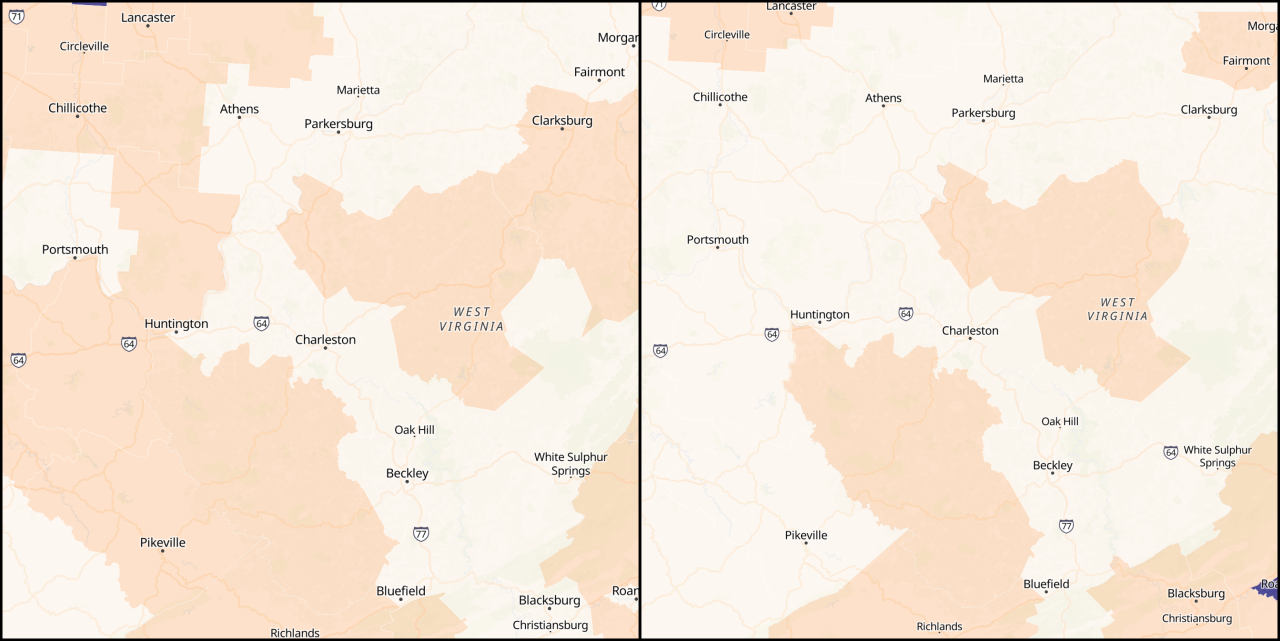
What this area possibly shows is that even if individuals have access to marriage role models (i.e. parents or grandparents), they will not necessarily be married themselves when they have children. Again, further research is required to understand the nature of this pattern. If, however, role models are important to establishing pathways to stable, married family life and the relational security and social capital that creates, then a reversal of trends may be easier to accomplish in central Appalachia—and regions like it—than in those areas where marriage is less of a norm.
Conclusion
This report has identified PUMAs where marriage rates and married-family rates are especially high or low. It has also shown which clusters of married-family and marriage deserts and gardens have a particularly large population.
As shown in our maps, marriage deserts are present across the United States. They cluster in specific neighborhoods and, in some cases, extend across large metropolitan regions. At the individual PUMA level, some of the lowest marriage shares appear in parts of cities such as Cleveland, Milwaukee, St. Louis, and Washington, D.C. When grouped, marriage deserts encompass far larger populations: the top three grouped deserts, which include parts of New York City and Chicago, each span over 500,000 households.
The analysis also shows that marriage deserts and married-family deserts frequently overlap, though not uniformly. In cities such as Chicago, Philadelphia, Baltimore, Los Angeles, and Newark, some neighborhoods experience both low marriage among adults and low shares of households with children headed by married couples. In other areas—such as parts of New York City and Washington, D.C.—lower marriage shares give way to stronger married-family patterns once children are present, suggesting delayed or selective marriage rather than a complete absence of married family life.
By contrast, married-family gardens—both individual and grouped—are most often found in suburban and exurban areas, including parts of Northern Virginia, the Bay Area, Connecticut, Utah, and New Jersey. In these gardens, roughly 80% to nearly 90% of households with children are headed by married parents. We also found that the largest married-family gardens have higher numbers of households with children, on average, than do the largest deserts. In addition, the individual PUMAs with the highest married-family percentages have higher shares of households with children than do those PUMAs with the lowest percentages.
Mapping these patterns provides a foundation for further research into how marriage deserts and married-family deserts evolve over time and what they mean for families, children, and communities across the country.
Editor's Note: For methodology, acknowledgements, and author information, please download the full report below.
The map screenshots in the "Four Features Beyond the Top 10s" section and the Appendix show Open Street Map data, which is available under the Open Database License. For more information, visit https://www.openstreetmap.org/copyright.