Highlights
- Young adults in America, all told, are a happy bunch. Post This
- By far the largest predictor of happiness is marriage. Marriage almost doubles the chances of identifying oneself as “very happy,” from 21% to 40% Post This
- Attending religious services several or more times a month increases the odds of being very happy by 9%. Post This
Maybe you’re feeling just a little less happy than you used to be? Not a huge change, not sad or anything, but less joyful compared to the old days?
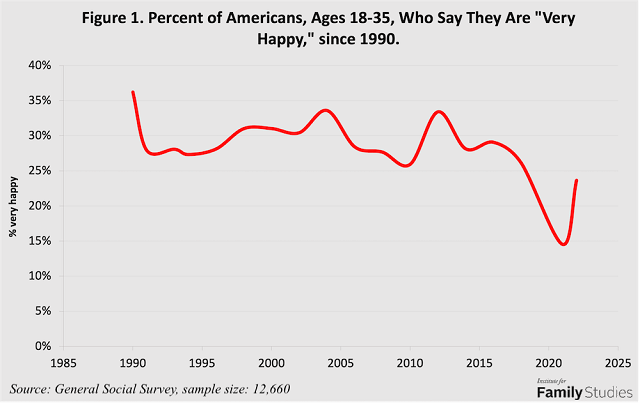
This is the story of happiness for young adults over the past few decades. In 1990, the Berlin Wall had just fallen, a well-liked moderate, Republican George H.W. Bush, occupied the White House, and the economy had been expanding for nearly a decade. That year, 36% of Americans aged 18-35 reported being very happy. It would never happen again. Later that year the economy slipped into recession, and by 1991 only 28% of young adults said they were very happy. For almost three decades happiness hovered around 30%. Following the COVID pandemic, happiness fell to an all-time low of 15% in 2021. By the next year, it had rebounded to 24%, a big improvement but still a few points off the long-term trend.

Once-in-a-century pandemics aside, happiness has been pretty stable and rebounded quickly after shocks like the 2008 financial crisis. Its stability is remarkable given how many things in America have changed in the past three decades. Few people had cell phones in 1990, nobody surfed the web, and the Simpsons was in its inaugural season (it’s now in its 35thseason—and counting). Many fewer Americans had graduated from college; many more were raised in two-parent families and attended religious services regularly. Of course, all this only scratches the surface, but it provides some indication that America, not to mention the world, is a much different place than it was in 1990.
In a new research brief, I explore the changing predictors of happiness for young adults. How has America changed so much, while at the same time happiness has changed so little, at least until the pandemic? My analysis is based on over three decades of data from the General Social Survey (GSS), an annual or biennial survey that polls Americans on a wide range of attributes, behaviors, and beliefs. Every year Americans are asked how happy they are on a scale of 1 to 3:
Taken all together, how would you say things are these days—would you say that you are very happy, pretty happy, or not too happy?
- Very happy
- Pretty happy
- Not too happy
Young adults in America, all told, are a happy bunch. Since 1990, 89% report being either very happy or pretty happy. Among that 89%, “pretty happy” outweighs “very happy” by about two to one. The results that follow explore what distinguishes the very happy among us from everyone else. Psychologists wouldn’t be wrong to criticize the crudity of the GSS happiness measure, but they can’t match its broad advantages: nationally representative data, with the same questions repeated over time, coupled with a very extensive battery of covariates. I’ll consider how the following attributes affect happiness: age, race, education, sex, marital status, family structure of origin, attendance at religious services, income, age, employment, and whether respondents have children. My analyses omit the 2021 data, because they depart so meaningfully from the longstanding trend. Pandemics are the exception in modern America, not the rule.
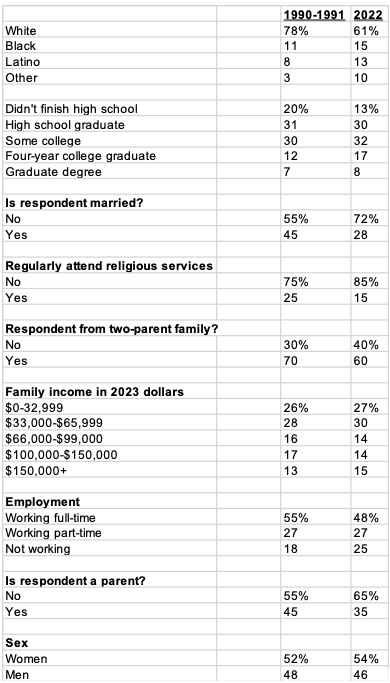
Let’s start with how much America and its young adults have changed between the early 1990s and 2022 according to the GSS. The major trends shown in Table 1 can be summarized in a single sentence. Compared to 1990-1991, young adults are less white, more educated, less likely to be married, less religious, more likely to come from a single-parent family, less likely to be employed, and a bit wealthier. (They’re also a bit younger and a bit more likely to be female, but these changes are nugatory.) All of the changes shown in Table 1 can be measured in single digits, more or less, with one big exception: the percentage of young adults who are married has fallen from 45% to 28%.
Table 1. The Changing Attributes of Young Adults, 1990-91 vs. 2022

The positive correlation between marriage and happiness is a well-established social science finding, although it should be noted that some studies in the past decade have questioned the causality: rather than marriage making people happy, perhaps happy people are more likely to get married and stay married. The scholarship in this area is ongoing, but for now it seems safe to say that the relationship between happiness and marriage can be attributed to both causality and selectivity: marriage makes people happier, and happier people are more likely to get married in the first place. It’s also well documented that more money makes people happier, although there’s a ceiling on its benefit—having a stratospheric income doesn’t make you stratospherically happy. Regular attendance at religious services also seems to help. On the flip side, people who weren’t brought up by two married parents have worse mental health on average. So, too, do folks who are unemployed. And traditionally parents are less happy than non-parents, although this may be changing in recent years.
All the changes between the early 1990s and 2022, especially in marriage rates, raise an intriguing question. If married people are much happier and people are less likely to be married, then why has happiness not fallen faster and farther?
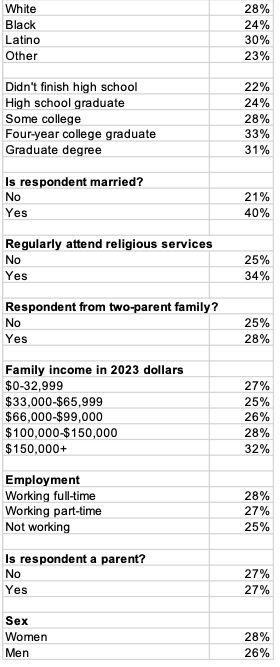
I’ll start off with a broad examination of the predictors of young adult happiness since 1990, based on logistic regression models predicting which respondents identified as very happy. I present the results as predicted probabilities, shown in Table 2 (the regression table itself appears in Appendix A).
Table 2. Who’s Happy? Ages 18-35, 1990-2022

By far the largest predictor of happiness is marriage. Marriage almost doubles the chances of identifying oneself as “very happy,” from 21% to 40%. Even under the most conservative interpretation of this result—that it entirely reflects sample selection, not causation—it cannot be disputed that marriage is a strong marker of happiness in contemporary America.
The next two strongest predictors of happiness are education and attendance at religious services. Survey respondents who didn’t complete high school, or finished but didn’t go to college, are less happy than people who spent at least some time in college. Graduates make more money and are more likely to have fulfilling jobs. College may also impart problem-solving skills and other social capital that somehow redound to personal satisfaction.
Attending religious services several or more times a month increases the odds of being very happy by 9%. In Soul Mates: Religion, Sex, Love, and Marriage Among African Americans and Latinos, Brad Wilcox and I explored why many people benefit from regular attendance at a church, synagogue, or mosque. The reasons are both spiritual and temporal. Faith often gives people purpose and a framework for coping with life’s tribulations. Regular attendance also embeds people in a community of like-minded peers. Wilcox and I showed that being part of a network of like-minded believers can explain up to one half of the association between religious participation and marital happiness.
All of the other predictors in the model offer modest and largely predictable effects on happiness. Higher incomes increase the odds of happiness, although the difference between a family income of under $33,000 and a family income of over $50,000 (all in 2023 dollars) is only 5 percentage points. Money, it seems, only buys happiness for a few people. Whites and, especially, Latinos are a bit happier than African Americans and members of other population groups (predominantly Asian Americans and American Indians). People from two-parent families are slightly happier, consistent with a long line of research on the consequences of family structure. And predictably, people who are unemployed are less happy than workers. So, too, are men, compared to women. Perhaps this reflects burgeoning challenges that have affected boys and men in schooling, employment, and myriad other life domains.
Curiously parents are no less happy than non-parents, a result that’s contrary to an extensive body of research. I’ll hint at why this might be the case in the next section.
To continue reading, download the full research brief, "Trends in Young Adult Happiness: 1990-2022."


