Highlights
- UK divorce rates among the most recent newlyweds are now down by 59% over the first three years of marriage from the peak, 47% over the first 5 years, and 27% over the first 10 years of marriage. Post This
- The projected lifetime risk for divorce in the UK is now at the same level as experienced by couples who married in 1972. Post This
Last week, the UK Office for National Statistics released the latest annual statistics on divorce. In 2017, divorce rates—which they define as the number of divorces per 1,000 married couples—were down by 5%, reversing a rise in divorce rates in 2016.
In reporting this, the UK media usually cite a selection of lawyers and therapists who try to explain why the economy or “fiscal austerity” or Brexit is responsible for the rise or fall of divorce. Sometimes, these “explanations” can be delightfully contradictory.
The key problem is that trying to form any useful conclusions from this year of divorce method of reporting data is a mugs game. It tells us little about underlying trends.
To understand the trend, we need to find out what is happening to married couples by year of marriage. Only then can we draw sensible conclusions.
Thankfully, we are blessed with extremely detailed data in the UK. Each year, we are told how many couples divorced after one year, two years, three years of marriage, etc. We are also told the number of wives and husbands filing, and we also know their previous marital status.
By mapping the number of divorces for each duration of marriage onto the number of marriages that took place in that equivalent year, we can build a model that tracks every year of marriage. The result is a much clearer story of what is happening to marriages in the UK.
Here are some highlights:
- For any given year of marriage since 1963—the first year for which we have full data—divorce rates have peaked between years 4 and 8 and then declined steadily thereafter. The “seven-year itch” has thus only ever been a Hollywood myth.
- After marriages reach about 10 years of duration, divorce rates become highly predictable as they decline. There is no sudden jump as parents become “empty nesters.”
- This remarkable observation shows that almost exactly 20% of all marriages have ended or will end after their first decade, regardless of whether couples married in 1963, 1973, 1983 or 1993.
- All of the variation in divorce risk takes place in the first decade of marriage, with couples who married in the 1970s and 1980s doing progressively worse and now couples who have married since the 1990s doing progressively better.
- Actual UK divorce rates among the most recent newlyweds are now down by 59% over the first three years of marriage from the peak, 47% over the first five years, and 27% over the first 10 years of marriage.
- All of this decline—yes, all of it—is also due to fewer wives filing for divorce during the first decade of marriage.
- We now project that 35% couples getting married in the UK today will end up divorced, down from the 44% peak projection for couples who married in either 1986 or 1991. This projected lifetime risk for divorce is now at the same level as experienced by couples who married in 1972.
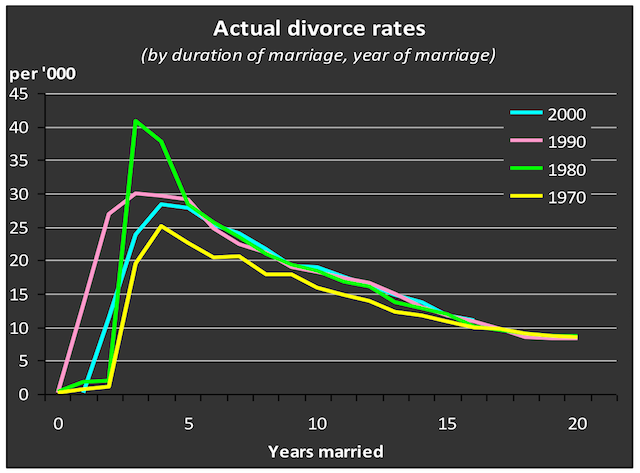
Note: Divorce rates shown are for the United Kingdom. Source: Marriage Foundation analysis.
These big conclusions—that the variation in divorce rates is entirely dependent on how many wives file for divorce in the first decade and that divorce rates thereafter follow a well-worn consistent path—now need a decent explanation.
First, I find it deeply reassuring that after couples have survived the first decade, marriage is marriage. The huge social changes of the past 50 years—the sexual revolution, birth control, cohabitation, the Internet, economic, political, legal, and cultural upheavals—have had little-to-no effect on most marriages.
Second, any explanation for why change happens in the first decade needs to explain the very strong gender effect. The rate at which husbands file for divorce has barely changed over any duration of marriage for 50 years. So why did ever more women file for divorce during the 1970s and 1980s, and why did fewer women file from the 1990s until today?
For me, the most plausible explanation boils down to commitment. Men's commitment has so much more to do with “sliding and deciding” than it has for women. As the cohabitation boom took off here during the 1970s and 1980s, so did the proportion of men who moved from cohabitation to marriage without clearly “deciding.” As ever more “sliders” got married without ever fully buying in, hence ever more early divorces were initiated by unhappy wives.
Today, the situation is very different. Attitudes about marriage have softened. So as fewer men hear family and friends putting subtle pressure on them to marry—"When are you going to tie the knot /make an honest woman of her / do the decent thing?”—so fewer men “slide” into marriage. Those who do marry are “deciders” who really mean it. Hence, the big fall off in divorces initiated by wives.
Of course, the problem remains that when most of the general public thinks about the failure of a relationship, they still ignore the much higher break-up rates among unmarried cohabiting couples because it's so much harder to measure and report.
But at some stage, this good news story about the success of modern marriages will filter through into the public consciousness. And maybe then the tide will turn back towards marriage.
Harry Benson is Research Director of the UK-based Marriage Foundation.