Highlights
- The top 25 schools overall are almost all religiously affiliated. Post This
- In most cases, elite schools produce married grads at around the rate that their observed qualities suggest they should. Post This
- The top 5 elite colleges with the highest share of married grads are: Notre Dame (67.5%), Washington and Lee (66%), Bucknell (65.4%), Davidson (65%), and Vanderbilt (63.9%). Post This
College, it turns out, is a great place to get married. There is a high correlation between spouses’ degree of educational attainment, a pattern of pairing usually called “educational homogamy.” Research from Denmark and Norway suggests that this pairing is driven both by sorting—similar people both go to college and get married to each other—and also by colleges reducing the “search frictions” of pairing.
Colleges, in other words, both make it easier for those people to pair off, and serve as a signal that another person is a potential spouse. But which schools actually have the most married grads? And which ones do the worst?
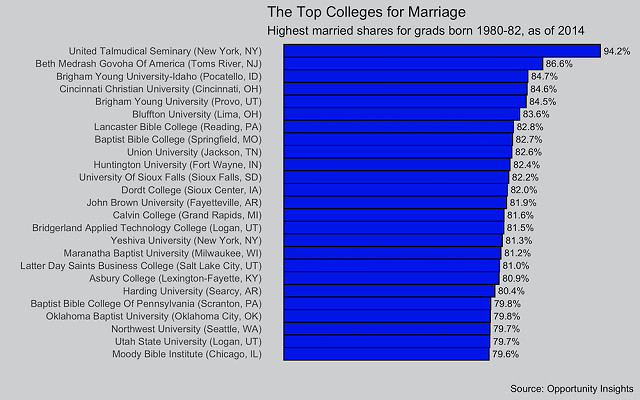
To answer these questions, I use data published by Opportunity Insights, the Harvard-based research group which investigates “barriers to economic opportunity.” In particular, the group obtained information on essentially every U.S. tax filer born between 1980 and 1991, including the college many of them attended. OI published a summarized subset of this data, including information on nearly 2,200 schools. Included therein, in addition to a host of statistics used below, is a measure of the share of the school’s graduates a) born between 1980 and 1982, who were b) married as of 2014. (This statistic is hereafter called a school’s “married share.”)
Figure 1 and 2 present the schools with the highest and lowest married shares. Unsurprisingly, the top 25 schools are almost all religiously affiliated. The top two are Orthodox Jewish Yeshivas, and all but two of the remaining have an explicit religious affiliation. The other two, Bridgerland Applied Technical College and Utah State University, are both located in Utah—the state with the fourth-highest marriage rate, thanks to a Mormon population that likely attends both schools disproportionately.
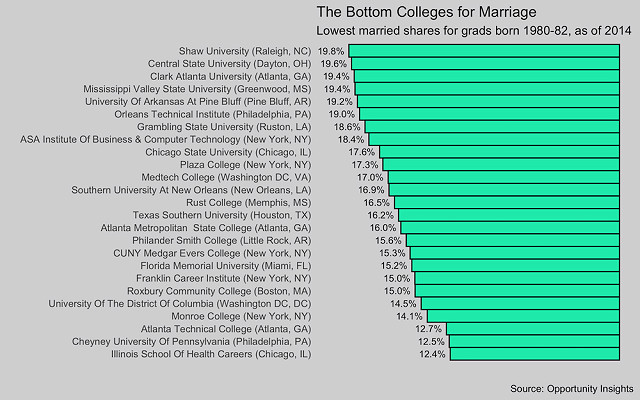
The bottom 25 exhibits a different pattern. Half of the schools are historically black colleges or universities, and only three are less than half black, compared to the dataset average of 11.8 percent. This makes sense: Just as more religious people are more likely to get married, black people are less likely to be married. About half as many black Americans were married as of the 2019 American Community Survey as were white Americans, for example.
These schools may have outlier married shares, but what about those colleges that grab headlines? In figure 3, I identify married shares among 50 highly selective schools, comparing their admit rate against their married share. Interestingly, there is not much correlation between these variables—at least within elite schools, more elite does not necessarily mean more marriage.
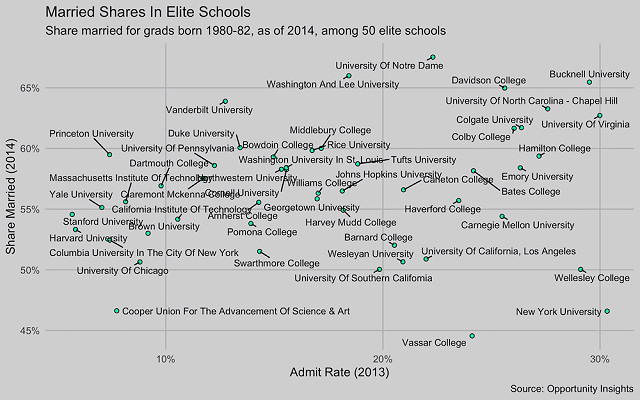
The tops and bottoms are notable here, too. (See the end of this article for a full list.) The top five are: Notre Dame (67.5% married), Washington and Lee (66%), Bucknell (65.4%), Davidson (65%), and Vanderbilt (63.9%); the bottom five are: Wellesley (50%), USC (50%), Cooper Union (46.6%), NYU (46.5%), and Vassar (44.5%). By way of comparison, in 2014, 53.3% of Americans ages 32 to 34 were married, according to the American Community Survey; 44.7% of those with less than four years of college were married, compared to 62.1% with four or more years.
Why the most-married and least-married schools rank the way they do is easily explained by demographic variables. But what if we tried to control for those variables? To do so, I construct a simple model that includes measures of a school’s demographic composition (the shares of black, Hispanic, Asian, and female students in 2000); the school’s selectivity, as measured by Barron’s; a measure of mean parental income; whether or not the school is public; whether or not the school is a trade school, as measured by whether 90% or more of its students focus in a single subject-matter area; and the state where the school is located. In addition, it includes a few partial measures of religiosity: whether the school’s accreditor is explicitly religious; whether the school is a member of the Council for Christian Colleges and Universities or Association of Catholic Colleges and Universities; and whether the college has any of a series of religious terms in its name, like “Seminary,” “Yeshiva,” or “Nazarene.”
Together, these factors explain about 80% of the variation in the school’s married share. For our purposes, however, we are interested in those schools for whom the model explains the least, the ones with the largest difference between what the model predicts their marriage share should be, and what it actually is (i.e., those with the largest residuals). After controlling for a host of factors, which schools have unexpectedly high or low married shares? We can’t necessarily say that something about these schools causes the difference, but we can highlight what is unusual about them.
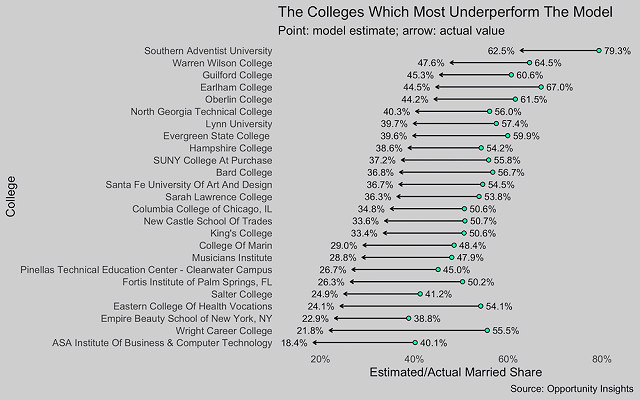
In figures 4 and 5, I depict information about the 50 colleges that most over and under-perform the model. In particular, the point represents what the model suggests their married share should be, whereas the arrow points to where it actually is. A longer arrow means a larger residual, meaning more over- or under-performance.
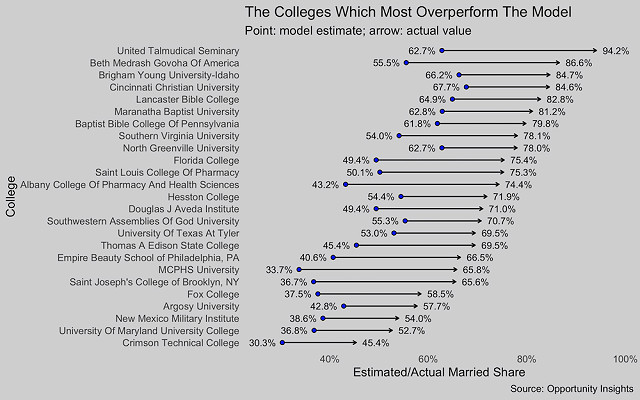
Many of the top performers are still religious schools, meaning that they have high married shares even after partially controlling for religiosity. But there are also other interesting outliers. Two pharmacy schools—the Albany College of Pharmacy and Healthy Sciences and MCPHS University—make the list. So do three public colleges: the University of Texas at Tyler, University of Maryland University College, and New Mexico Military Institute.
The underperformers are no longer simply those with the high black student shares. Instead, many of them are small liberal arts schools, including Warren Wilson, Guilford, Oberlin, and Hampshire Colleges. There are also a number of technical schools; interestingly, Empire Beauty School’s two locations appear in both the top and bottom of the ranking.
In the final figure, I look at how these 50 elite schools perform against what their observable demographics predict. On the x-axis is the prediction; on the y-axis is the actual married share. The line in the middle has a slope of 1, meaning that the model perfectly predicts the married share of a school whose point falls on that line. Schools with points above the line over-perform; schools with points below under-perform.
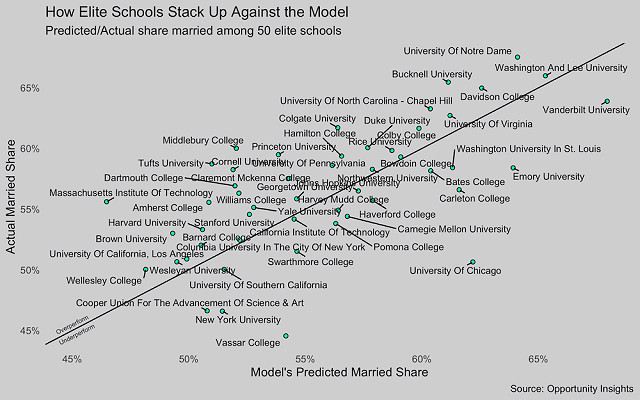
The data suggest that in most cases, elite schools produce married grads at around the rate that their observed qualities suggest they should. There are a few outliers, including the University of Chicago and MIT. But most are within 5 percentage points of what the model predicts.
Again, one cannot say from these numbers alone whether schools themselves cause an increase or decrease in probability of marriage; if anything, there are plausible selection stories to explain most of these schools. But they do suggest that college as a mating market conforms to the broader trends in marriage—who does it and who doesn’t—even as it becomes the place where more and more Americans meet their future husband or wife.
Charles Fain Lehman is a fellow at the Manhattan Institute and a Contributing Editor of City Journal.
Table 1: Married Shares Among the Top 50 Most Selective Schools
|
1 |
University of Notre Dame |
67.53% |
|
2 |
Washington and Lee University |
65.99% |
|
3 |
Bucknell University |
65.47% |
|
4 |
Davidson College |
64.98% |
|
5 |
Vanderbilt University |
63.89% |
|
6 |
University of North Carolina - Chapel Hill |
63.27% |
|
7 |
University of Virginia |
62.72% |
|
8 |
Colgate University |
61.72% |
|
9 |
Colby College |
61.66% |
|
10 |
Duke University |
60.07% |
|
11 |
Middlebury College |
60.02% |
|
12 |
Rice University |
59.84% |
|
13 |
Princeton University |
59.50% |
|
14 |
Hamilton College |
59.37% |
|
15 |
Bowdoin College |
59.30% |
|
16 |
Tufts University |
58.74% |
|
17 |
University Of Pennsylvania |
58.60% |
|
18 |
Washington University In St. Louis |
58.43% |
|
19 |
Emory University |
58.41% |
|
20 |
Northwestern University |
58.29% |
|
21 |
Cornell University |
58.26% |
|
22 |
Bates College |
58.16% |
|
23 |
Claremont Mckenna College |
57.54% |
|
24 |
Dartmouth College |
56.92% |
|
25 |
Carleton College |
56.59% |
|
26 |
Johns Hopkins University |
56.50% |
|
27 |
Williams College |
56.32% |
|
28 |
Georgetown University |
55.85% |
|
29 |
Haverford College |
55.71% |
|
30 |
Massachusetts Institute of Technology |
55.61% |
|
31 |
Amherst College |
55.56% |
|
32 |
Yale University |
55.14% |
|
33 |
Harvey Mudd College |
54.92% |
|
34 |
Stanford University |
54.57% |
|
35 |
Carnegie Mellon University |
54.40% |
|
36 |
California Institute of Technology |
54.18% |
|
37 |
Pomona College |
53.81% |
|
38 |
Harvard University |
53.32% |
|
39 |
Brown University |
53.01% |
|
40 |
Columbia University in The City of New York |
52.45% |
|
41 |
Barnard College |
52.03% |
|
42 |
Swarthmore College |
51.52% |
|
43 |
University of California, Los Angeles |
50.89% |
|
44 |
Wesleyan University |
50.66% |
|
45 |
University of Chicago |
50.65% |
|
46 |
Wellesley College |
50.04% |
|
47 |
University of Southern California |
50.04% |
|
48 |
Cooper Union tor the Advancement of Science & Art |
46.62% |
|
49 |
New York University |
46.60% |
|
50 |
Vassar College |
44.56% |