Highlights
Jordan Weissman of Slate described my recent research on divorce as the Goldilocks theory of marriage: “Getting married too early is risky, but so is getting married too late. Your late 20s and early 30s are just right.”
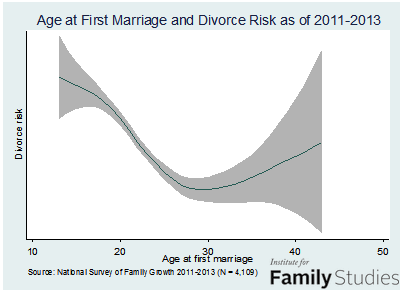
My analysis of data from the 2006-2010 National Survey of Family Growth (NSFG) indicated that age at marriage now has a U-shaped relationship to divorce risk. The odds of divorce decline as you age from your teenage years through your late twenties and early thirties. Thereafter, the chances of divorce go up again as you move into your late thirties and early forties (all NSFG respondents are under 45). This is a marked departure from the way things used to be, when the relationship was relatively linear: the older you are when you first marry, the lower the odds of divorce. Period.
Replication is always crucial in the social sciences. I therefore sought to reproduce my findings with more recent data from the NSFG, the 2011-2013 survey (for details about my data analysis, click here). The primary result, depicted below, was almost identical to what I obtained from the 2006-2010 survey: the 28 to 32 age range remains the period of lowest divorce risk.
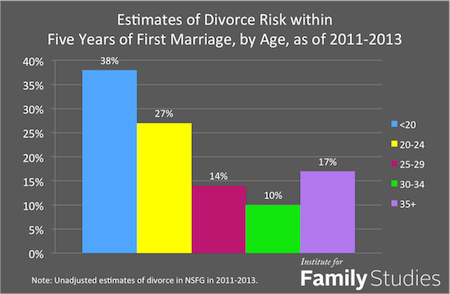
And here are divorce levels after five years of marriage:
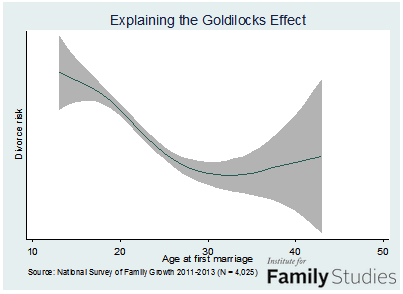
Demographic differences between respondents can partially explain the Goldilocks relationship between marriage age and divorce. In the following figure I controlled for respondents’ sex, race, family structure of origin, age at the time of the survey, education, religious tradition, religious attendance, and sexual history, as well as whether the respondent had a child prior to wedlock, and the size of the metropolitan area that they live in.1 Including these controls yields a gentler increase in divorce risk for people marrying after their early thirties. Still, as the figure below indicates, the divorce risk does go up if you marry in your mid-thirties, or later:
Sociologist Philip Cohen of the University of Maryland has criticized my research on the Goldilocks theory of marriage, in part by conducting analysis of the American Community Survey (ACS). Initially he posted this figure:
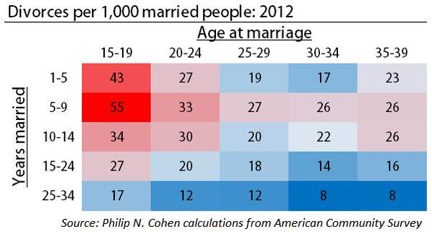
Strangely, this figure appears to support my findings, given the larger number of divorces for people married one to five years at ages 35 to 39, 23 divorces per 1,000 married people in 2012, compared to 17 for people married between 30 and 34. But this figure isn’t any more persuasive than any of his other analysis of age at marriage and divorce based on the ACS. This data set lacks the necessary information on marital history for conducting event history analysis, which for decades has been the accepted statistical technique for analyzing time-dependent phenomena like marriage duration. So Cohen reports results based on analysis that inadequately accounts for time dependence. Perhaps this is why his analysis only includes respondents who divorced in the year prior to the month and day they were interviewed. Needless to say, such an analysis fails to acknowledge a great many divorces.
For these reasons, Cohen’s analysis is biased and therefore not dependable. Surely Cohen knows all this, but has nevertheless continued to defend his use of the ACS data.
I have now shown the Goldilocks effect using two different data sets, the 2006-2010 and the 2011-2013 National Surveys of Family Growth, and more than 10,000 respondents. Its existence is beyond question. Explaining the Goldilocks effect, however, will require additional scholarship.
Nicholas H. Wolfinger is Professor of Family and Consumer Studies and Adjunct Professor of Sociology at the University of Utah. His next book, Soul Mates: Religion, Sex, Children, and Marriage among African Americans and Latinos, coauthored with W. Bradford Wilcox, will be published by Oxford University Press at the beginning of 2016. His other books include Understanding the Divorce Cycle: The Children of Divorce in Their Own Marriages; Do Babies Matter? Gender and Family in the Ivory Tower (with Mary Ann Mason and Marc Goulden); and Fragile Families and the Marriage Agenda (edited, with Lori Kowaleski-Jones).
1. Note again that the NSFG is a cross-sectional survey, which means that all respondent information was collected at a single point in time. Thus, as I noted in my original analysis, the effects of education, religious attendance, and other impermanent demographic attributes on marital stability may not be causal. Results involving these variables should therefore be treated as provisional.
Appendix
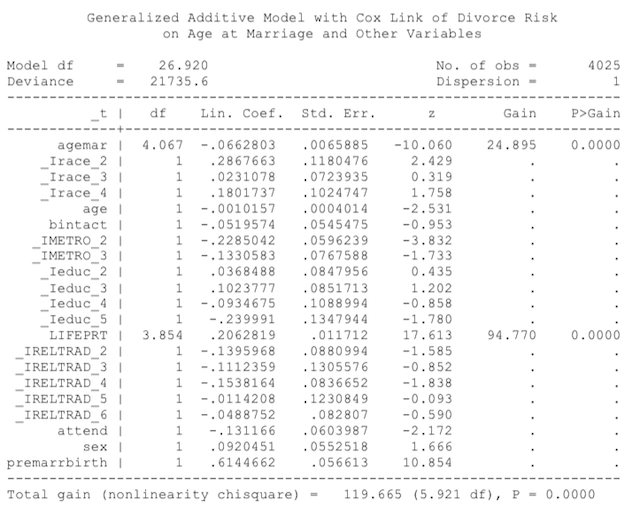
Variable coding:
Age at marriage is a continuous variable that is allowed to have a nonlinear relationship to divorce risk (this is the salient feature of a Generalized Additive Model).
- Race: white, black, Hispanic, other (white is omitted category)
- Age: continuous variable
- Bintact: respondent is from intact family (nonintact is omitted categoty)
- Metro: principle city of MSA (omitted), other MSA, not MSA
- LIFEPRT: # of sexual partners (ranges from 1 to 9); is a continuous variable that is allowed to have a nonlinear relationship to divorce risk
- RELTRAD: Steensland et al. (2000) religious tradition
- Attend: attends church several times a month or more
- Sex: men are reference category
- Premarrbirth: respondent/partner gave birth to a child before marriage.


