Highlights
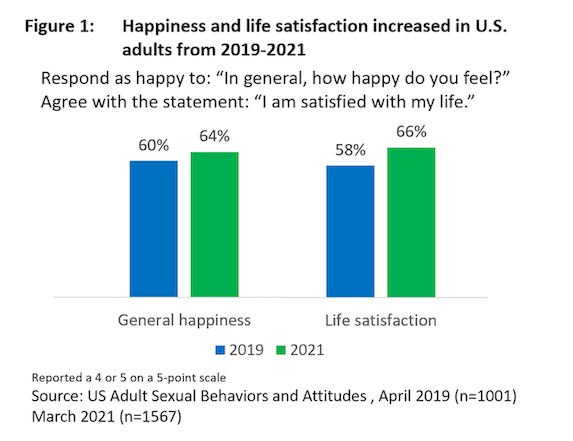
- General happiness rose from 60% in 2019 to 64% in 2021. Life satisfaction rose even more, from 58% in 2019 to 66% in 2021. Post This
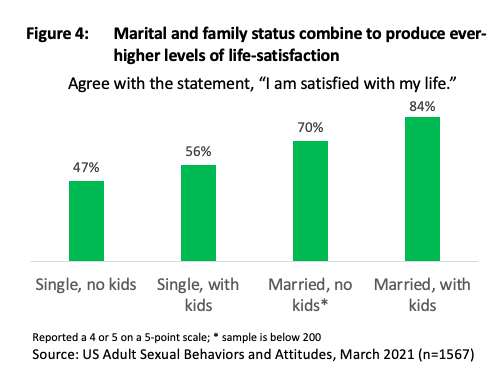
- Parents experienced above-average increases in happiness and life satisfaction between 2019 and 2021. When we combine parenting with marriage, life satisfaction is even higher than for parents alone, at 84%. Post This
“Parents Are Not Okay” read a recent headline in The Atlantic. This is but one of many recent media headlines suggesting that parents are miserable. As Dan Sinker elaborated in The Atlantic:
We are expected to send our kids off into God knows what, to work our jobs and live our lives like nothing’s wrong, and to hold it all together for months and maybe now for years without ever seeing a way out. This is not okay. Nothing is okay. No parent is okay, and I’m not sure how we come back from this.
Every one of us has had different challenges throughout this pandemic, and certainly, parents have fair concerns about this school year given the rise of the Delta variant. But the assumption that, “No parent is okay,” actually turns out to be false. As I’ll show, most people are happy—happier, in fact, than people were two years before. And parents are among the most okay of all.
To be fair, it’s not just Dan Sinker who believes we’re on the edge of a major happiness collapse. Gallup reported at two different points in 2020 that “Worry and Stress Fuel Record Drop in U.S. Life Satisfaction” (May 2020) and “Americans' Mental Health Ratings Sink to New Low” in December 2020. However, a quick look through both of these data-rich reports suggests that the alarm is less troubling than the headlines suggest. In the May piece, at the most alarming period of the rising pandemic, Gallup data showed that 57% of US adults scored high on life satisfaction, while 69% scored high on estimates of life satisfaction for the future. The former number, though high, was indeed a drop of ten percentage points from 2019. But the latter number was actually higher than its comparable 2019 number.
Interestingly, the same Gallup organization that reported these alarming headlines is also behind the annual World Happiness Project, an initiative commissioned by the UN. This project measures happiness and life satisfaction in dozens of countries; the 2021 report, released this past March, revealed that in many countries, the U.S. included, happiness had climbed from the year before.
This bump in happiness is directly confirmed by comparing the results of the April 2019 and March 2021 waves of the U.S. Adult Sexual Behaviors and Attitudes surveys.1 Across that crucial span of two years, pre- and mid-COVID-19, two measures of well-being—general happiness and life satisfaction—did indeed climb.
This was hardly to be expected. In the very same 2021 survey, 37% of adults agreed that their mental health had suffered during the pandemic. We might expect that very real suffering to then drag down overall happiness compared with 2019’s results before the pandemic hit. This is not what happened.
In response to the question, “In general, how happy do you feel?” (where 1 is very unhappy and 5 is very happy), general happiness rose from 60% in 2019 to 64% in 2021 (see Figure 1). Life satisfaction (defined as selecting 4 or 5 on a 5-point scale in agreement with the statement “I am satisfied with my life) rose even more steeply, from 58% in 2019 to 66% in 2021.
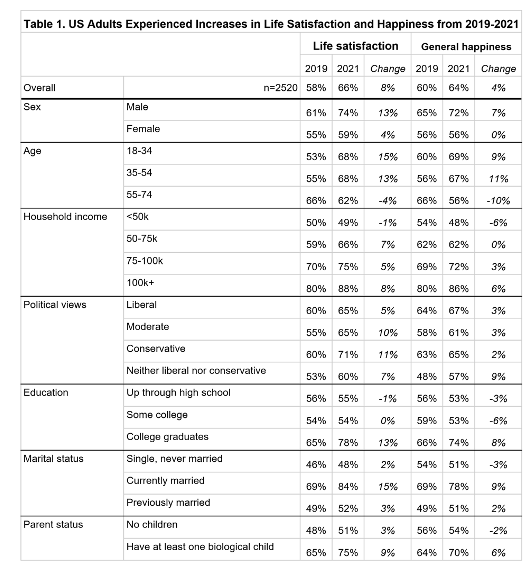
How is it possible that people’s average happiness and life satisfaction rose during the pandemic? We get a partial answer to this by examining which subgroups experienced the steepest increases compared with those whose happiness and satisfaction stayed flat or went down. One of the groups that fared the best is men— whose happiness and life satisfaction both rose sharply in contrast with women who only saw a rise in life satisfaction (see Table 1 in the Appendix for full details). Younger people also experienced higher rises in happiness and satisfaction, while those aged 55 to 74 experienced decreases in both areas. As is always the case with happiness and life satisfaction research, household income plays a strong role, not only giving higher-income homes an advantage to start out with but largely accounting for the increases in the total population, especially given the lowest-income group’s dipping happiness and unchanged life satisfaction (see Figure 2).
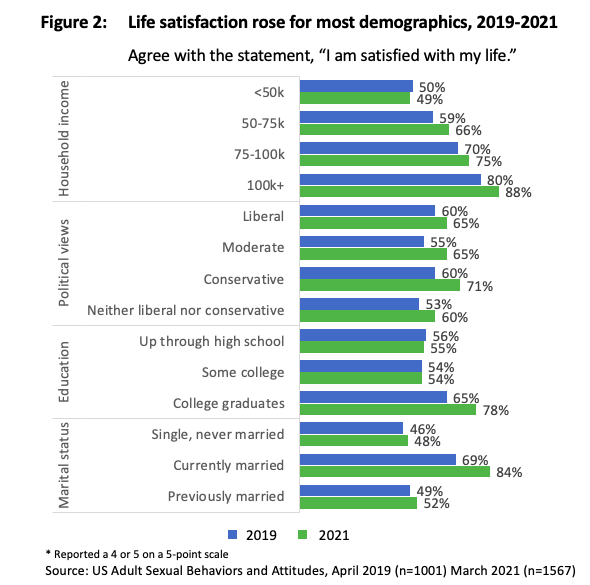
Political ideology played only a modest role in happiness but varied much more widely for life satisfaction, with conservatives getting the biggest bump. As expected, the role of education is similar to that of income, with college graduates seeing increases in both happiness and life satisfaction. Overall, the group that scored near the top in life satisfaction and also high in happiness are married adults. At half the sample, married adults experienced nearly all the gains, leaving never-married and previously married adults with only modest gains in life satisfaction and even a minor decrease in happiness for the never-married.
But how did parents in particular fare? As the data in the table show (see Appendix), parents—the exact group whose purported misery is the subject of so much hand-wringing—experienced above-average increases in happiness and life satisfaction. Fascinatingly, even the desire to someday have a child corresponds to greater happiness and life satisfaction (see Figure 3).
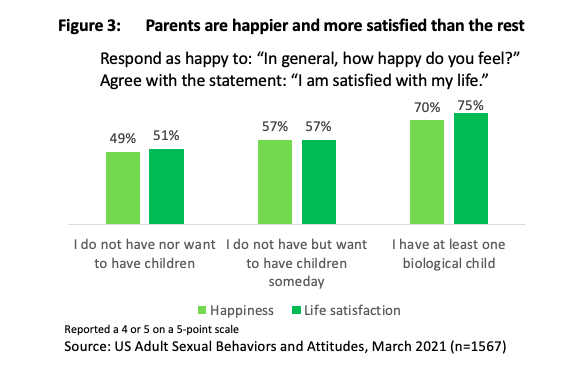
When we combine parenting with marriage, life satisfaction is even higher than for parents alone, at 84% (see Figure 4). Other community resources are likely to make a difference here as well, such as the role of faith. Though not measured in 2019, we captured self-identified levels of religious belief in 2021 and found that for the 43% of people who indicate that they are religious, 79% are satisfied with their lives and 74% are happy.
It’s clear that as genuinely awful as it has been, the pandemic has not destroyed us as a group, and it has specifically not broken parents, generally. We are making it through the challenges, not only surviving them but—at least for those with abundant social, personal, and material resources—thriving through them. Of course, this is small comfort for those without such resources. The devil in this detail is that those supportive resources tend to go together. People with more educational and financial resources tend to marry and have children. People raising families tend to express higher religious and other social commitments that provide real support to themselves, their families, and their communities. As we look ahead to future challenges— pandemics, natural disasters, political upheaval—it would serve us well to encourage people to accumulate and share the resources that will make them and their communities stronger.
James L. McQuivey (Ph.D., Syracuse University) has taught at Boston University and Syracuse University. He is a consumer behaviorist and analyst who is regularly sought for commentary by publications like The New York Times and The Wall Street Journal. His research into family studies focuses on human mating strategies and the role of parents in determining positive life outcomes. He is the author of the book Why We Need Dad.
1. The survey of U.S. Adult Sexual Behaviors and Attitudes was fielded to a U.S. representative sample of adults ranging in age from 18 to 74, in two waves, first in April 2019 (n=1001) and again in March 2021 (n=1567). The outgoing sample was balanced by sex, age cohort, and U.S. Census region. Sample sourced from and data collection provided by Dynata, a global leader in first-party data and data services. The respondents were weighted back to the outgoing sample parameters for sex, age, marital status and region. Data were validated for internal consistency and compared for population representation to U.S. Census data and GSS data for income, rates of marriage, and childbearing. The project was conceived, designed, executed, and the majority funded by Dr. James McQuivey.
Appendix