Highlights
- College-educated adults are slightly more likely than those without a college degree to marry someone of a different party identification, and older adults are slightly less likely to be in politically-mixed marriages than those who are under 35. Post This
- Democrats are slightly more likely to marry someone who does not share the same party identification than are Republicans, and Independents are most likely to be in a politically-mixed marriage. Post This
Marriage has always been a marker of both social solidarity and division in America. Marriages between people of different races were once prohibited, but they are now on the rise – one indication of growing solidarity across racial lines in America. Tolerance toward interfaith marriages has also grown over the years, and Americans are more likely to marry a spouse of a different religion now. But the same cannot be said for politics.
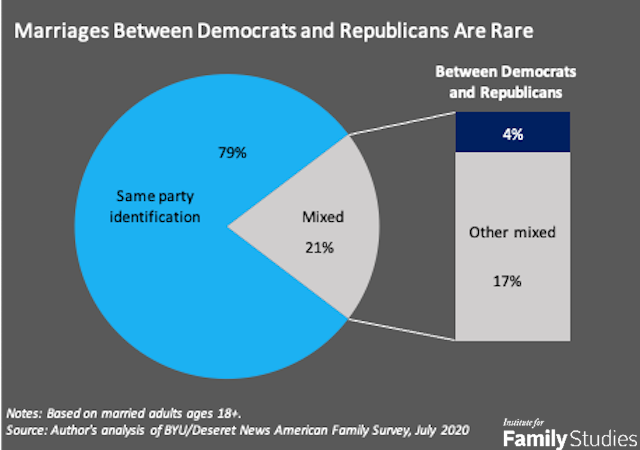
Marriages across political lines appear to be falling. In 2016, when Eitan Hersh and Yair Ghitza counted married couples among registered voters, they found that 30% of couples were politically mixed, meaning they did not share the same party identification. Most of these marriages were between partisans and Independents, and 9% of all marriages were between Democrats and Republicans. Today, only 21% of marriages are politically mixed, and nearly 4% (3.6%) are between Democrats and Republicans, according to my analysis of the new American Family Survey.
This is a sizable decline in just 4 years, albeit the two results cannot be directly compared because of different methods. Hersh and Ghitza’s finding was based on a database of voter registration records. They focused on voters in 30 states and did not have direct data to define married couples. In contrast, the American Family Survey was based on a national sample of 3,000 American adults, and I looked at currently-married adults and compared respondents’ party ID with their spouses.’
Alternatively, it is possible to make a direct comparison between 2020 and 2017, the earliest year when the spouse’s party affiliation was available in the American Family Survey. My analysis suggests that in just three years, the share of politically-mixed marriages in the U.S. has declined from 23% to 21%, and the share of marriages between a Democrat and a Republican dropped from 4.5% to 3.6%. So, both sources suggest that the share of politically-mixed marriages has been trending down, at least in recent years.
Trends going back to earlier years are not available, but other sources indicate that we have become less tolerant toward interpolitical marriages. When Gallup asked in 1958, “If you had a daughter of marriageable age, would you prefer she marry a Democrat or Republican, all other things being equal?” The results: 18% of Americans said they would prefer their daughter to marry a Democrat, 10% preferred a Republican, and the majority didn’t care. However, in 2016, 28% of respondents said they preferred their child to marry a Democrat and 27% a Republican, and the share who didn’t care has shrunk significantly, according to Lynn Vavreck, a political scientist at UCLA.
Who Is More Likely To Be In a Politically-mixed Marriage?
Looking further into the pattern of interpolitical marriages by demographics such as education and age, we see that college-educated adults are slightly more likely than those without a college degree to marry someone of a different party identification (23% vs. 20%), and older adults are slightly less likely to be in politically-mixed marriages than those who are under 35 (20% vs. 23%). These are not big differences at all.
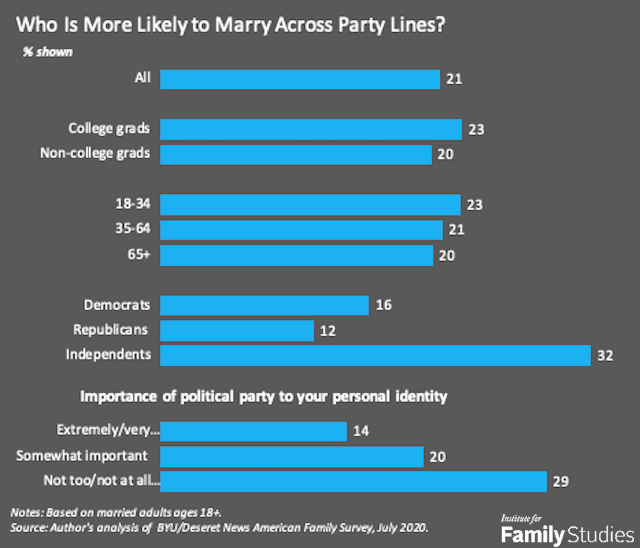
A somewhat clearer pattern emerges when looking at the party ID of the respondents. Democrats are slightly more likely to marry someone who does not share the same party identification than are Republicans (16% vs. 12%), and Independents are most likely to be in a politically-mixed marriage. About one-third (32%) of Independents are married to someone who is not politically independent.
Finally, what really separates couples is how big a role politics plays in their overall identity. Among married adults who say that their political party is either extremely or very important in their overall identity (36% all married adults), only 14% have a spouse who doesn’t share their political belief. On the other end of the spectrum, 29% of adults who believe their political identity is not important (39% of married adults) married a spouse with a different political belief.
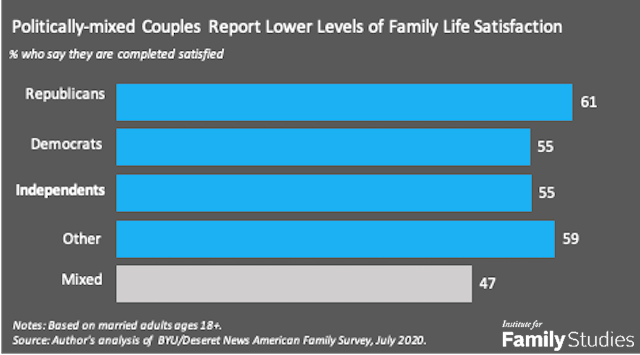
Politically-mixed Couples Are Less Happy
Just like couples in interracial or interfaith relationships, politically-mixed couples also face unique challenges in their relationship, especially during an election year. In 2017, after Trump won the election, 1 in 10 Americans ended a romantic relationship because of different political views. And 1 in 5 Americans know a couple whose marriage or relationship was negatively affected due to President Trump’s election in 2016, according to a poll by Wakefield Research.
In a comparison of family life satisfaction among couples of various political affiliations, politically-mixed couples do seem to be less happy about their family life. Less than half of these couples say they are completely satisfied with their family life (47%), compared with 61% of couples in which both spouses are Republicans and 55% are Democrats.
Before we jump to the conclusion that marriages between Democrats and Republicans just aren’t going to work, it is important to point out that the Democrat-Republican couples are actually not the ones who are most unhappy: 58% say they are completely satisfied with their family life, which is slightly higher than the shares among couples who are both Democrats or both Independents. On the other hand, about 14% Democrat-Republican couples also say they are at least somewhat dissatisfied with their family life, which was the highest among all couples. Couples that consists of a Democrat and an Independent seem to be the least happy: only 35% say they are completely satisfied with their family life.
If interracial marriages are a barometer for racial relations in the U.S., interpolitical marriages reflect how polarized we are in America today. Even though Trump’s election in 2016 and the current election season seem to push the two parties further apart, the polarization in the U.S. goes back a long way. In 2014, during Obama’s presidency, a Pew Research Center poll found that Democrats and Republicans were more divided than at any point in the past two decades. And the level of partisan antipathy had surged since 1994. The decline of interpolitical marriages is yet another telling and worrisome sign that balkanization is only deepening in America.
Wendy Wang, Ph.D., is director of research for the Institute for Family Studies. Her work has been featured in The New York Times, The Wall Street Journal, and many other venues.
Editor's Note: A shorter version of this IFS research brief appeared first at The Hill.