
Highlights
- Having one’s own children in the household was associated with higher levels of participation in a broad range of civic and political activities, whether the parent was married or not. Post This
- The married with children group was more likely than the never-married w/out kids group to have voted, done community service, contacted an official about an issue, attended a public meeting or rally, and contributed money to a candidate, party, or cause. Post This
- Current trends toward delayed family formation and non-formation may well be having negative effects on the healthy functioning of many communities and American democracy in general. Post This
Many teenagers and young adults took part in recent protests against police brutality, as well as in previous protests about the lack of governmental action on climate change and gun control. This youthful activism is striking because prior to this upsurge, political participation by young adults had been notable by its sparseness rather than its abundance. For example, only 30% of 18-24-year-olds voted in the 2018 congressional elections, compared with 40% of 25-44-year-olds and 55% of adults aged 45 to 64 years.1
One of the most dramatic demographic changes over the last half-century has been the postponement of marriage and parenthood among successive generations of young adults.2 Growing numbers of young women and men do not get married until they are in their thirties, and do postpone children until their mid-to-late thirties or early forties—if they marry or have children at all.3 This raises the question of whether there is a connection between delayed family formation and a lack of civic involvement, or a preference for anti-establishment efforts like boycotts and street protests, rather than conventional activities like attending public meetings, contacting officials, and voting.
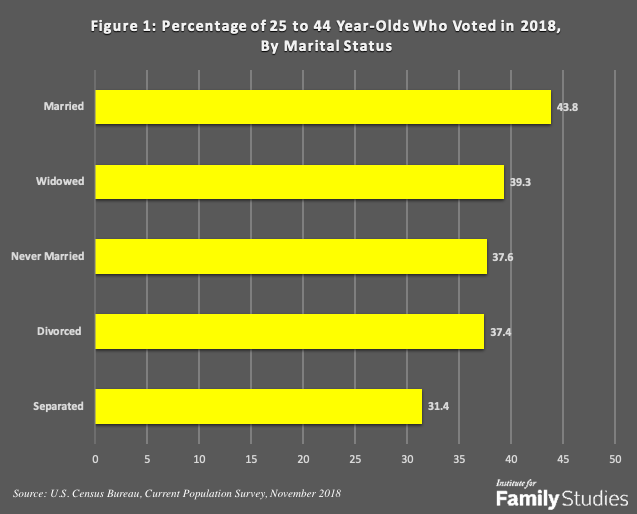
In a landmark study, Nicholas and Raymond Wolfinger found that married adults, whether they had children or not, were more likely to have voted in the 2000 presidential election than adults who had never married or were formerly married.4 This held true even after controlling for major correlates of voting like age, sex, race, education, employment, income, and recency of residential relocation. The pattern found by the Wolfingers may be seen in turnout figures from the 2018 congressional elections, where 56% of married adults reported voting, in contrast to 37% of adults who had never married. Even in the constrained age group of 25-to-44-year-olds, there were significant, though smaller, differences in voting turnout by marital status, as may be seen in Figure One.
But what about forms of civic and political participation other than voting, such as performing community service, attending public meetings, or supporting campaigns with volunteer work or cash contributions? Are married women and men with children more likely to take part in these kinds of activities than adults who are unmarried or childless?
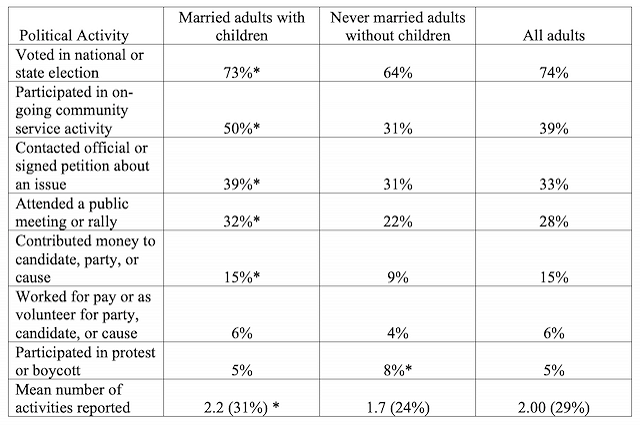
A national survey on civic involvement commissioned by the U.S. Department of Education provides data that can be used to address this question.5 The survey asked a national sample of 2,250 adults whether they had participated in seven specific civic activities in the last year, or, in the case of voting, in the last five years. These activities, and the percent of adults who reported each activity, are shown in Table One.
Table One. Percent of U.S. adults reporting specified activity in last 12 mos.
(or in the case of voting, in the last 5 years).
Source: Author’s analysis of public use data from the National Household Education Survey,
National Center for Education Statistics, U.S. Department of Education. N = 2,250.
Legend: * Differences in participation rates across marital/parental groups statistically significant, p < .01.
In order to examine the relationship between civic involvement and being married or becoming a parent, I divided the national sample into six groups:
- married or remarried with own children in household (30% of U.S. adults);
- married or remarried and not having or living with own children (30%);
- formerly married (i.e., separated, divorced or widowed) with children (5%);
- formerly married without children (14%);
- never married with children (3%); and,
- never married without children (18%).
I constructed an index of political participation by adding up the number of activities (out of seven) reported by each person in the national sample.6 Two-thirds said they had engaged in two or fewer of the 7 activities in the specified time period. Only 2% said they had engaged in six or seven of the activities, while nearly 16% reported none. The mean number of activities reported was 2 (i.e., 29% of the seven activities).
The mean index values were low for all the marital/parental groups, but there was significant variation among them. The married with children group was one of the groups with the highest mean value (31% of the activities), and the never-married without children group among the lowest (24%). The married with children group was more likely than the never-married without children group to have voted, done community service, contacted an official about an issue of concern, attended a public meeting or rally, and contributed money to a candidate, party, or cause. By contrast, the never-married group was slightly more likely to have taken part in a protest or boycott. There was no significant difference between them with respect to volunteer work for a candidate, party, or cause. The individual item percentages for the two groups are shown in Table One.
Married adults with children also had significantly higher participation index values than never-married adults with children (22%) and formerly-married adults without children (25%). However, their participation was not significantly greater than that of married adults without children (31%) or formerly married adults with children (29%).
Voting and other forms of political activity are related to demographic and socioeconomic factors like age, sex, race and ethnicity, educational attainment, employment, income, and immigrant status.7 The marital-parental groups varied with respect to these characteristics. In particular, never-married and formerly-married adults with children tended to have lower levels of education and income than married adults, with or without children.
When adjusted for these confounding factors, the pattern of group differences in participation scores was altered in a way that decreased the importance of marital status and increased that of parenthood.8
As shown in Figure Two, the index score for married adults with children was still significantly higher than the values for never-married adults without children and formerly-married adults without children. Additionally, it was now significantly higher than the adjusted score for married adults without children. But it was no longer significantly different from the formerly- married with children or the never-married with children.
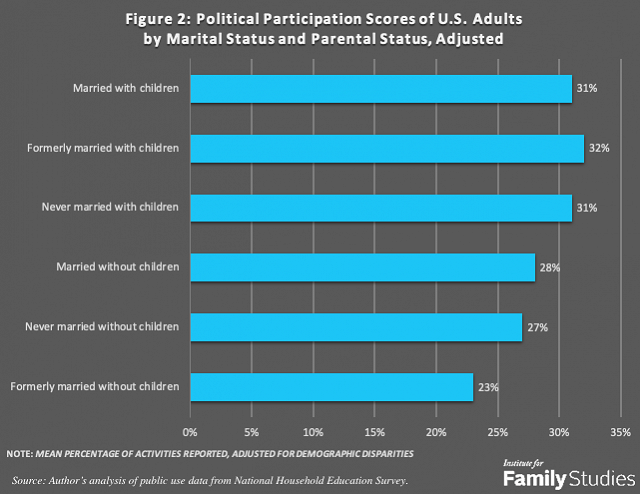
In other words, the presence of one’s own children in the household was associated with higher levels of civic participation, irrespective of the parents’ marital status.
These findings support the notion that getting married and raising children increases the likelihood that women and men will become involved in the political and civic life of their community and nation, not just through voting but also other forms of participation. Much of this enhanced involvement undoubtedly derives from the need to provide childcare and schooling for one’s offspring. Attendance at school-related meetings and events often raises political awareness and leads to participation in broader political efforts, such as support for legislative initiatives and candidates that promise to increase funding for education or broaden the range of schooling alternatives.9
Whereas the Wolfingers’ study cited above found that marital status was more important than parenthood in predicting voting turnout, the present study found that having one’s own children in the household was associated with higher levels of participation in a broad range of civic and political activities, whether the parent was married or not. Being married made a difference in the observed levels of participation, to be sure, but that difference seems to be attributable to the higher education and income levels of married couples. When education and income disparities among marital groups were statistically removed, formerly-married and never-married parents with children participated at equivalent levels to married parents with children.
These results bolster concerns that current trends toward delayed family formation and non-formation may well be having negative effects on the healthy functioning of many communities and of American democracy in general.10
Nicholas Zill is a research psychologist and a senior fellow of the Institute for Family Studies. He directed the National Survey of Children, a longitudinal study that produced widely cited findings on children’s life experiences and adjustment following parental divorce.
1. U.S. Bureau of the Census, Voting and Registration Supplement to the 2018 Current Population Survey.
2. The median age at first marriage for women rose from 21 to 28 between 1970 and 2019, while the median age for men rose from 23 to 30 over the same time period. Family and Fertility Statistics Branch, U.S. Bureau of the Census. (November 2019). Table MS-2. Estimated median age at first marriage: 1890 to present.
3. In 2016, the birth rate for women aged 35–39 was the highest rate for this group since 1962. The birth rate for women aged 40–44 was the highest rate for this group since 1966. National Vital Statistics Reports, Vol. 67, No. 1, January 31, 2018. The birth rates for the same two age groups in 2019 were equal or higher. NVSS National Vital Statistics Rapid Release. Report No. 008, May 2020.
4. Wolfinger, N.H. & Wolfinger, R.E. (2008). Family structure and voter turnout. Social Forces, 86: 1513-1528.
5. Mary Jo Nolin and Chris Chapman. (1997). Adult Civic Involvement in the United States. NCES 97-906. U.S. Department of Education: National Center for Education Statistics.
6. A principal components analysis supported the inclusion of the seven items in an index score, as they all loaded on the first and largest factor.
7. Mobilization, Participation, and Democracy in America. Englewood Cliffs, NJ: Prentice Hall. Raymond E. Wolfinger and Steven J. Rosenstone. (1980). Who Votes? New Haven, CT: Yale University Press. See also Nolin & Chapman (1997), op. cit.
8. I adjusted the participation scores by means of a linear multiple regression analysis that predicted each person’s index score from marital-parental group membership, age and age squared, sex, educational attainment, employment status, household income, race and ethnicity, and immigrant status. The adjusted scores were derived by holding each of these covariates constant at its mean value in the overall sample.
9. A study by Christine Nord and Jerry West, using the same NHES data base analyzed here, found that school involvement of biological parents was not the same across family types and that the involvement of stepparents was generally lower than that of biological parents. Christine W. Nord & Jerry West. (2001). Fathers' and Mothers' Involvement in Their Children's Schools by Family Type and Resident Status. Statistical Analysis Report. Washington, DC: U.S. Department of Education: National Center for Education Statistics.
10. Herbert F. Weisberg. (1987). The demographics of a new voting gap. Public Opinion Quarterly, Vol. 51:3, 335-343. Laura Stoker & M. Kent Jennings. (1995). Life-cycle transitions and political participation: The case of marriage. American Political Science Review, Vol. 59:2, 421-433. Harold L. Wilensky. (2002). Rich Democracies: Political Economy, Public Policy, and Performance. Berkeley, CA: University of California Press.