Highlights
- Very low fertility rates are becoming increasingly normal across the globe, with most countries having birth rates between 1.4 and 1.9 children per woman. Post This
- Countries with birth rates above 1.6 or 1.7 children per woman experienced fertility declines. Countries with birth rates below that saw more stability or even increases. Post This
By now most readers are aware that U.S. birth rates have fallen to all-time lows. Early data for 2019 suggest that this slide is likely to continue. Those interested in demography more generally may also be aware that birth rates are falling in other countries. Most recently, reports of Finland’s baby bust have made headlines. Why are birth rates plummeting across so many countries?
Before the “why” question can be answered, it’s important to get a handle on the scope and scale of the decline. Where is fertility falling? Is the decline more severe in some places than in others?
To answer that question, I’ve put together the most up-to-date database of fertility statistics available anywhere, covering 61 countries for recent years. Major sources like the World Bank and the United Nations are only updated through 2017; I have updated through 2018 where data is available, and where year-to-date 2019 data is available, I’ve estimated what 2019 fertility rates are likely to be.
The data shows that very low fertility rates are becoming increasingly normal across the globe. Current declines are probably not just cyclical, but likely reflect a “new normal” with most countries having birth rates between 1.4 and 1.9 children per woman.
Presenting 61 countries’ fertility rates in a single graph is not feasible. Instead, below I show the average annual change in each country’s birth rate from 2007 to the latest data (2017, 2018, or 2019) for a variety of countries, grouped by various regional or historic ties. The groups are arranged from left to right, with the highest fertility region as of 2007 (the Middle East and North Africa) at the left, and the lowest-fertility region as of 2007 (East Asia) at the right.
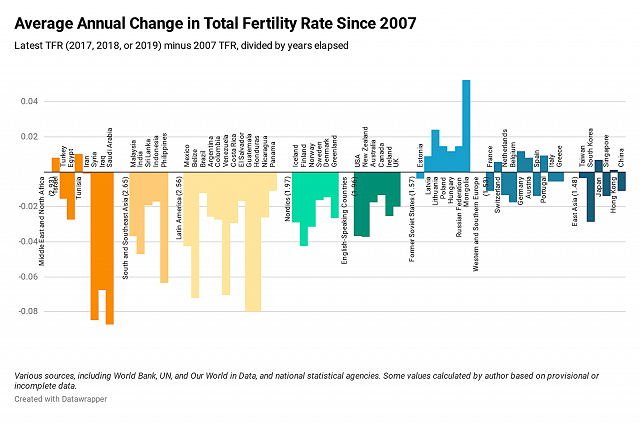
As the figure shows, fertility fell the most in the highest-fertility regions, and it rose somewhat in lower-fertility regions. Put in statistical terms, the amount of variation among these 61 countries declined by half between 2007 and 2019. This was not only because of fertility declines among very-high-fertility countries, what demographers call “demographic transition,” but also because of modest fertility increases in low-fertility countries, and declines in medium-fertility countries.
The graph below illustrates this even more clearly, with the change in fertility rates since 2007 compared to actual fertility in 2007.
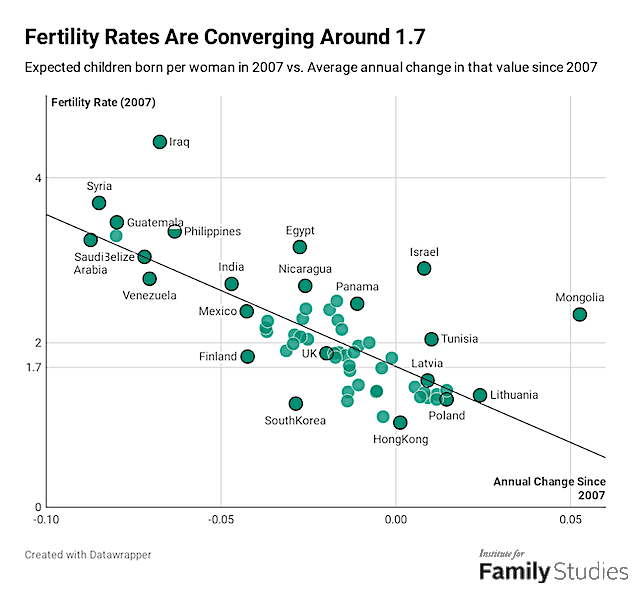
Basically, countries with birth rates above 1.6 or 1.7 children per woman experienced fertility declines. Countries with birth rates below that saw more stability or even increases. What we appear to be seeing is a global convergence around fertility rates of 1.6 or 1.7 children.
This is not just a rich-world phenomenon. Birth rates in Mexico are around 1.9 to 2 kids per woman, so below the rate needed to sustain Mexico’s current population levels. Brazil’s birth rate is even lower, at 1.75, similar to Colombia’s at 1.77. Costa Rica is even lower, at 1.66. El Salvador, Argentina, and Venezuela are all just barely “breaking even” demographically. Other countries like Guatemala are higher but falling fast.
Across the Pacific, Sri Lanka, Bangladesh, and India are all around 2 or 2.2 kids per woman, while Malaysia has fallen to about 1.8. Thailand is even lower, at 1.5 kids per woman. Even Muslim countries like Turkey (2), Iran (1.8), and Tunisia (2.1) have near-replacement fertility, with speedy declines still ongoing.
Data for Africa is not sufficiently recent or high-quality to speak to very recent declines, but the trend there is also one of extremely rapid fertility decline, as I’ve written previously for IFS.
Thus, while recent fertility declines are not globally shared, they nonetheless point to an emerging norm of below-replacement fertility. We should not expect that the future will be one of growing populations, but rather one where most countries face serious demographic challenges.
Why is this happening? A few specific country examples may help point the way to an explanation.
Asian Tigers? Asian Pandas.
Many commentators use “Japan” as a by-word for demographic decline. But while Japan does face demographic challenges, it appears to be rising to meet them. Today, Japan actually has the highest fertility rate in East Asia, once we exclude the hermit kingdom of North Korea and the post-Soviet nomads of Mongolia.
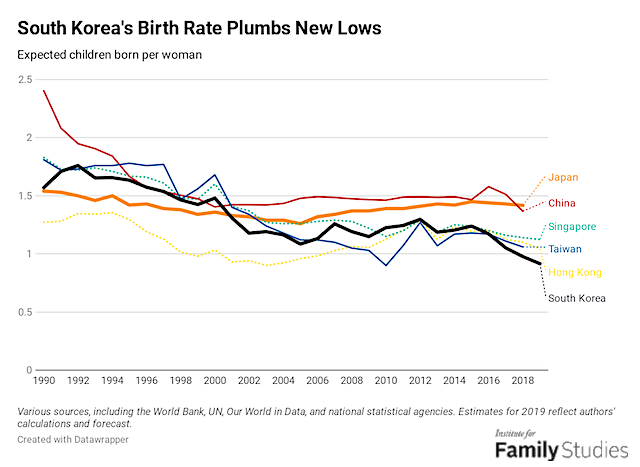
Japan’s birth rates have been rising for some time. But beyond this rise, Japan has been getting creative to encourage births at all levels of society and is also successfully opening its doors to immigration. The perception of Japan as an ultra-low fertility, unfriendly-to-families, closed-to-immigration country is increasingly outdated.
On the other hand, Korea’s birth rate has plummeted to astonishingly low levels. If current trends hold, 2019 will report birth rates of around 0.92 expected children per woman, one of the lowest numbers ever reported by any country. Korea is trying to boost fertility rates, but their efforts are misguided and failing. Without serious labor reforms aimed at de-prioritizing “workist” career-competitiveness, Korea’s birth rate will continue to fall.
Korea’s case is unique, but the forces driving it, especially the unchecked power of the labor market over peoples’ lives, are shared with many countries.
The Mongol Horde
The universality of the forces reducing fertility is sometimes obscured by impressive-looking short-term fluctuations. And indeed, elsewhere in Asia, there’s a baby boom.
Mongolians averaged 7.3 kids per woman in 1974: a figure that fell to 2.5 by 1993, and below 2 by 2005. But then, something happened. Since 2005, Mongolian birth rates have rocketed upwards and now stand at around three children per woman. The consequences of this baby boom on school crowding, the challenges it poses for children’s health in Mongolia’s highly polluted capital, and the role played by improving rural maternal health services, have all been featured in international media. More generally, Mongolia’s economic boom driven by growing global, and especially Chinese, investment almost certainly had a role to play. Meanwhile, this fertility gain has not come at the expense of gender equality, as Mongolian women remain better educated than Mongolian men, and are making more and more inroads into traditionally male-dominated fields.
But while Mongolia’s case appears unique for Asia, offering some cause for hope, that optimism would be misplaced. Mongolia’s true peers are not other Asian countries, but other post-Soviet countries.
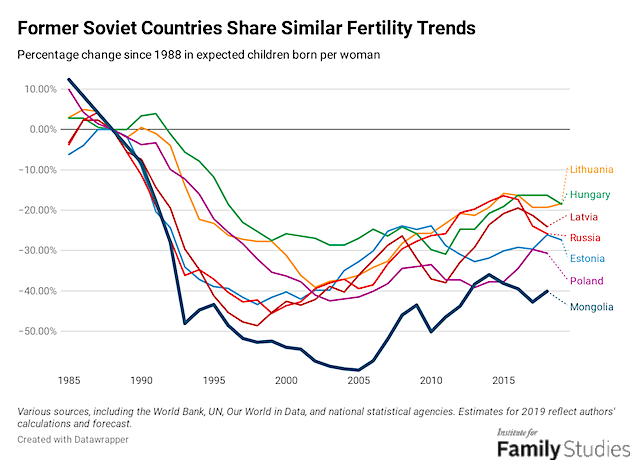
Many former Soviet countries had a “baby bust” just like Mongolia did during the 1990s due to the chaos and disruption of the fall of communism. And many of those countries are now enjoying a recovery to fertility rates nearer their 1980s levels, just as Mongolia is. These recoveries probably will not last forever, and indeed may already be fizzling out. In time, despite its currently-impressive fertility trends, it is most likely that Mongolia’s “Soviet recovery boom” will fade, and the gradual forces of economic modernization will push its birth rates down to similar levels seen in other countries.
Modern Greenland
Economic modernization is a funny thing. Sometimes it comes naturally, sometimes, it’s forced. One of the most striking cases of “engineered modernity” comes not from the Soviet Union, but from Greenland, a constituent part of the Kingdom of Denmark.
Denmark had owned and colonized Greenland for a long time when, starting in 1950, the government embarked on an ambitious project to modernize the people of Greenland: economically of course, but also, perhaps especially, culturally. Notably, this was despite a 1946 decision by Greenland’s native leaders to reject modernization.
The first step of modernity was to introduce the sale of alcohol into Greenland, with predictably deleterious effects. Then, from 1952 to 1968, the Danish government embarked on a massive campaign of housing and infrastructure expansion designed to encourage Greenlanders to move out of small, traditional villages, into a few urban centers, where public services could be more easily delivered. The most infamous of these new housing developments was Blok P, an enormous and notorious public housing project that eventually housed nearly 1% of the total population of Greenland, but few of them happily. During the modernization period, education was also switched to Danish. Political modernity arrived as well, with the usual democratic, socialist, liberal, and rightist parties forming during the 1970s.
Overall, Denmark’s aggressive modernization campaign provoked anti-colonial resistance and helped lead to the movement for Greenlandic home rule in 1979, self-government in 2009, and perhaps someday independence.
But that wasn’t all. Fatefully, in 1967, the Danish government began a major campaign to promote IUDs. The results of aggressive modernization, intentional cultural disruption, and aggressive contraceptive campaigns were as might be expected.
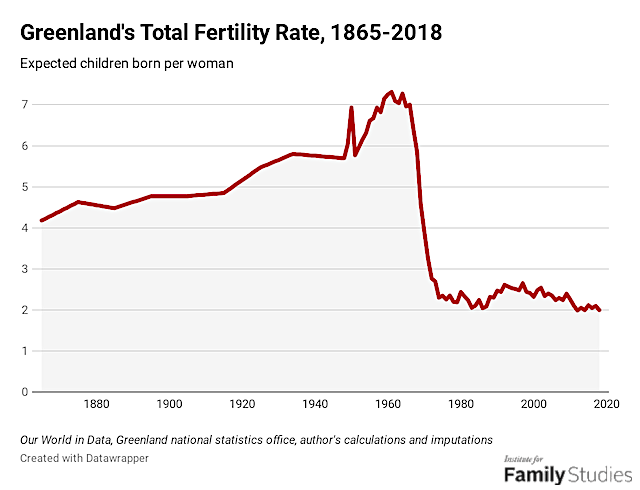
In the span of just eight years from 1966 to 1974, fertility rates fell abruptly from 7 children per woman to 2.3. This is the fastest fertility transition in human history.
Of course, Greenland’s fertility did not fall to extremely low levels and remains near replacement rate today, although it is gradually declining. But the country is an example of the striking influence that can be exerted by a determined government. A full-court-press of political reform, urbanization, healthcare, education, and industrial transformation radically altered Greenlandic fertility. Not even China’s one-child policy was so dramatically successful at reaching its goals and, certainly, no pro-natal initiative has ever been so successful.
People of the Promise
So, if a government can engineer a cultural change to reduce fertility, can it do the opposite?
In any discussion of fertility, one country comes up a lot: Israel. Virtually alone among rich countries, Israel has a fertility rate of around 3 children per woman. And this is not just thanks to a minority group within Israel, like Muslims. The majority-population of Israeli Jews have birth rates around 3 kids per woman. While the ultra-Orthodox Jews have the most children, even secular Jews have above-replacement-rate fertility in Israel.
This also cannot be solely attributed to the general policy environment. While Israel does encourage births, many previously very-high-fertility groups in Israel, like the Druze, now have near-replacement-rate fertility. Rather, Israel’s high birth rates appear to be in some sense a product of cultural norms within the Israeli Jewish community.
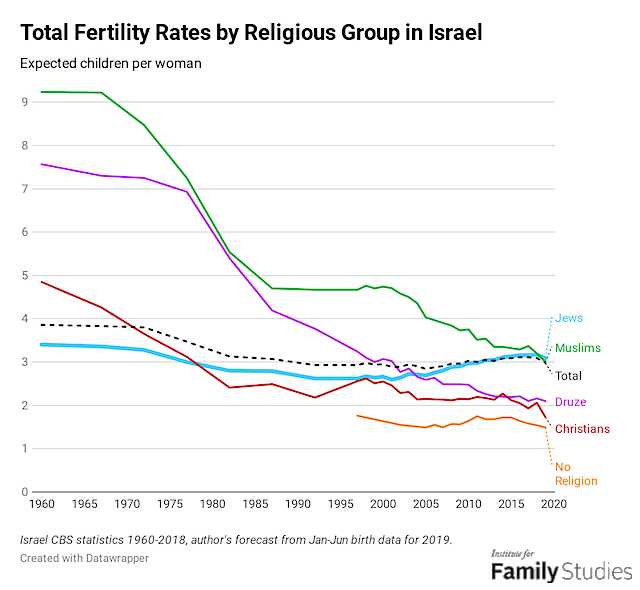
However, if early data for 2019 is to be believed, Israeli Jewish fertility is now falling as well. If even Israel’s pro-family culture and aggressively pro-natal policies can’t stave off fertility declines, what can?
Looking Forward
Birth rates are falling. Around the world, it seems like fertility rates are likely to reach stability between 1.4 and 1.9 kids per woman, and most plausibly around 1.6 to 1.7. This is considerably below the assumptions of most population forecasting bodies like the United Nations, which typically assumes stable fertility rates of between 1.8 and 2.1. In other words, the ongoing global fertility slump suggests that the future human population will be smaller than expected.
Lyman Stone is a Research Fellow at the Institute for Family Studies, and an Adjunct Fellow at the American Enterprise Institute.
*Photo credit: Shutterstock