Highlights
- Before the 1990s, the safety net overwhelmingly targeted the bottom fifth of the income distribution; now, about half of the spending goes elsewhere. Post This
- As Republicans push for changes to the safety net, we should bear in mind the existing trend toward directing aid to the working poor and think about how we want the safety net to work. Post This
Richard V. Reeves and Christopher Pulliam of the Brookings Institution have a new report about the “middle-class safety net,” pointing out that a rising share of means-tested spending is directed at people between the 20th and 80th percentiles of income.
It draws attention to a phenomenon that others have noted before, and that ought to inform thinking about future welfare reforms: America’s focus on encouraging work and boosts to the safety net, such as Obamacare’s Medicaid expansion, have entailed directing aid to the working poor rather than the extremely poor. Whether this is good or bad depends on what effects one thinks these policy changes have—whether work requirements successfully induce people to get jobs, whether aid to the working poor comes at the expense of helping the truly needy, and whether it creates intolerably large marriage penalties.
Reeves’ report sticks to the basics, mainly providing a series of charts that break down total spending from a combined set of programs (including health care, nutrition, cash assistance, housing, etc.). This is one of the most striking, showing the percentage of spending directed at each income quintile:
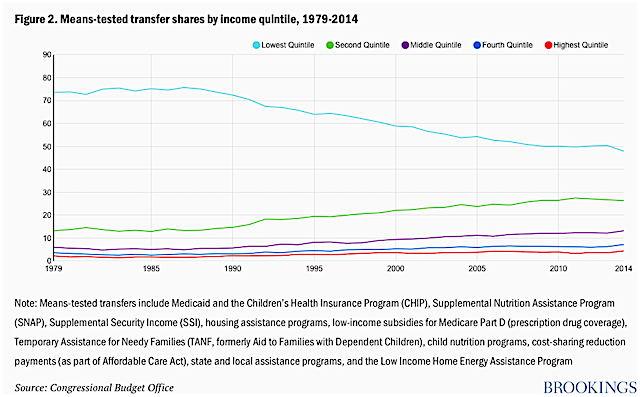
Before the 1990s, the safety net overwhelmingly targeted the bottom fifth of the income distribution; now, about half of the spending goes elsewhere.
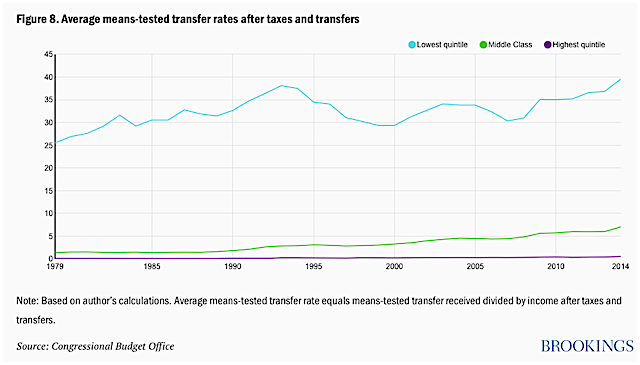
And here’s a somewhat different perspective, showing welfare spending as a percentage of total income for each of these groups. Since higher-income groups make more of their own money and get less in welfare benefits, the gap is far bigger this way:
Of course, both of the above charts could mean very different things depending on what’s happening to overall means-tested spending—which the Reeves' study does not report. However, he points to a previous Brookings report that focuses on children and fleshes out some of the key details (though it counts a somewhat different set of programs, including tax credits).
Here is one important chart from that report, depicting per-child spending on kids based on their poverty level. Spending increased by comparable dollar amounts for all kids under 150% of the poverty line. But kids in wealthier families saw much bigger percentage increases—and while virtually no welfare spending reached above 150% of the poverty line before, today some welfare spending does.
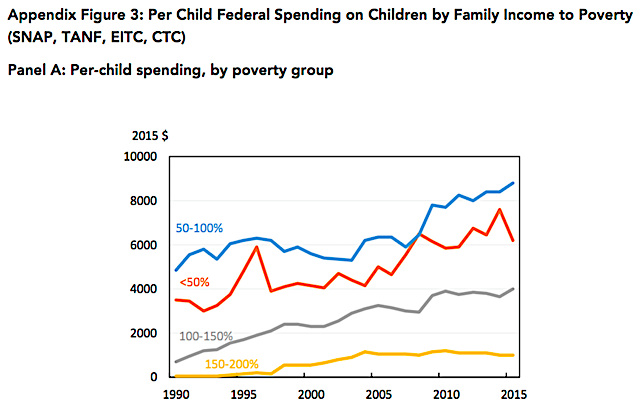
Source: Hoynes and Whitmore-Schanzenbach, Safety Net Investments in Children,
Brookings Papers on Economic Activity: BPEA Conference Drafts, March 2018.
The difference is starker looking at families with and without earnings. The latter still get far more help per child—hardly surprising because families with earnings include the middle class and rich—but the amount has actually fallen, while per-child spending on families with earnings has grown substantially.
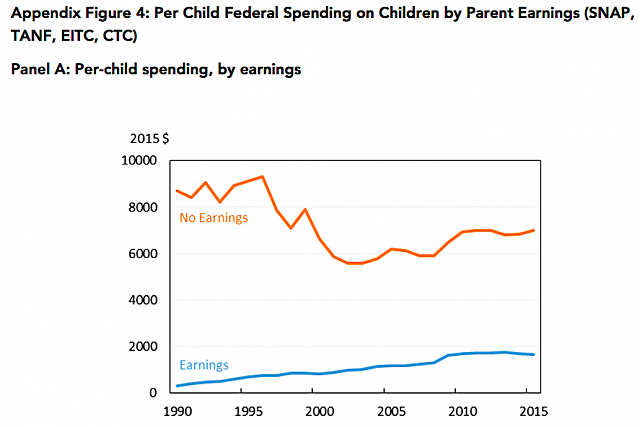
Source: Hoynes and Whitmore-Schanzenbach, Safety Net Investments in Children,
Brookings Papers on Economic Activity: BPEA Conference Drafts, March 2018.
These findings also gel with poverty researcher Robert Moffitt’s widely cited 2014 Population Association lecture, in which he pointed out that welfare spending had been redistributed, with less going to the non-employed and single-parent families, and more going to the working, elderly, and disabled.
Reeves’ piece, by the way, comes amid two important semantic debates, over how to define the “middle class” and “poverty.” Regarding the former, Reeves (as mentioned) uses the middle 60% of the income distribution, which seems fair enough. But then again so does Pew’s definition, which defines middle class as making two-thirds to twice the median income.
Both definitions have their advantages. For example, if you want to know whether the middle class is “growing” or “shrinking,” Reeves is not your guy, because his middle class is always exactly 60% of the population—no matter how much inequality grows (or doesn’t). But Pew’s definition has some weird statistical quirks, such as that the median income of the middle class is quite different from the median income of the general population (which was used to determine who was in the middle class to begin with!).
On “poverty,” meanwhile, experts generally agree that the official poverty measure is garbage—it counts some safety-net programs but not others as income—but there’s a heated debate about which alternative is best. Bruce D. Meyer and James X. Sullivan of the American Enterprise Institute, for example, have touted a consumption-based measure that shows dramatic reductions in poverty in recent decades (a measure employed by the Trump administration’s Council of Economic Advisers), while others prefer income-based measures such as the Supplemental Poverty Measure. Reeves does not define poverty, though he implicitly treats the bottom 20% of income-earners as below the middle class.
But regardless of which measures we use, as Republicans push for changes to the safety net, we should bear in mind the existing trend toward directing aid to the working poor and think about how we want the safety net to work.
Robert VerBruggen is a deputy managing editor of National Review.