Highlights
The UK shares many wonderful characteristics with the US: Language. Freedom of speech. Opportunity. A reliable legal system. Political checks and balances. The ability to boot out any government with whom we get fed up.
Alas, among the less wonderful characteristics we share are similar patterns of family breakdown that are among the highest in the world.
To study this issue, UK analysts have one major advantage over their US peers: we can draw not only on large-scale longitudinal datasets but also on the government’s comprehensive annual data. Each year our outstanding Office for National Statistics (ONS) collates and publishes national data on marriage, divorce, and other family measures and characteristics.
And whereas there is a long tradition of publicly funded university-based analysis and peer review in the US, most of the output here in the UK—with notable exceptions—has come only within the last decade from independent think tanks such as the Centre for Social Justice, One Plus One, Institute for Fiscal Studies, and the most recent addition, the Marriage Foundation.
Two years ago, high court judge Sir Paul Coleridge set up the Marriage Foundation in response to his years of experience with warring and dysfunctional families. As Communications Director for the foundation, I have produced a stream of media-friendly research papers based on Census, national, and panel survey data.
I think our most interesting work to date involves our analysis of patterns of divorce.
Every year since 1963, ONS has published detailed data on the number of divorces by duration of marriage, previous marital status, whether they were granted to the husband or wife, the number and age of children involved, and so on.
This has allowed me to map the number of divorces by duration of marriage—after one year, two years, three years—onto the number of marriages that took place one year ago, two years ago, three years ago, etc. It’s not an exact overlap, but it’s close enough.
This “year of marriage” method provides really useful and interesting information on what happens over time to each cohort of couples who married in any given year.
Almost all of the change in UK divorce rates since the 1960s is due to what happens in the first five to ten years of marriage.
Today the ONS released the divorce statistics for 2012. Both numbers and rates were largely unchanged, less than 1% up on 2011. When the figures are released, reporters usually focus on whether the number of divorces and the divorce rate (divorces per thousand married couple population) have risen or fallen since the previous year.
The problem with these measures is that the number of divorces isn’t the only thing changing from year to year. The underlying marriage population changes, too. So we’re never really comparing like with like. The result is that reported annual “divorce rates” tend to jump about erratically and are more or less impossible to interpret sensibly.
This doesn’t stop the media and commentators, usually lawyers and counsellors, from being very creative in their thinking! “Divorce down due to recession.” “Divorce up due to recession.” Look at the commentary for yourself this week and see if you can figure what they would have said if divorce rates had changed more sharply.
As it turns out, one of the analyses I produced last year using the “year of marriage” method showed conclusively that neither boom nor bust influence divorce rates in any meaningful or predictable way.
Looking at how the trajectories of divorce vary, or not, by year of marriage has shed a great deal of light on divorce trends. Here are some surprising examples:
- Almost all of the change in UK divorce rates since the 1960s is due to what happens in the first five to ten years of marriage.
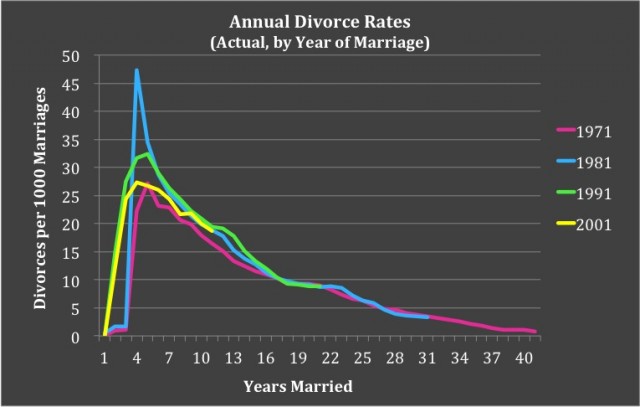
Source: Marriage Foundation analysis of Office for National Statistics data.
- As you can see in the above chart, divorce rates have peaked around years three to six for every year of marriage since the 1960s. The seven-year itch is, and always has been, a Hollywood myth.
- The overall divorce rate is very clearly on its way down, and has been for sixteen years. But all of this decline was driven by a drop in divorces in the early years of marriage—early divorce rates among couples who married in 2007 are one-third lower than the rates for couples who married in 1991, the riskiest year in which to have gotten married—and all involves fewer divorces granted to wives. So either new wives are more tolerant or new husbands are doing better! My own interpretation draws on Scott Stanley’s insightful theory of commitment: reduced social pressure to marry means relatively fewer “sliders” and more “deciders.” Therefore more of the men who marry really mean it.
- After couples pass their tenth anniversary, a further 20% of every marriage cohort will get divorced, regardless of whether couples married in 1965, 1975, 1985, 1995, etc., and regardless of how many divorced in the first ten years. The probability of divorce after ten years of marriage has hardly changed since the 1960s, as the below chart shows, meaning that some amount of breakdown after the tenth anniversary is highly predictable and therefore probably inevitable. Amazingly, it also implies that the nature of established marriage has not changed in fifty years.
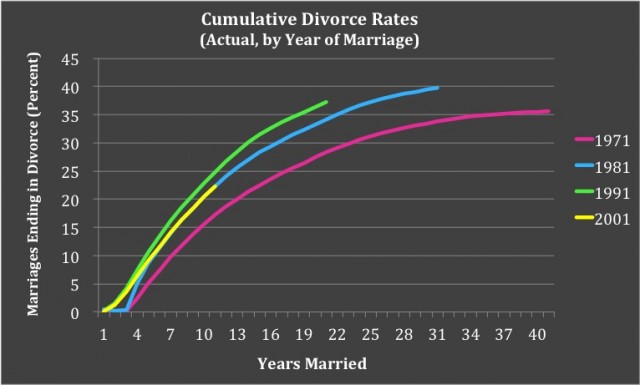
Source: Marriage Foundation analysis of Office for National Statistics data.
- Finally, and surprisingly, second marriages have a much lower divorce trajectory than first marriages—but this turns out to be an artifact of age. Second marriages of the same age do worse. But the headline finding gives second marriages a bit of extra encouragement!
There are more findings in this vein and more to come. All of our original reports and press releases are available at the Marriage Foundation website.
So what’s the divorce statistic that everyone cares most about—the predicted lifetime divorce rate in the UK for a couple getting married today? Based on current trends and adjusting for the estimated 10 to 15% of weddings that take place overseas, the answer is 39%.
Harry Benson is Communications Director of the UK-based Marriage Foundation.