Highlights
- The ACS projection is useful for understanding today’s divorce risks, but it comes with an important caveat: it assumes that current conditions will hold steady into the future Post This
- My best estimate is that about 42% of first marriages today will eventually end in divorce if current patterns persist. Post This
- SIPP data tend to underreport divorces, with high levels of missing data and widespread imputation of divorce dates. So divorce estimates from SIPP should be interpreted with caution. Post This
We crave neat numbers for messy truths. Is marriage really a ‘coin toss’? You’ve probably heard the gloomy claim: “Half of all marriages end in divorce.” It’s short, dramatic, and memorable, but it oversimplifies a far more tangled reality. Measuring divorce is harder than it looks. Switch datasets or tweak the metric, and the story can swing from a “divorce epidemic” to a “divorce decline” in just a handful of charts. So how do we pin down the share of marriages that actually fall apart?
One common measure is the “divorce-to-marriage ratio”—simply dividing the number of divorces by the number of marriages in the same year. At first glance, it seems intuitive: for every 100 weddings this year, how many divorces took place? But this seemingly straightforward ratio has a fundamental flaw. The divorces in the numerator come from marriages that began years or even decades earlier, while the marriages in the denominator include only this year’s newlyweds. These two numbers don’t align and can’t meaningfully estimate the probability of divorce because they apply to entirely different cohorts. When marriage rates decline, the ratio can spike, not because marriages are failing more often, but because fewer people are getting married in the first place.
To get a clearer picture, demographers turn to two other rates. The “crude divorce rate” counts divorces per 1,000 people in the whole population. But that’s like counting car crashes per 1,000 residents—including toddlers, cyclists, and people who don’t even own cars. To zoom in on those behind the wheel, the “refined divorce rate” focuses on divorces per 1,000 married women, capturing those truly at risk of splitting up. Yet even this measure can give a distorted picture because the composition of who gets married has shifted dramatically over time.
Today, people are marrying later: the median age at first marriage has risen to about 30 for men and 28 for women. Fewer people remarry after divorce, and second or third marriages—historically more prone to dissolution—now make up a smaller share of all marriages. Meanwhile, younger adults and disadvantaged groups, who tend to have higher divorce risks, are more likely to delay or avoid marriage altogether. The denominator of the refined divorce rate—married women—is therefore made up of a more selective and more stable group: couples who were less likely to divorce to begin with. In the end, the refined divorce rate doesn’t just tell us how often marriages crash—it also reflects who still chooses to drive.
Measuring divorce is harder than it looks. Switch datasets or tweak the metric, and the story can swing from a 'divorce epidemic' to a 'divorce decline' in just a handful of charts.
But what most people really want to know is simpler: what proportion of marriages will end in divorce? One of the most widely-cited claims is that about half of marriages eventually do. That number comes from demographers’ analyses in the 1980s and 1990s (see, for example, here or here) using a tool borrowed from mortality research: the “life table.” Originally developed to chart how many people in a birth cohort survive to each age, life tables apply the same logic to estimate the "survival" of marriages: how many unions endure and how many dissolve at each year of marriage. Like death risks, divorce risks aren’t evenly spread across life—they tend to peak in the early years of marriage (the so-called “seven-year itch”) and taper off for longer-lasting unions.
To see how this plays out over the life of real marriages, we can follow groups of couples who married in the same or adjacent years—known as marriage cohorts—and track how many of their unions have ended in divorce as the years go by. Think of it like starting with 100 couples who all married in the same year and checking in on each anniversary to see what share have split up. Using data from the 2023 Survey of Income and Program Participation (SIPP), I calculate how the chance of divorce accumulates over time, a measure called the cumulative divorce probability. An earlier analysis using SIPP 2001 and 2004 data is available here.
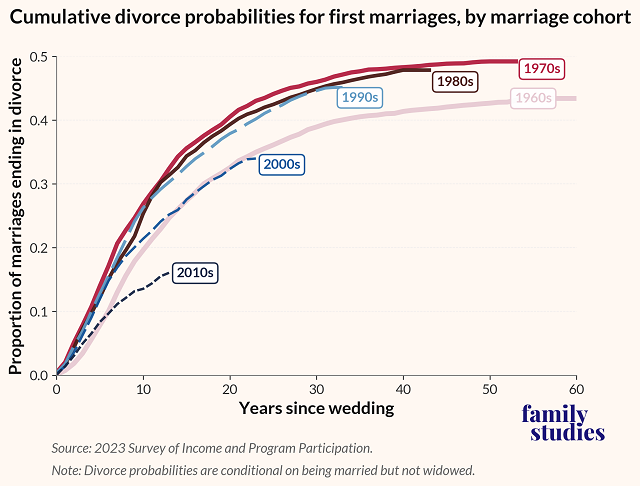
For couples married in the 1970s, 1980s, and 1990s, nearly half of marriages had ended in divorce by the end of the observation window—roughly 50 years for the 1970s cohort and 30 years for the 1990s cohort. By contrast, the oldest cohort from the 1960s shows lower cumulative divorce probabilities across all durations. For the most recent cohorts from the 2010s, probabilities appear even lower, but this likely reflects their shorter marriage histories rather than clear evidence of greater marital stability. Moreover, as demographers Sheela Kennedy and Steven Ruggles note, SIPP data tend to underreport divorces, with high levels of missing data and widespread imputation of divorce dates. Divorce estimates from SIPP should therefore be interpreted with caution.
The downside of this cohort approach is time. If we follow actual groups of marriages from their wedding day through their eventual outcomes, we must wait decades to get complete results for those newlyweds. By the time we know that 45% of 1990s marriages eventually ended in divorce, that information reflects couples who dated in the era of landline phones and built their marriages through the rise of the internet, the Great Recession, and the COVID-19 pandemic. For understanding today’s marriages, these findings already feel like ancient history.
As a workaround, instead of waiting decades, we can combine the proportions of divorces among newlyweds, couples married one year, those married two years, and so on, to create an artificial “typical” marriage experience. These duration-specific divorce risks are then strung together to calculate cumulative divorce probabilities, projecting how many marriages would end in divorce if today’s newlyweds faced those same risks throughout their lives. This hypothetical cohort reflects the divorce risks that real couples at different stages of marriage are experiencing right now. In the end, we get an answer to the question of what proportion of marriages today will eventually end in divorce, but it’s based on a cohort that never actually existed.
The following figure illustrates these hypothetical trajectories using data from the American Community Survey (ACS) in 2008, 2015, and 2023. Each curve shows the projected share of first marriages that would end in divorce at different years of marriage if couples experienced the divorce risks observed in those years. For example, the 2023 curve suggests that nearly 16% of first marriages would dissolve after 10 years, 36% after 30 years, and 42% after 60 years. Compared to 2008 and 2015, the 2023 curve sits lower across all durations, hinting at a decline in divorce risk.
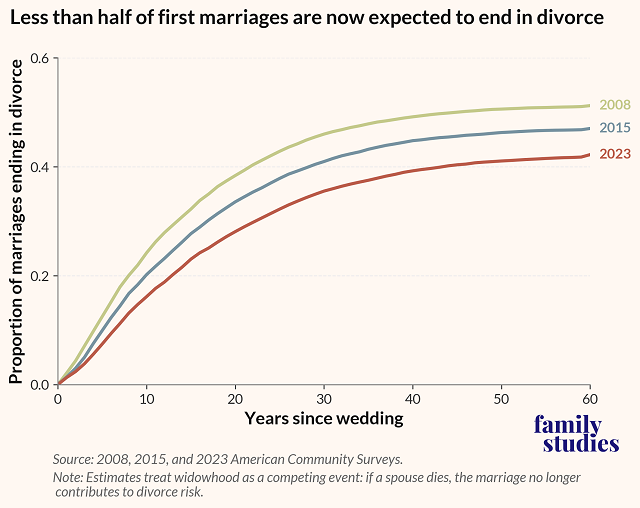
This kind of projection is useful for understanding today’s divorce risks, but it comes with an important caveat: it assumes that current conditions will hold steady into the future. It’s like estimating how far you could drive on a full tank of gas based on your car’s current miles-per-gallon efficiency. That figure tells you the total distance you’d cover if you kept driving under the same test conditions—flat roads, mild weather, no traffic—that were used to calculate it. But in real life, hills, traffic jams, or heavy cargo can push your actual range higher or lower.
Similarly, the cumulative divorce probabilities from a life table estimate what share of marriages would end in divorce if couples moved through marriage facing today’s risks at every stage—but actual risks may rise or fall as social and economic conditions evolve.
Still, with those caveats in mind, my best estimate is that about 42% of first marriages today will eventually end in divorce if current patterns persist. So, no, marriage isn’t a coin toss. It’s a moving target—and our divorce measures aren’t precision tools; they’re calibrated on assumptions as fluid as the institution itself.
Yifeng Wan is a postdoctoral research associate at the University of Virginia.