Highlights
- Both the ACS and CDC data show that the true age-controlled fertility rate for married women is falling, but that the general fertility rate for these women is rising. How can this be? Post This
- The recent decline in the share of children born out of wedlock isn’t due to married people being more fertile; it’s thanks to the large size of the Millennial generation combined with our extremely low youth fertility. Post This
We all know that there’s a “baby bust” in America. But of the kids who are born, are we seeing any change in the kind of household they’re born into? Is the story that Americans are having fewer kids, but that the kids who are born are growing up in more stable, secure families? This is a fascinating suggestion and seems like an intuitive guess, but it turns out to be not quite correct.
Marriage Is in Decline, Thanks to Delays
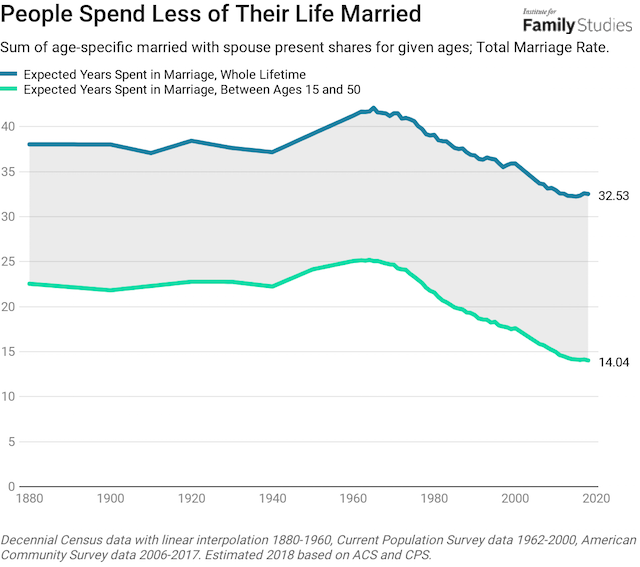
Broadly speaking, marriage is on the outs in America. While different analysts use different metrics, I prefer to look at how many years a person could expect to spend in marriage with their spouse present, if current marriage rates held constant through their life. This figure can be estimated all the way back to 1880 and has shown a sharp decline over the last few decades, although the last few years appear to have leveled out a bit.
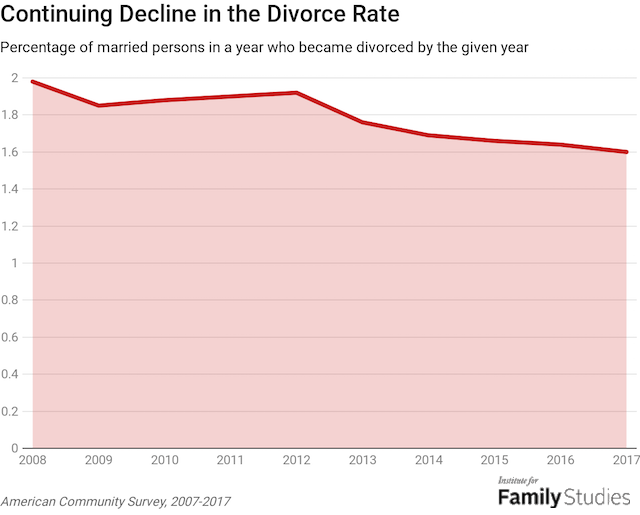
Crucially, this decline in years spent in marriage is not driven by an epidemic of divorce. We can use data from the American Community Survey (ACS) to estimate the share of married people in a given year who got divorced in the following year. That estimation of the divorce rate is trending downwards, which means the marriages that do occur today are more stable than marriages entered into a few decades ago.
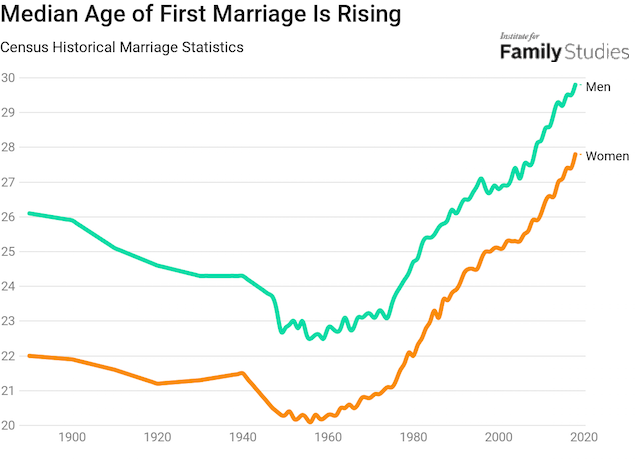
In other words, people spend less time married, not because of more divorce, but because they get married later in life. The graph below shows the median age of first marriage in America for men and women.
But even as marriage seems to be in something of a cultural decline, the story is a bit different for births in wedlock. The share of births to unmarried moms dropped appreciably in 2016 and, while it probably rose a bit in 2017, the trend still seems to be gradually down. I say “probably” rose in 2017 because California has stopped reporting the marital status of mothers to the CDC, and so data for California has to be estimated.
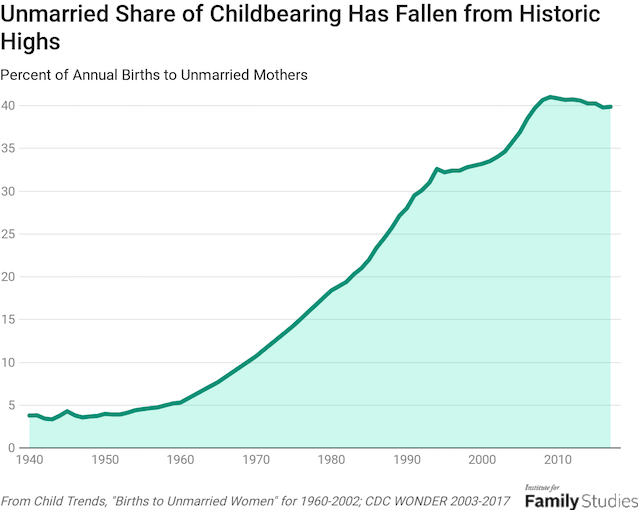
It’s hard to say exactly why we are seeing more births in wedlock alongside declining fertile years spent in marriage. If marriage is becoming less common, but births in wedlock are rising, then it must be the case that birth rates among married people are rising more than (or falling less than) birth rates among unmarried people.
Married People Are Not Having a Baby Boom
Frustratingly, the data sources we have on marital status and childbearing don’t lend overwhelming support to this notion because they all have problems: either they don’t tell us the baseline for how many married women there are (CDC), or they misclassify a large number of births as married (ACS). The best solution is to combine the Census’ detailed population estimates by sex and age with ACS estimates of the married share of the population.1 The resulting general fertility rates are shown below.
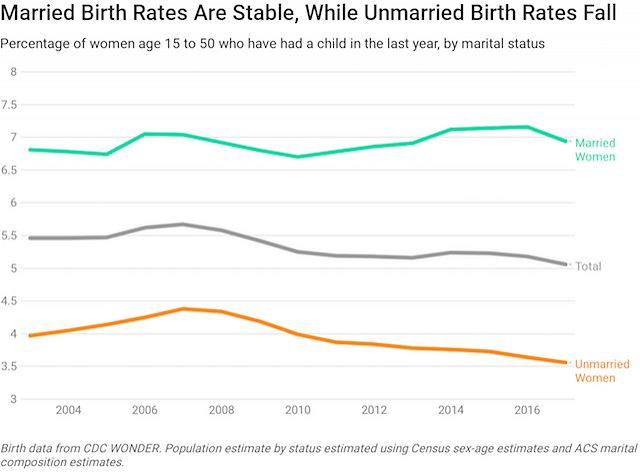
Fertility appears to be falling for unmarried individuals but rising for married individuals! That would seem to tidily explain how married births can be rising while marriage itself is not. But alas, this trend may not be likely to continue. If—instead of calculating the general fertility rate—we calculate the fully-age-controlled total fertility rate, it turns out that married fertility rates have not been doing so well. The problem can be shown succinctly in the graph below.2
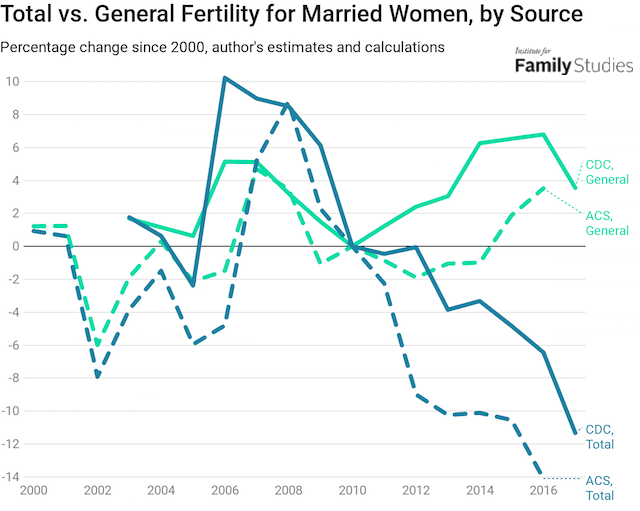
Both the ACS and CDC data show that the true age-controlled fertility rate for married women is falling, but that the general fertility rate for these women is rising. How can this be?
Simply put, the general fertility rate is a flawed metric. When there are more women in low-fertility years (under 20, over 40), but within the group of women counted for general fertility, estimates of birth rates will be artificially reduced. When there are more women in high-fertility years, fertility is artificially increased.
That’s exactly what has happened recently. The graph below shows the share of women aged 15 to 50 who were between ages 20 and 40 in a given year; basically, it shows what share of any fertility-age women were in peak fertility years.
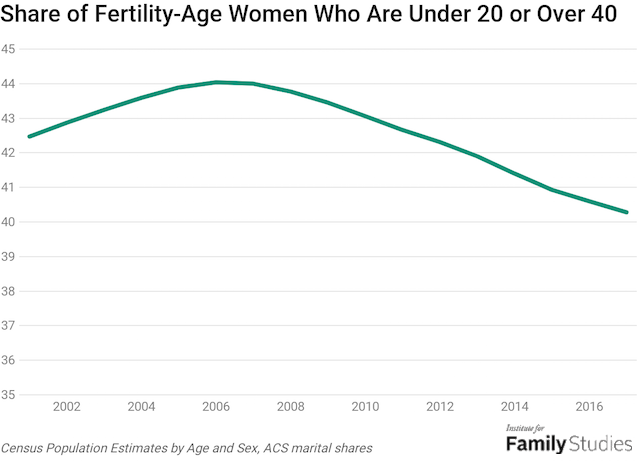
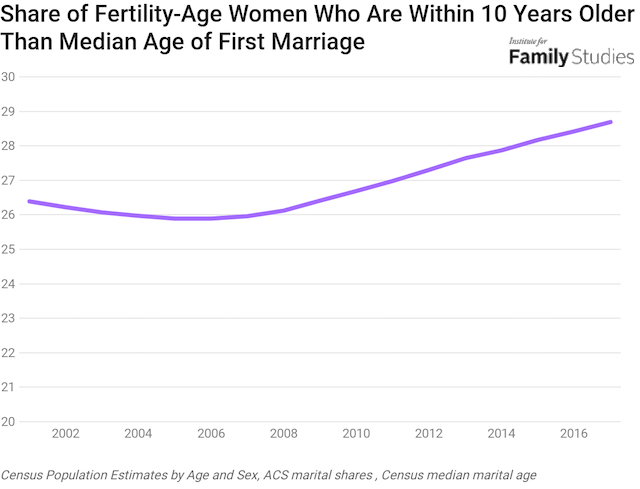
As you can see, a growing share of fertility-age women is currently near peak fertility. But in terms of skewing the general fertility rate figures, a growing share of women have probably just gotten married. The first 10 years after marriage tend to be associated with very high birth rates for women, so if we look at the share of women aged 15 to 50 who are 10 years or less past than the median age of first marriage, this should give us an idea of how many women are truly at peak fertility. And it turns out, this group of recently married women is huge right now. Because of the very large size of the Millennial cohort, the number of women who are probably recently married and in the right age group and life- cycle stage to be experiencing high fertility is very large.
This is very bad news for U.S. fertility. We are experiencing very low births despite a very favorable set of underlying demographic conditions. The Millennial cohort should have been associated with a huge tidal wave of births right about now. Instead, births are falling. The general fertility rate doesn’t pick up this specific cohort effect, so it depicts rising marital fertility; the total fertility rate, however, does pick up the effect, so it shows marital fertility falling. And when the Millennial cohort moves on, the number of births is going to plummet even further.
In other words, the recent decline in the share of children born out of wedlock isn’t due to married people being more fertile; it’s thanks to the large size of the Millennial generation combined with our extremely low youth fertility. Since young fertility is more likely to be unmarried fertility, it looks as if marital childbearing is reclaiming ground—when really, there’s no such luck.
But while marital childbearing is being boosted thanks to cohort effects, the family a child is born into is just one part of the equation. What happens to kids’ families after they are born matters a lot to their overall well-being. Are we seeing more parents stay together and raise their kids in a married household?
Are Kids Living with Their Married Parents?
The Current Population Survey tracks the parental status of children. We can look at the share of minors who are living in the same household as at least one married couple, and also living in the same household as two biological or adoptive parents. This is, basically, a measure of “intact families.” It’s possible in some households that the married couple the child co-resides with does not include the two people who are identified as the child’s biological or adoptive parents, but it’s probably not a very common case.
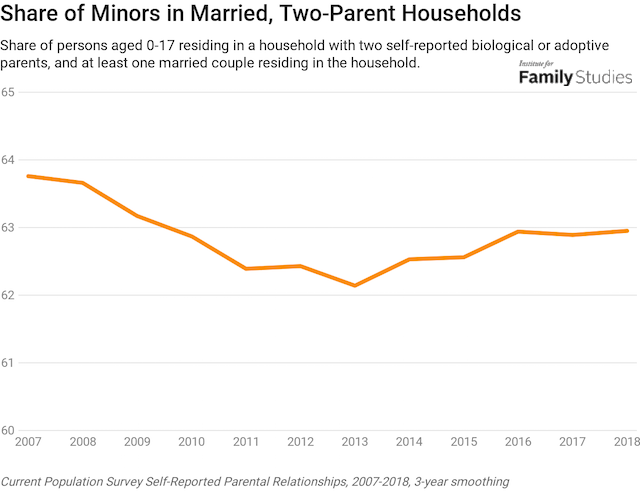
At face value, it looks like the share of kids living in married, two-parent households is rising. That’s good news for raising kids in stable families! But the story is more complicated than that. First of all, the changes are small: we’re talking about fractions of a percentage point. But more importantly, there are large differences by the child’s age in how the odds of living with two married parents have changed. The graph below shows the change in the share of kids living with two married parents since 2007, broken out by age group.
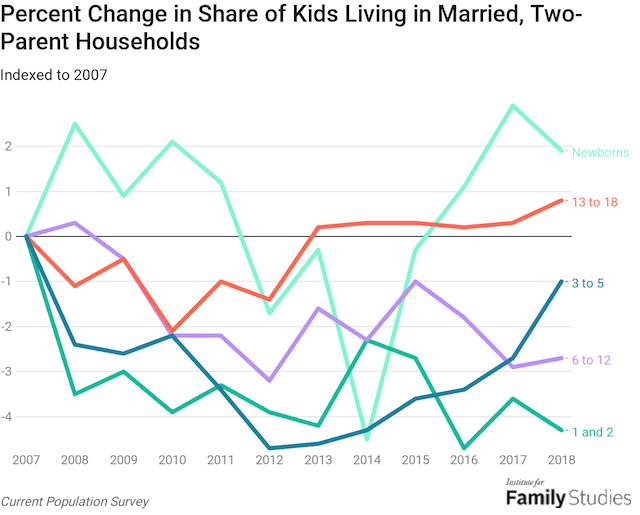
For newborns and kids in high school, it looks like we are seeing more residence with two married parents. There’s also a recent rise for kids ages 3 to 5, but it’s still below 2007 levels. But for kids who are 1 or 2 years old or ages 6 to 12, the share living in intact households continues to fall. It’s not clear what might be driving these trends. It seems strange for trends for middle schoolers to go one way, and for high schoolers to go another, but that’s my point. There is no general trend observed across age groups, which suggests the changes we do observe for specific ages are probably just statistical noise. It’s much too early to say conclusively that there’s any serious shift back towards two-parent married households as the trend for families.
Things Look Good Now, But the Future is Uncertain
Overall, looking at marriage and childbearing, there are some reasons to be hopeful. More kids are being born in married-parent families, and, overall, more kids are living in households with married parents. Divorce is down, which is another good portent for kids in married families. This is good news for child development and family patterns in America.
However, this is still a very recent development, and it doesn’t look extremely likely to persist. Higher births in wedlock aren’t due to some genuine uptick in marital fertility, but due to the very large size of the Millennial cohort, which is just now hitting peak marital fertility years. This trend will pass, which suggests that in 10 or 15 years, we may see a resumption of the decline in births in wedlock as a share of total births. When we look at the family structure in which kids are growing up, there are some signs of optimism, but they are very modest: kids of many ages continue to see less stable family conditions, and there’s no clear indicator of a positive trend in this analysis.
But, for now, we’re living in a time that looks hopeful for the well-being of families. Births increasingly occur to married moms, and kids are increasingly being raised by married parents. Whatever the future may hold, today looks pretty bright.
Lyman Stone is a Research Fellow at the Institute for Family Studies, and an Adjunct Fellow at the American Enterprise Institute. W. Bradford Wilcox is Professor of Sociology at the University of Virginia, a Senior Fellow of the Institute for Family Studies, and a Visiting Scholar at the American Enterprise Institute.
1. This makes it possible to calculate the general fertility rate for married and unmarried women, using timely data on marital status from the ACS, timely data on population from Census estimates, and timely data on births-by-marital status from the CDC. The general fertility rate is one of the most common birth rate indicators and is simply the percentage of women in a given age range (in this case, ages 15 to 50) who have had a child in the last year.
2. This presents the percentage change in total and general fertility rates since 2010 for married women, as indicated by the CDC data, and the unadjusted outputs from the ACS.