
Executive Summary
The decades-long retreat from married-parent families has ended. The share of children living with married parents fell to a low of 64% in 2012 and has climbed to 66% today.
Still, slightly more than 4 in 10 children will spend time outside of an intact married family, in a range of family forms. This family instability can be as predictive of child outcomes like school failure, college graduation, depression, and incarceration as other variables—such as race and poverty—that often get more attention in federal and state surveys and reports.
Consequently, federal and state agencies should require that key surveys and reports on children—from the National Assessment of Educational Progress (NAEP) to the CDC’s Youth Risk Behavior Survey and the federal America’s Children indicators report—routinely measure family structure in detail and report how it is linked to the outcomes that matter most for the rising generation.
Introduction
In the wake of the 1960s, the family forms in which children were raised changed dramatically—with the share of kids growing up in single-mother, stepfamily, and single-father homes all surging. More recently, a growing number of children are being raised in cohabiting and same-sex families. But little is known about the current character of family diversity.
To remedy this, this research brief from the Institute for Family Studies and the American Enterprise Institute paints a portrait of the current character of children’s family arrangements. This portrait is timely because American families have stabilized in the last decade—largely as a consequence of declines in divorce. It is also timely because a large body of social science indicates that differences in family structure are tied to differences in children’s academic, behavioral, and mental-health outcomes—and to their risks of being exposed to poverty and abuse. Finally, this work is important because public policy research, conversations, and decisions at the federal and state levels should be informed by up-to-date knowledge of family trends in America.
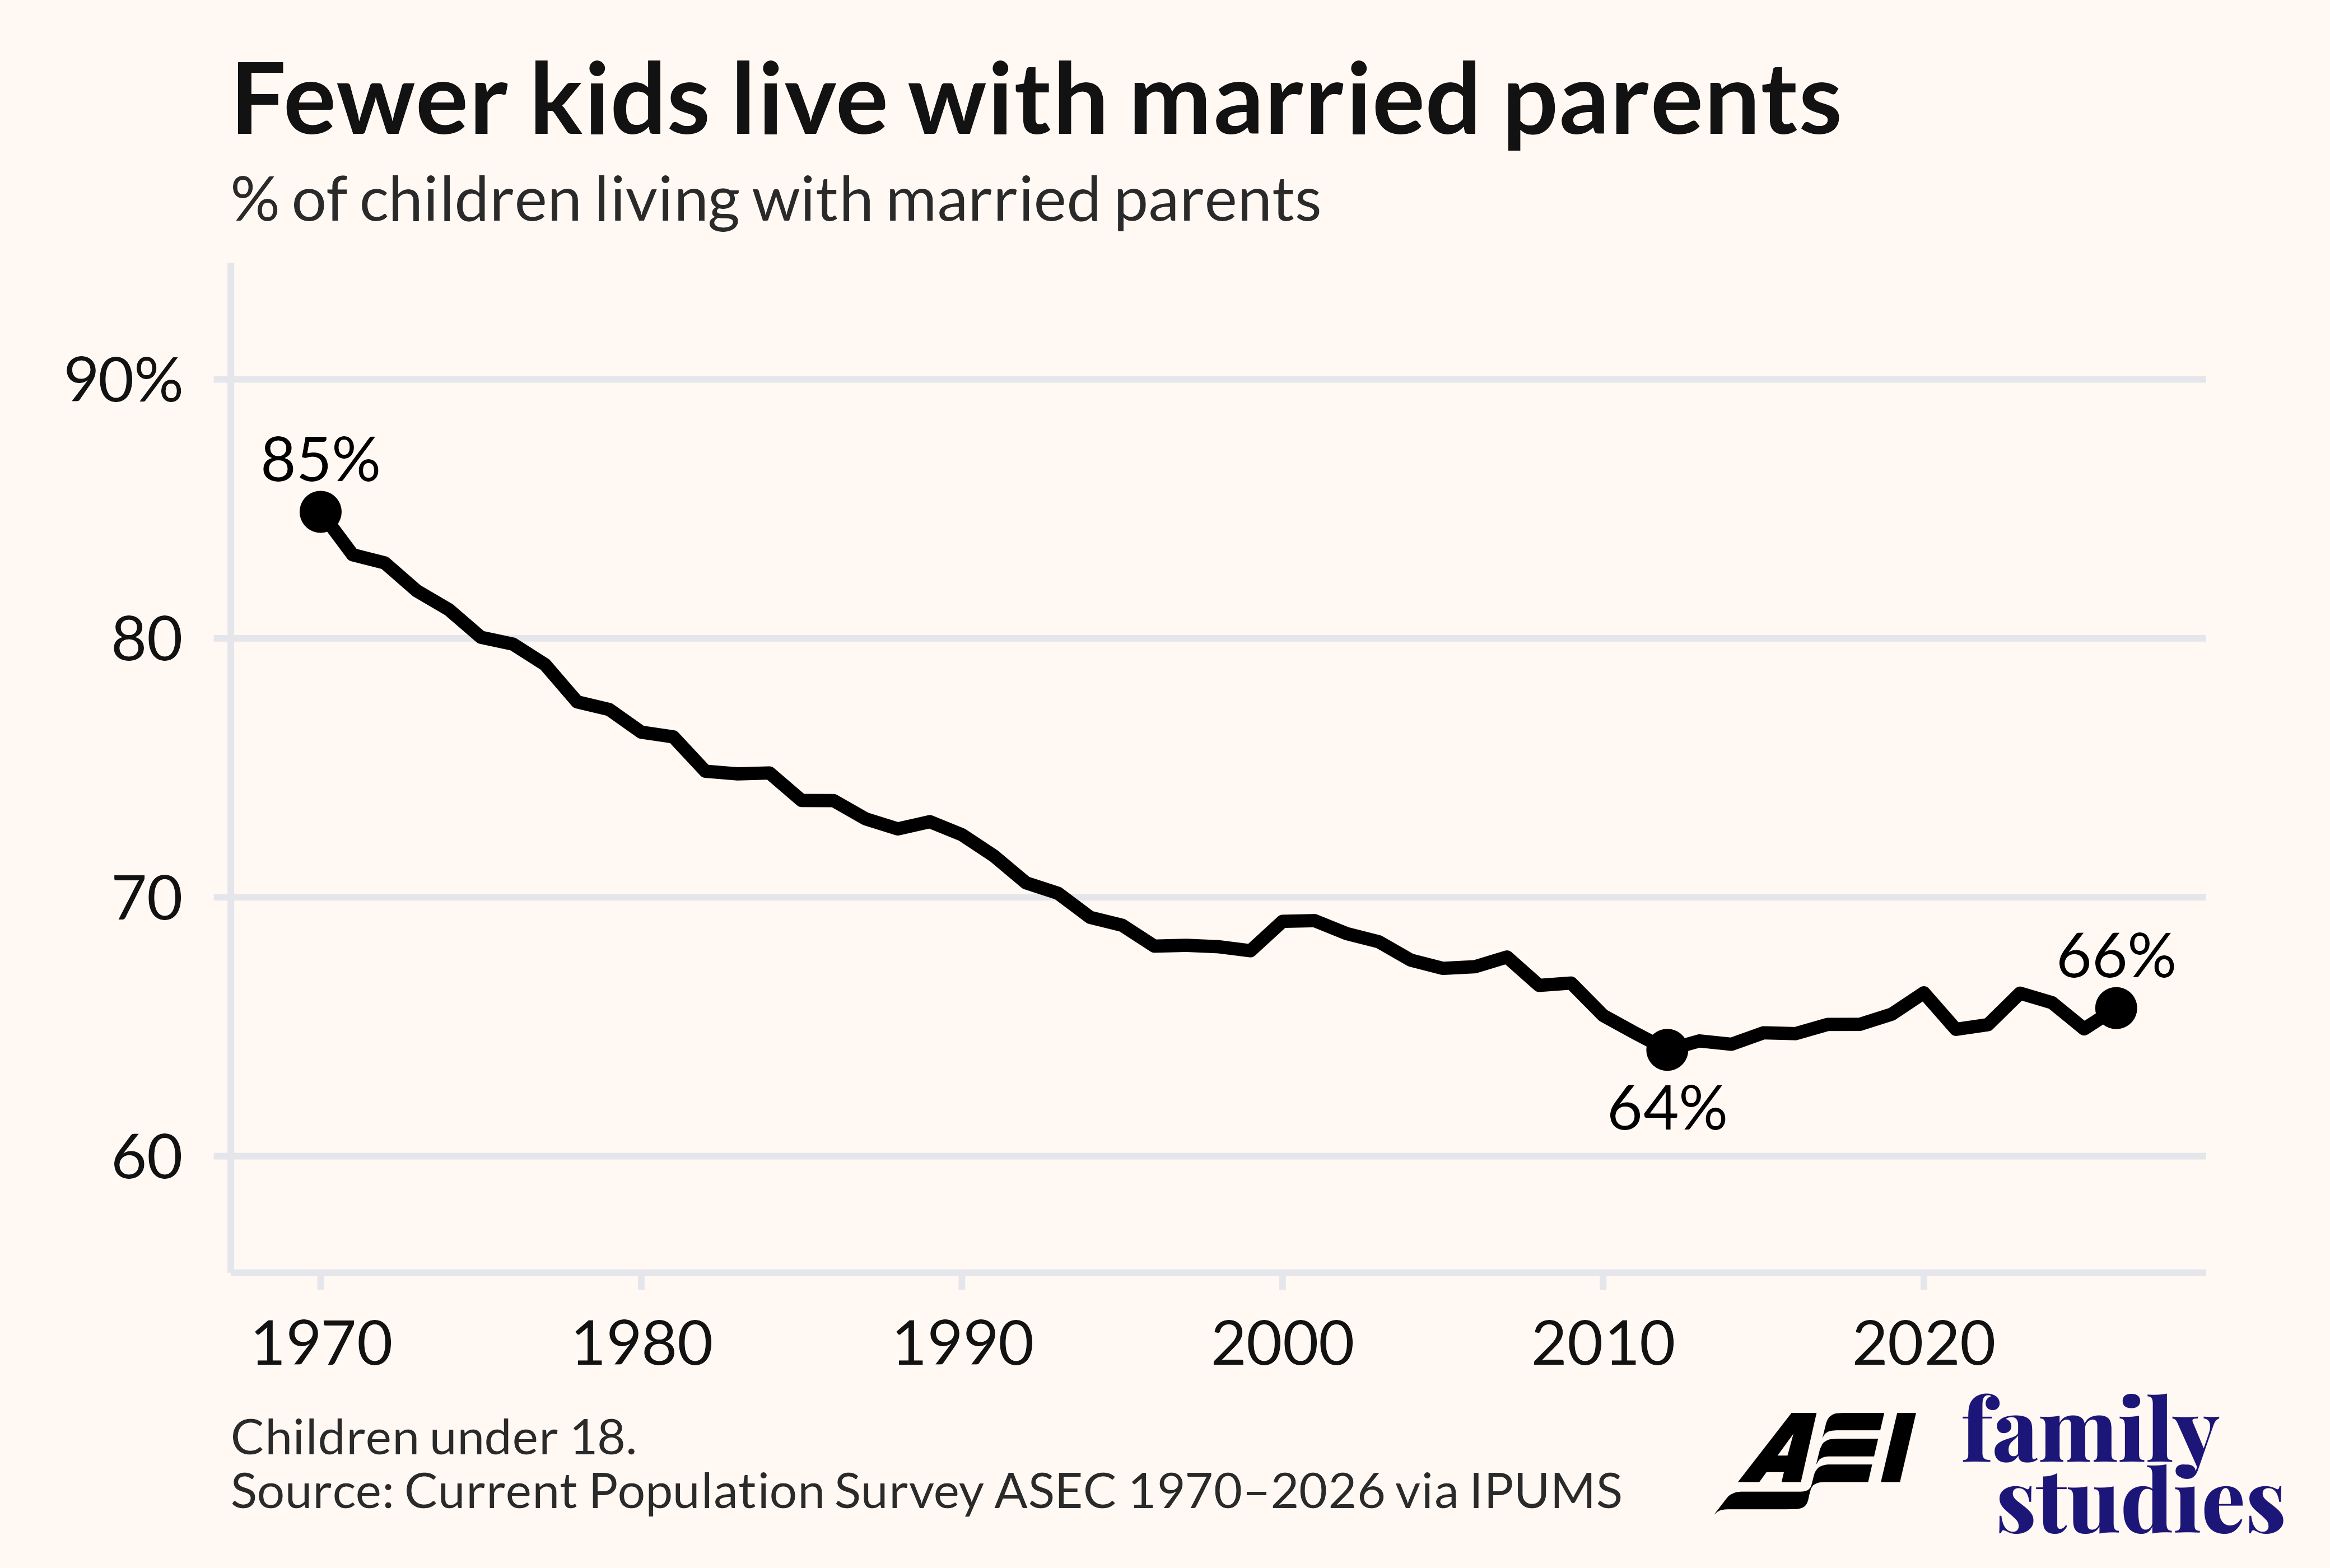
Figure 1. Share of children living with married parents, 1970–2026
In the wake of cultural, policy, and economic changes associated with the 1960s, the intact, married family lost ground as the primary form of family life for children in the United States. Divorce and nonmarital childbearing rose, as did cohabitation, all of which meant that American children were exposed to a wider array of family forms.
This “family revolution,” however, seems to have largely come to a halt in the last decade or so. As American family life has become more selective for Americans who are more intent on having children, and for those who are more religious, educated, and affluent, one consequence is that the movement away from the intact, married family for children has reversed: the nation has witnessed a small uptick in the share of children being raised in intact families since 2012. The share of kids in a married-parent family bottomed out at 64% in 2012 and now stands at 66 percent. Likewise, the share in an intact, biological married family for their whole childhood rose from 51% in 2014 to 54% in 2024. The bottom line: a majority of American children are now being raised in stable, married families.
The stabilization of family life has also been true for more disadvantaged Americans. For instance, among lower-income families, the share of children with married parents went from 38% in 2012 to 40% now. For black children, it rose from 33% to 37% over the same time period. Nevertheless, large class gaps emerge, with 86% of children from upper-income families living with married parents, versus 40% from lower-income families.
Why These Family Trends Matter
These trends matter in part because children are more likely to flourish when they are raised in intact, married families. The research suggests that children in households headed by unmarried adults (with parents or residents who are not legally married) and with adults who are not biologically related to them in the household are often more likely to struggle socially and emotionally—and in some cases to be exposed to a greater risk of abuse. Both family structure and marital status are also linked to children’s risk of growing up in poverty or experiencing financial insecurity.
For these reasons, government surveys would, ideally, collect data both on the marital status of the adults in children’s lives and how the adults in the home are related to the children. Accordingly, we recommend that government agencies collect detailed data on children’s current family structure.
It is especially valuable to break out trends by family structure because we know that different family forms are often linked to different outcomes for children. For instance, when it comes to child poverty, children in homes headed by a single mother are more likely to live in poverty (29%) than those in homes headed by a single father (14%) and those in a married-parent family (7%).
Likewise, the evidence suggests that children are markedly more likely to be abused in a cohabiting household headed by a biological parent and an unrelated adult than in a home headed by a single parent. Another study found that teens living with two cohabiting biological parents had more behavioral and emotional problems, on average, than those living with married biological parents, even after controlling for economic and parental resources. Finally, young men raised in adoptive homes are more likely to complete college, compared to children in single-parent homes.
Therefore, because child outcomes related to financial well-being, social and emotional well-being, and educational attainment often vary by family structure, surveys and public agencies should report these key child outcomes by the most prevalent family structures in the United States today.
Common Family Structures in the U.S.
Accordingly, in this brief, we rely on federal data to estimate the 10 most common family structures for children in the United States today. The estimates draw on monthly samples of the Current Population Survey (CPS), a survey jointly sponsored by the U.S. Census Bureau and the Bureau of Labor Statistics, for January of 2022 through August of 2026, accessed through the data integration service IPUMS.
Children include all those under age 18 and are defined as having married intact families if both biological parents are present and are married. A cohabiting intact household is defined as two biological, unmarried parents present. Cohabiting mother or father is defined as an unmarried biological mother or father with a partner who is not the biological parent, or an unmarried mother or father living with a partner who is not a parent to the child. A single mother or father household has one parent present and no cohabiting partner. A married stepfamily includes one biological parent and one adoptive or stepparent who are married. An adoptive family has two parents, at least one adoptive and neither biological. Two stepparents are households where both parents were marked as stepparents; this category is not visualized below. No parents present are households where no parents were identified. Same-sex parents are households where there were two parents of the same sex; this category overrides all others.
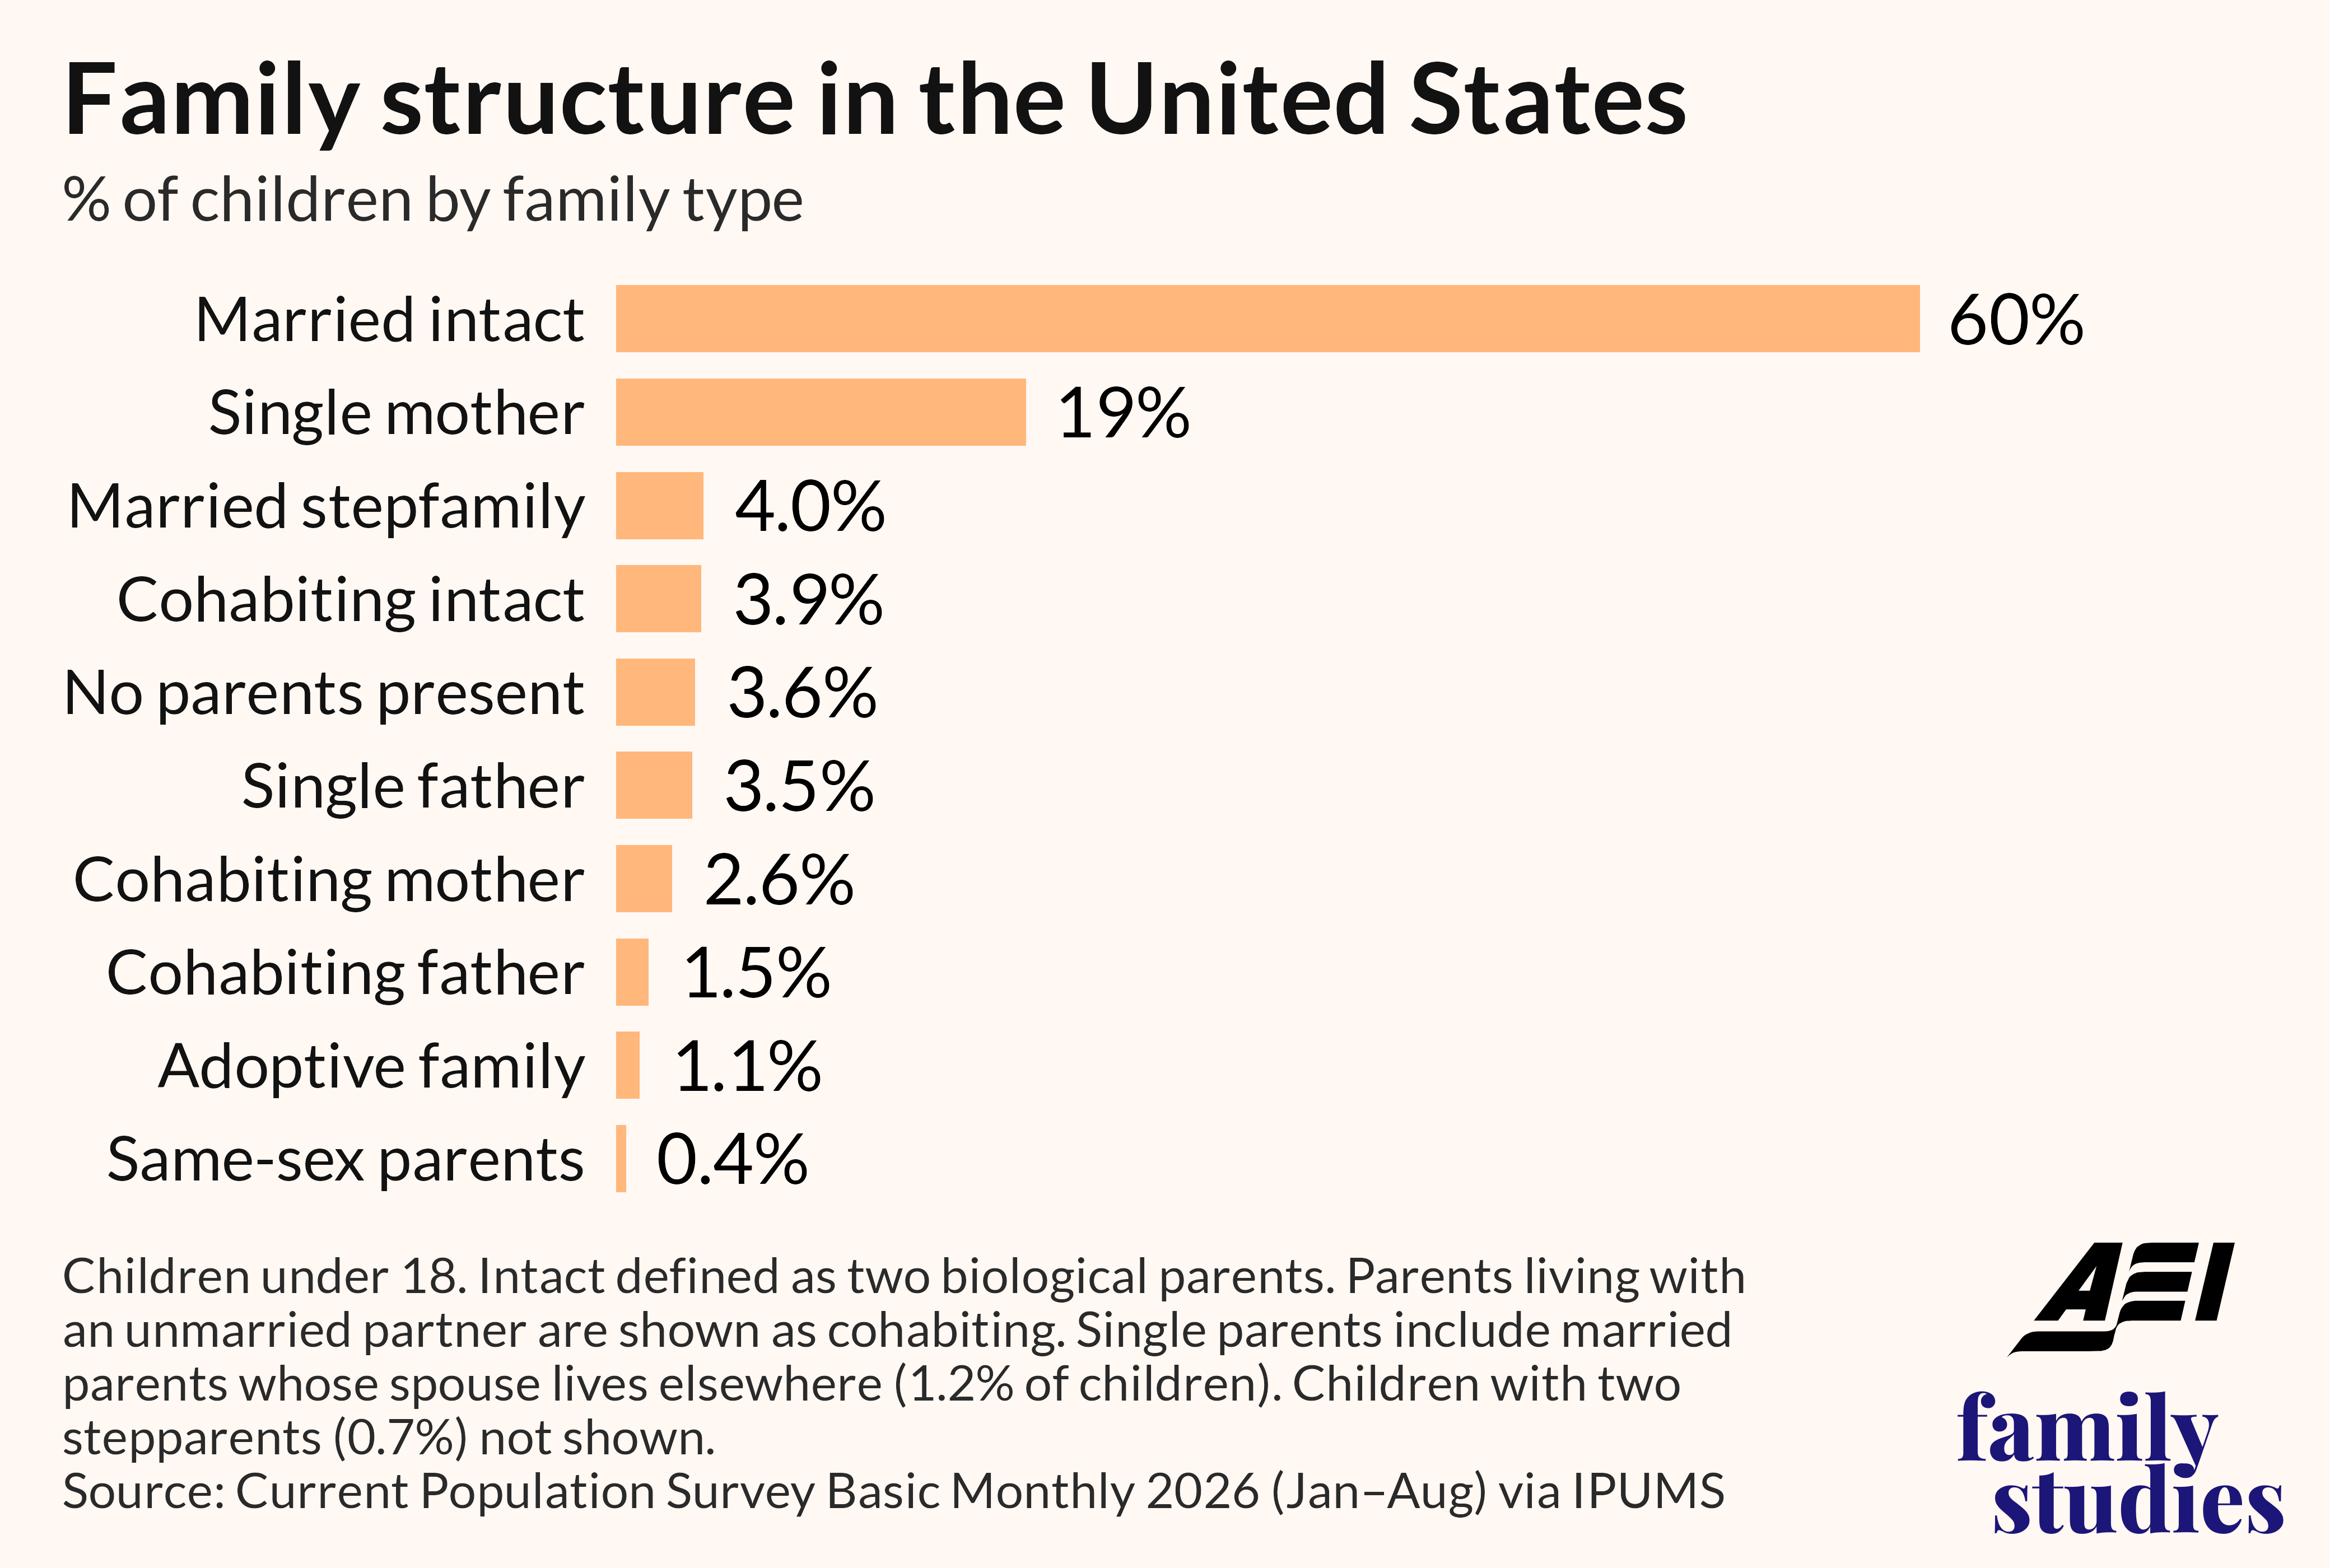
Figure 2. Child living arrangements in the United States, 2026
For children as a whole, we find that 6-in-10 (60%) are being raised by their own married, biological parents—this is the most common family arrangement in America by a wide margin. Almost 2-in-10 (19%) live in a home headed by a single mother, and another 3.5% live with a single father.
Beyond these family forms, children are spread across a wide range of other arrangements, none of which accounts for more than about 4% of children. For example, 4% live in a married stepfamily, and 3.9% live with their two biological parents who are cohabiting but not married. Slightly more than 4% are being raised by a cohabiting mother living with a partner unrelated to the child (2.6%) or a cohabiting father living with an unrelated partner (1.5%). Smaller shares are in adoptive families (1.1%), homes with two stepparents (0.7%), or same-sex-parent households (0.4%). Another 3.6% live with no parent at all—typically with grandparents, other relatives, or foster parents. Taken together, about 64% of children live with both of their biological parents. Nearly 27% live with just one of their parents, either alone or with that parent’s unmarried partner.
Children's family forms also vary by race, ethnicity, and socioeconomic status. To illustrate some of these variations, we report the six most common family forms for Asian, black, Hispanic, and white children, as well as low-, moderate-, and high-income children.
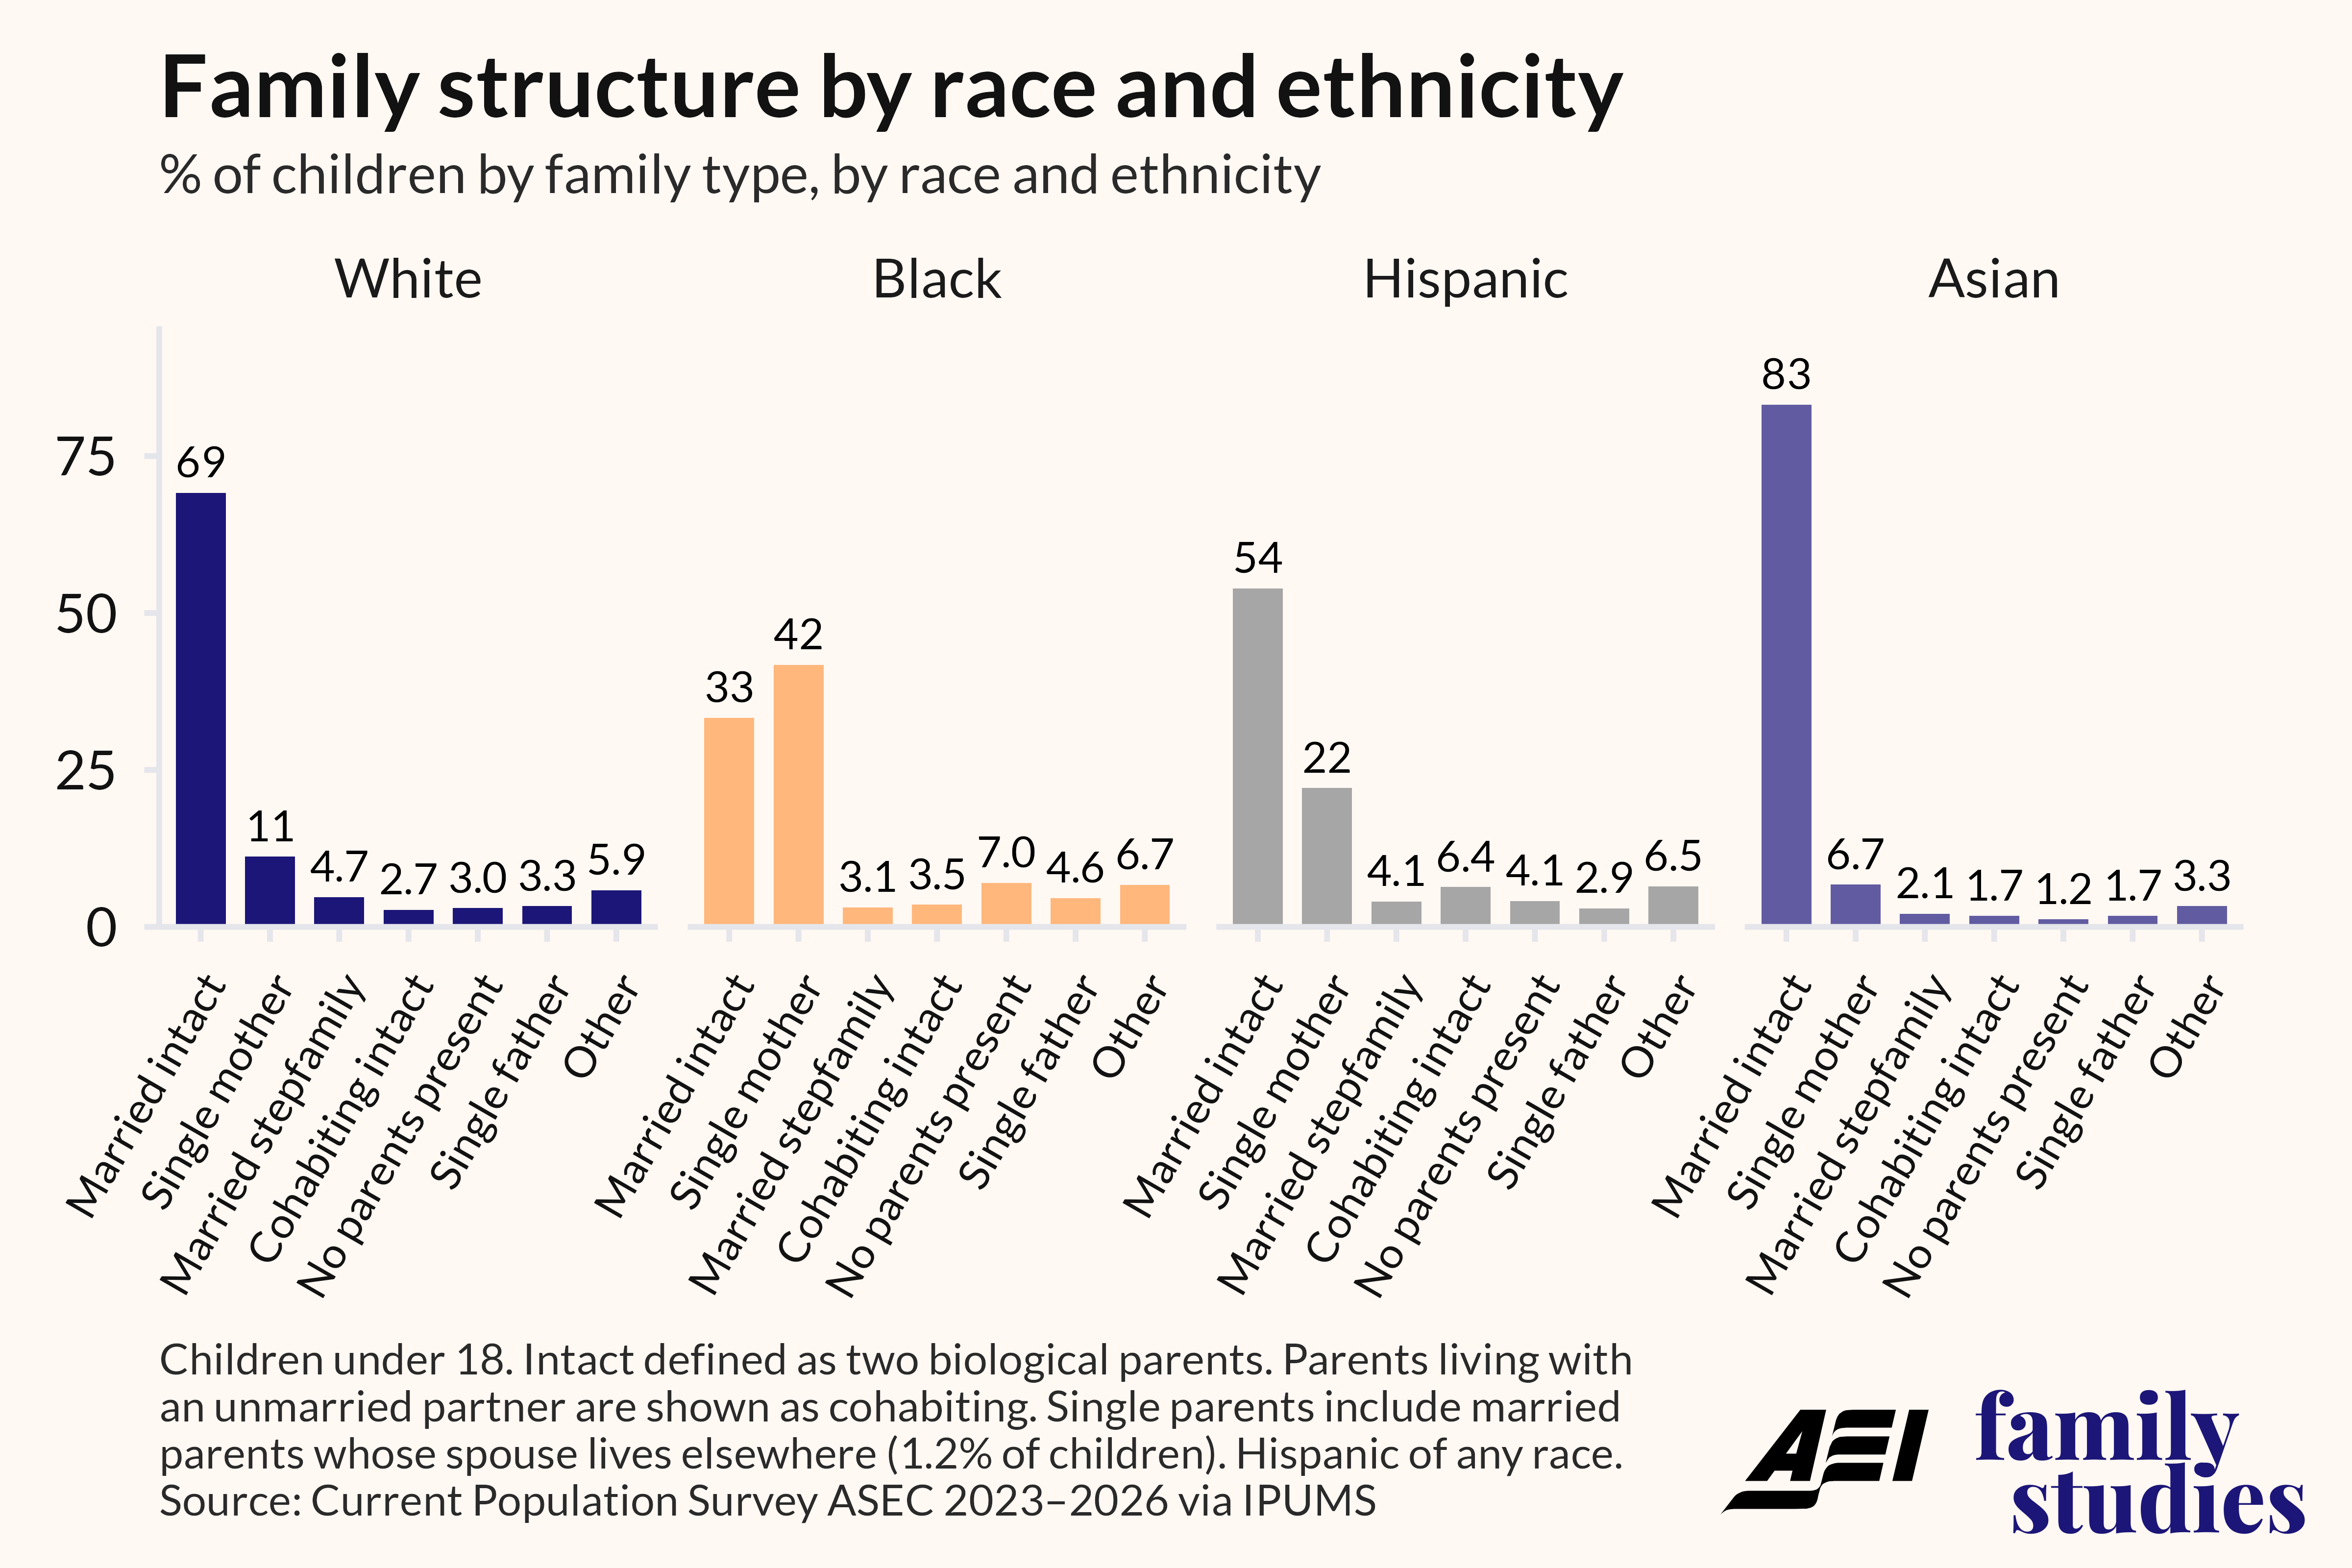
Figure 3. Child living arrangements by race and ethnicity in the United States, 2023–2026
Doing this reveals that 83% of Asian children live in intact-married families, compared to 33% of black, 54% of Hispanic, and 69% of white children.
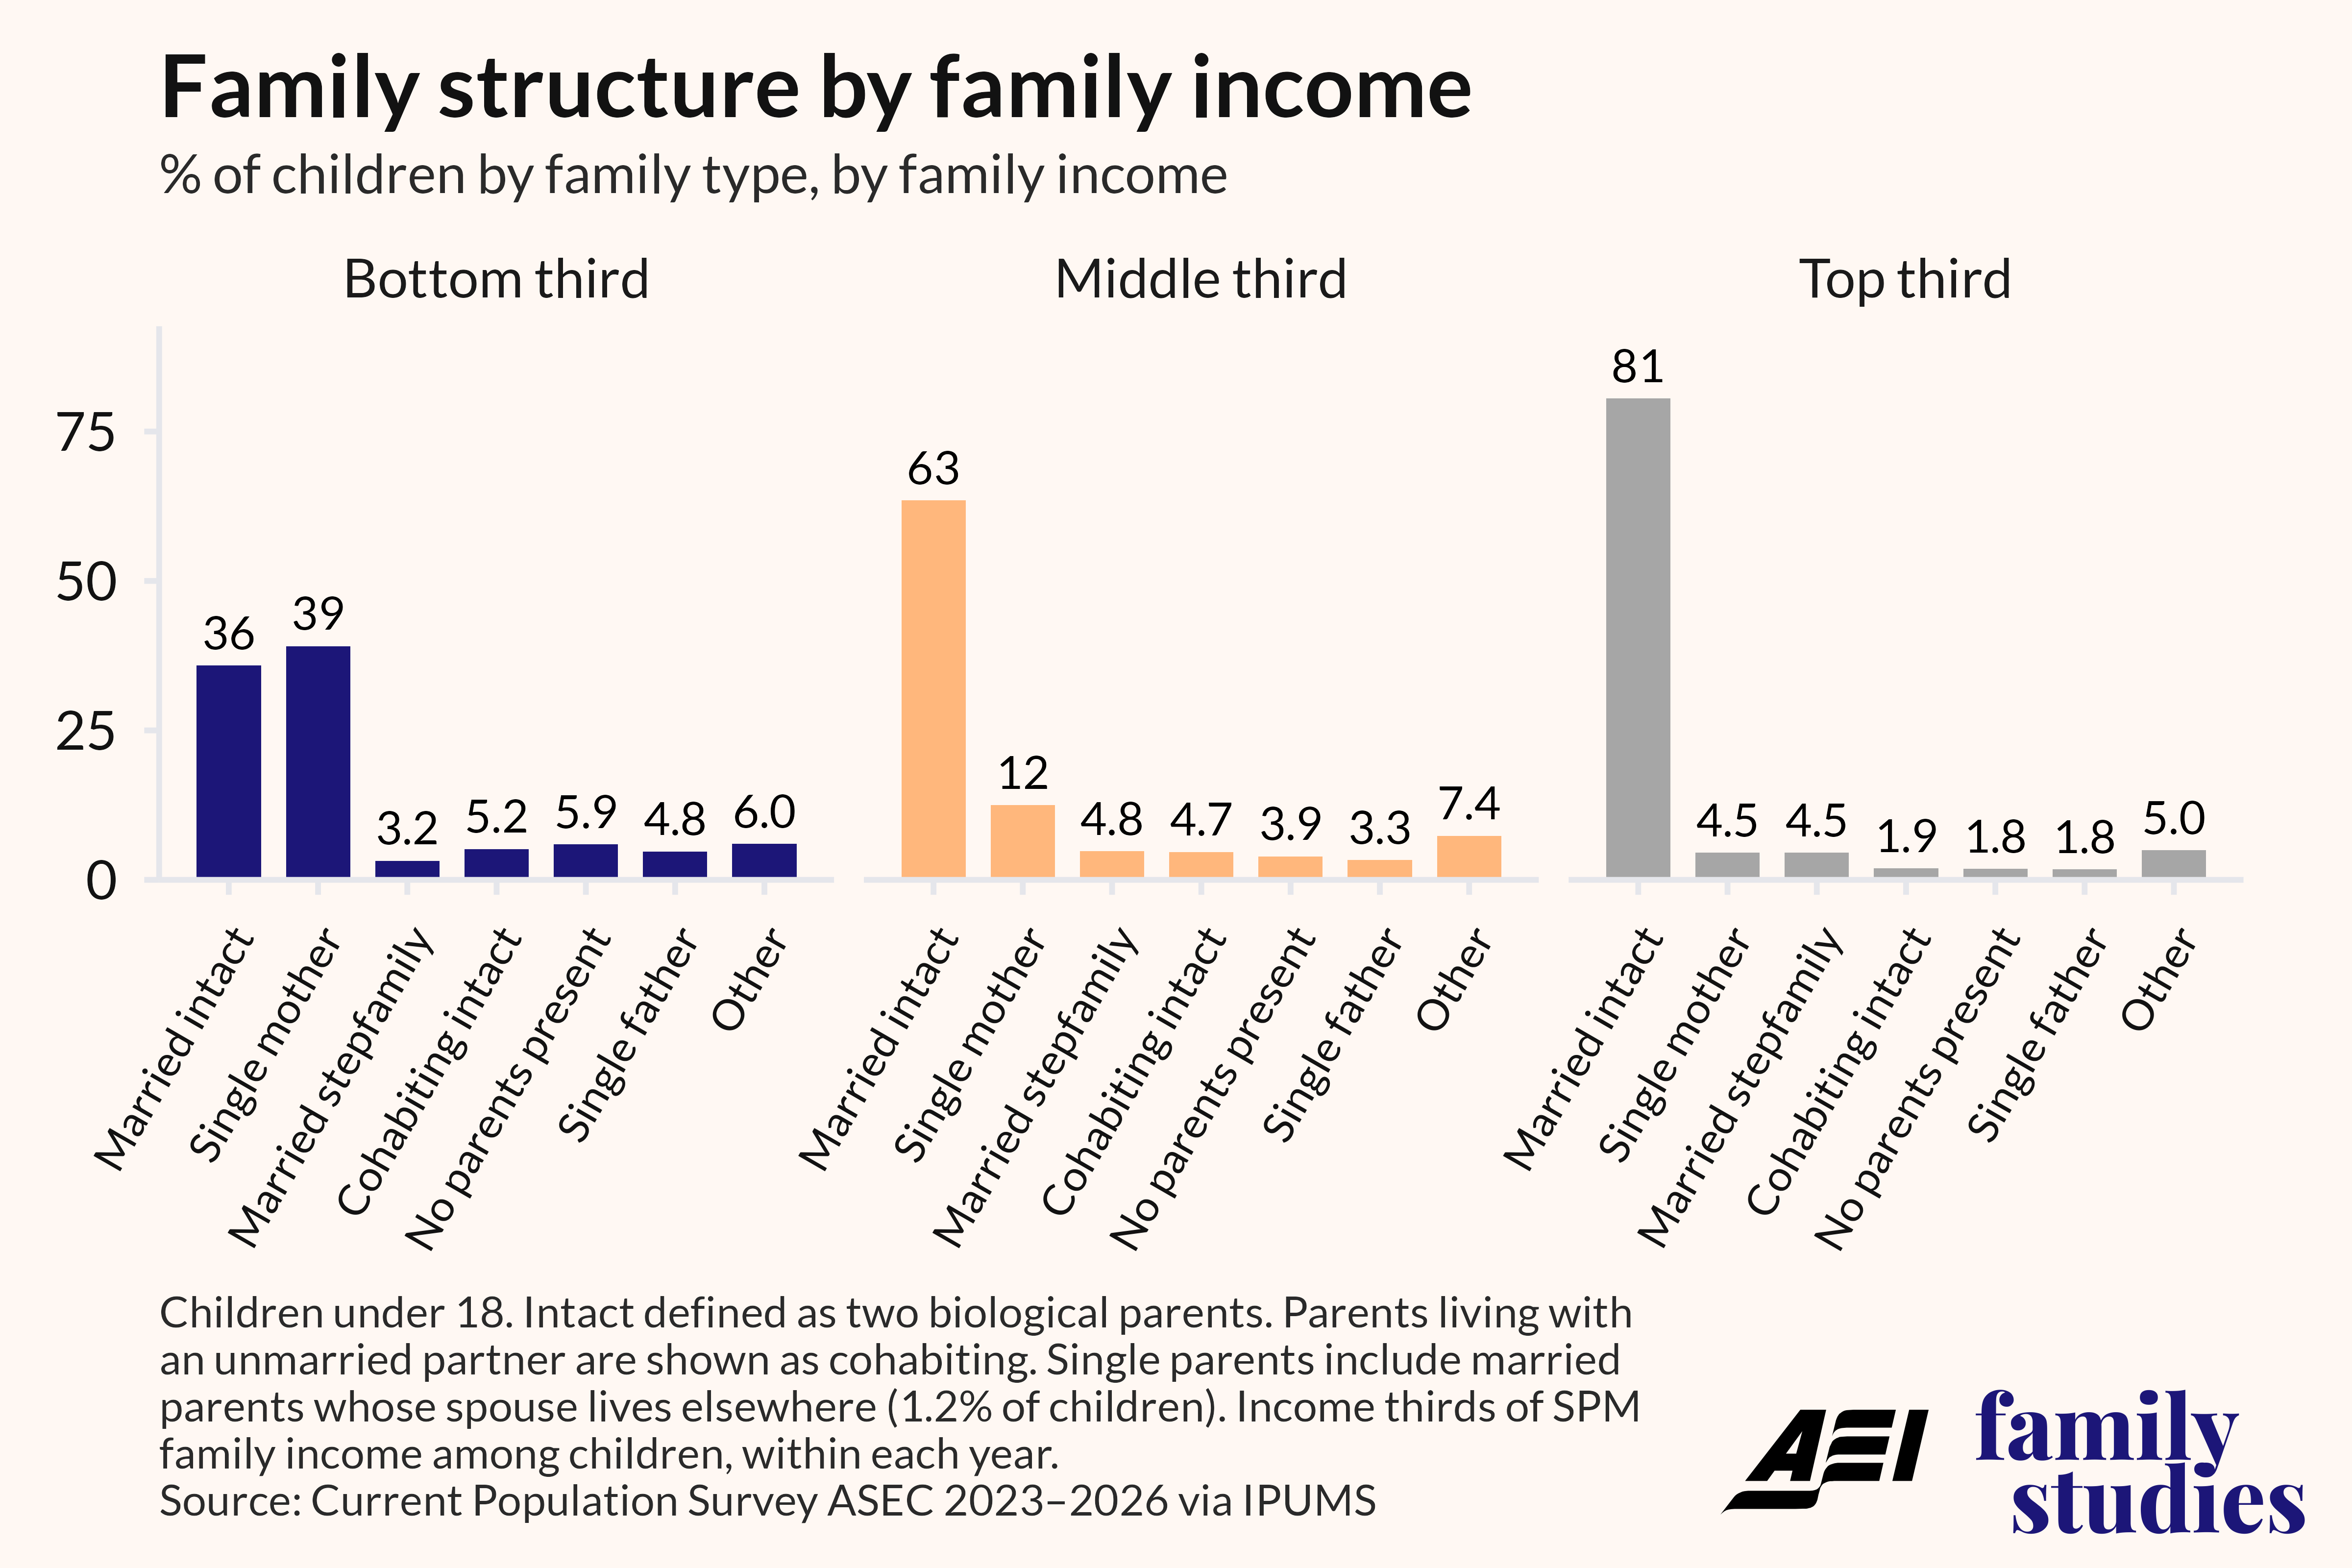
Figure 4. Child living arrangements by family income in the United States, 2023–2026
Likewise, 36% of children in lower-income homes live in an intact, married family, compared to 63% of children in moderate-income homes, and 81% of children in high-income homes. Clearly, family structure is stratified by race, ethnicity, and income in America.
A Major Blind Spot in Federal Reporting
This is important because most federal and state surveys, reports, and research track how child outcomes vary by race, ethnicity, and income, while often ignoring family structure. That is a major blind spot. Our earlier analysis of the National Survey of Children’s Health found that “family structure is a more powerful predictor of school problems, academic performance, and depression than are race and poverty.” Compared with children raised by their own married parents, we found that children in non-intact families—stepfamilies, cohabiting-parent homes, single-parent homes, and other households—are 13% less likely to earn mostly A’s and B’s, 47% more likely to have a parent called by the school about a problem, and more than twice as likely to struggle with depression. If public agencies want to tell the full story of how children are faring—and why—their surveys, reports, and research should include detailed measures of family structure.
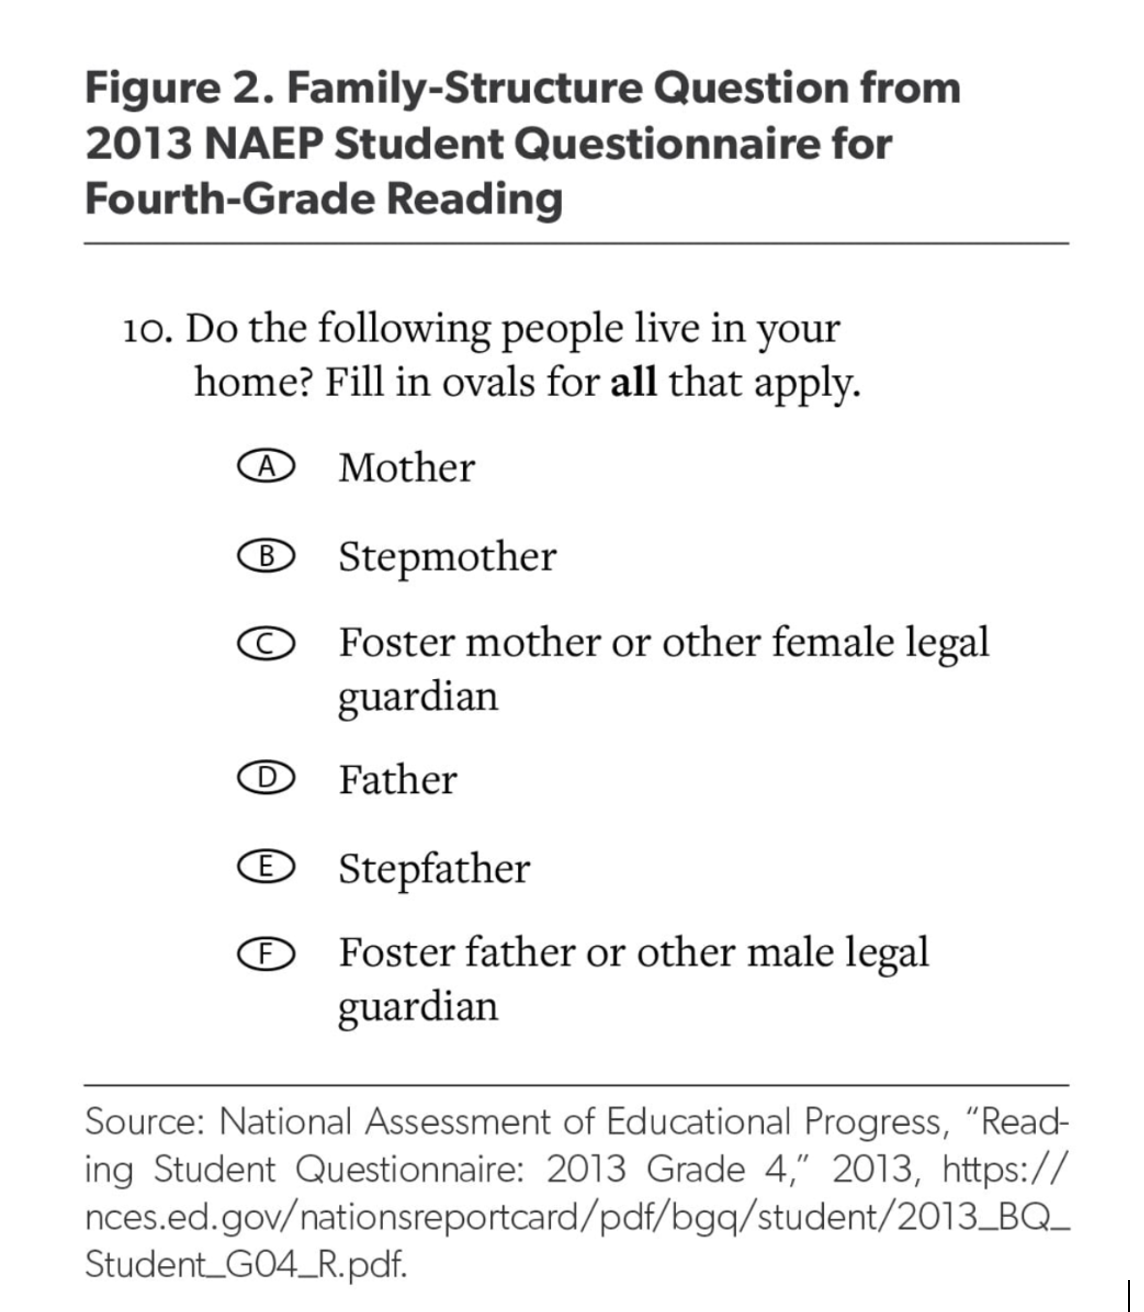
Figure 5. Family structure question from the 2013 NAEP Student Questionnaire
For instance, the National Assessment of Educational Progress (NAEP) does not report out student outcomes by family structure on its dashboard. This is the case even though NAEP has been surveying students about their family structure since 2013. Moreover, the survey (see example above) it uses does not measure children’s marital status. Future efforts to survey children and report out child outcomes from federal and state agencies—efforts like NAEP—should do a better job of measuring family structure and reporting on its links to key child outcomes.
The point here is that good public policy depends in part on good metrics—including family metrics. Federal and state governments need to measure what is happening in families and how family dynamics are tied to key national and state outcomes. Such efforts make it possible for policymakers and other key stakeholders across the country—parents, educators, civic, religious, and business leaders, and the press—to determine how families are influencing key domains of life in their communities.
We know from social science research that communities with a higher share of two-parent families are more likely to advance economic mobility for poor children, children from stable families are more significantly likely to succeed in school, and poverty is dramatically lower in communities where two-parent families predominate. For instance, Harvard sociologist Robert J. Sampson has found that a community's family structure is a powerful predictor of its crime rates, operating independently of broader factors like overall income, geographic region, or city size.
Likewise, Harvard economist Raj Chetty and his colleagues have noted the strong negative correlation between family instability and upward mobility for poor children, noting that areas with a higher concentration of single-parent families exhibit substantially lower rates of upward intergenerational mobility.
Patterns like these suggest that strong families boost the fortunes of children, adults, and communities alike across the nation. Which is why it would be helpful for federal and state governments to track the relationships between family structure and child, adult, and community outcomes across the full range of agencies that serve them.
Recommendations
In particular, federal agencies that collect data on these domains should release regular information on the ways in which family structure is connected to key outcomes under their purview. These agencies would include: the U.S. Department of Education’s National Center for Education Statistics (which administers the National Assessment of Educational Progress); the U.S. Department of Health and Human Services, including the CDC’s National Center for Health Statistics and the Administration for Children and Families; the U.S. Census Bureau; the Bureau of Labor Statistics; the Department of Justice’s Bureau of Justice Statistics and Office of Juvenile Justice and Delinquency Prevention; and the Internal Revenue Service’s Statistics of Income Division—along with their state counterparts in education, health and human services, child welfare, juvenile justice and corrections, labor and workforce development, and revenue.
State and federal agencies should specifically report:
- How family structure is linked to child outcomes related to school, physical and emotional health, abuse, poverty, and criminal justice;
- How adult marital and relationship status are linked to adult outcomes in physical and emotional health, poverty, criminal justice, and labor force attachment;
- How spending on adult, family, and child services is linked to family structure; and
- How tax revenues are linked to adult family status.
Collecting and reporting these data would give policymakers, parents, scholars, nonprofit leaders, and journalists a clearer picture of how the shape of American families bears on the well-being of children, adults, and communities. It would also show how much family structure matters relative to race, ethnicity, and poverty, the factors that often dominate public debates over some of our most consequential debates about public and social policy.
Americans cannot address what their government does not measure. Policymakers should require that the nation’s key surveys and reports on children—from the National Assessment of Educational Progress (NAEP) to the CDC’s Youth Risk Behavior Survey and the federal America’s Childrenindicators report—routinely measure family structure in detail and report how it is linked to the outcomes that matter most for the rising generation.
Download a PDF copy of the full research brief below.


