Introduction and Executive Summary
Of the approximately 700 million people who have lived in America since 1600, and the over 690 million since 1776, about 80% were born here. We may be a nation of immigrants—but throughout our history, the true source of our growth has been in family and fertility. As our country celebrates its 250th anniversary, this report takes stock of how we got here and what the future may hold. Unfortunately, given that U.S. birth rates are now below 1.6 children per woman, the answer for how we reached our current scale and strength as a nation—families raising their own children—points to a dour conclusion: without a new birth of family life in America, the greatest days of freedom will indeed be behind us. Whether our family tree has been a branch of the tree of liberty since its earliest days as a sapling, or was grafted on in living memory, the future of liberty for all of us depends on the future of family.
In this report, we present fresh estimates of fertility for every state with available vital statistics back to 1917, and—as a special feature in celebration of our nation’s 250th birthday—we also produce birth rate statistics for one of the nation’s original mother-colonies, Massachusetts, going back 365 years.
Beyond this new release of data demonstrating when and where American family formation has plummeted, we also use results from a new survey of over 4,700 Americans to explore how American cultural norms around friendship and celebrity families may shape fertility. If American fertility is to recover, new cultural norms around friendship and family life may be an important element.
Finally, informed by the available evidence on fertility and family policy, and in light of the new evidence on family culture, we outline a plan to raise American birth rates back to where they belong, and where most Americans say they want them to be: 2.4 children per woman.
Major Findings
- New historical data show that the U.S. is now in its third historic period of extended below-replacement-rate fertility. Importantly, this current period of decline is already longer than previous declines, has fallen to lower lows, and is more widely shared around the country. The new data we present on historic American fertility stretches further back into our history at a higher level of quality and reliability than any previous vital statistics-based reconstruction of U.S. fertility.
- U.S. population growth has abruptly slowed down in recent years, driven in large part by fertility rates collapsing to record lows. If fertility rates continue their recent decline, U.S. population will peak around 351 million and begin declining in the 2050s. If fertility rates stabilize, population will peak around 366 million and begin declining in the 2080s.
- Desired family size has not declined nearly as much, and as a result, the gap between actual fertility rates and the number of children Americans report desiring is rising to high levels. Even as the total fertility rate has plummeted below 1.6 children per woman, surveys continue to show Americans incorrectly think they will have about 2 children each and aspire to have 2.4 children each.
- Peer culture is a key factor associated with fertility. Having very helpful versus relatively unsupportive friends can increase desired family size for young Americans by nearly an entire child per family and can increase couple intentions to have another child by about 10 percentage points (an increase of about a third).
- Celebrity culture shapes fertility: fans of celebrities who have more kids themselves want to have more children as well. Comparing family size among admired celebrities to individual aspirations, an admired celebrity having one extra child may increase an individual’s desired family size by as much as 0.15 children.
- If policymakers wish to reverse the birth rate decline, they will have to consider a wide range of out-of-the-box policy proposals, including a generous baby bonus. However, this need not break the bank: generous baby bonuses worth five or six figures can be paid for with less than 1% of the federal budget; in fact, they’re cheaper than recently proposed child care or parental leave expansions. Massive increases in the generosity of family policy do not have to be fiscally reckless.
- Beyond financial supports, policymakers and concerned private citizens should consider interventions aimed at fostering a more family-friendly culture. Based on our findings about friends and celebrities, we outline many ideas for policies that could strengthen and generate family-friendly-friendship.
The Underwhelming Expansion
"It appears the British Americans have doubled their numbers in every period of twenty-five years from their first plantation. A rapidity of population not to be paralleled in the annals of Europe! It has never been equaled since the patriarchal ages. This rapid population of the Americans arises, partly from the great accession of foreigners, but principally from the natural increase of the inhabitants. The reasons, why the Americans are more prolific than the Europeans, are, that they are less luxurious in their manner of living, and the means of supporting a family can be more easily obtained. For the last reason the Americans are induced to marry earlier in life, and consequently their families of children are more numerous.”
– Edward Wigglesworth, 1775
In 1775, just a year before our nation’s birth, a Harvard professor named Edward Wigglesworth published a short tract called “Calculations on American Population.” It was the first true demographic projection of our young nation and documented that the American population was doubling every 20 years, primarily due to births, not immigration. From this, Wigglesworth produced a forecast of future American population. The figure below compares his forecast to the actual history of American population.
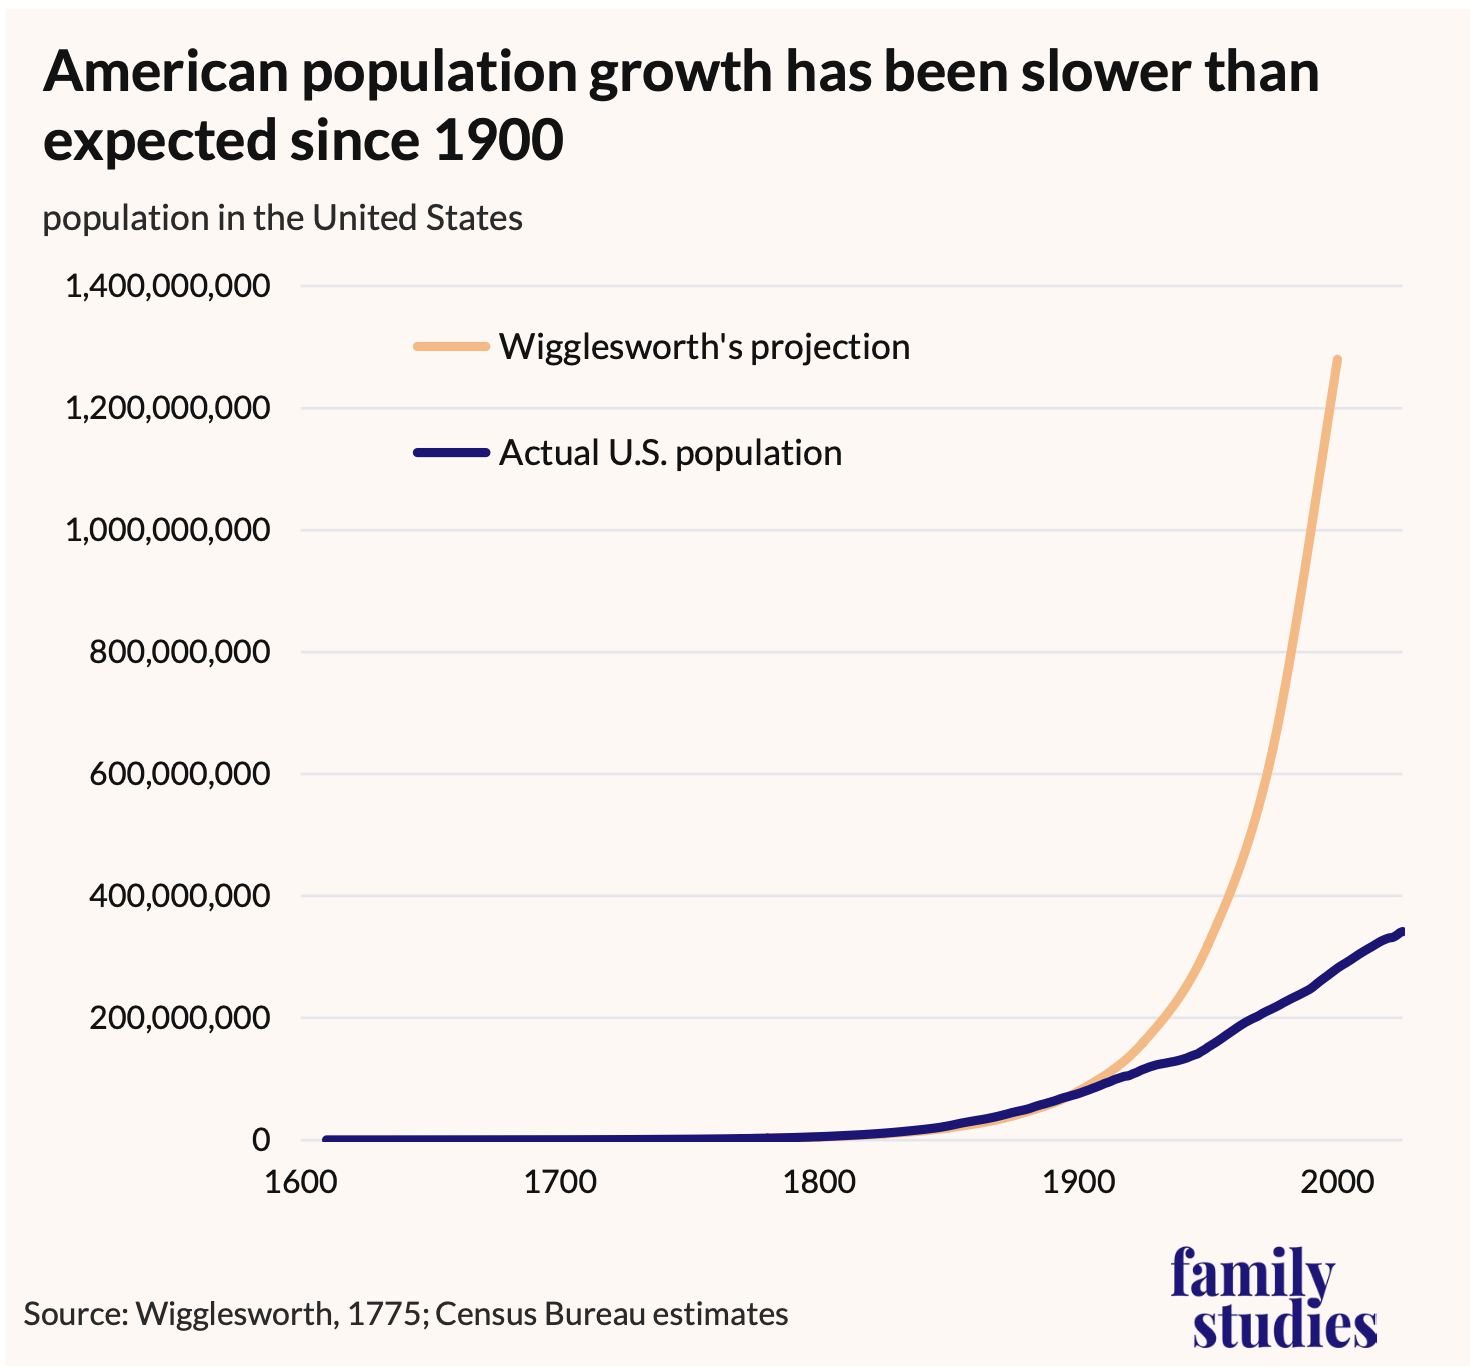
Figure 1. U.S. Population 1600-2025, actual data from Census Bureau compared to Wigglesworth’s projection
From 1775 until the late 1800s, American population growth met or exceeded Wigglesworth’s forecast. About that forecast, he wrote,
But to anticipate [the American] population and improvements, at the close of the twentieth century, overwhelms the mind with astonishment! At that time, should their future population be as rapid as their past, the Americans would amount to ONE THOUSAND TWO-HUNDRED AND EIGHTY MILLIONS! The continent extending back to the south-sea, affording them new plantations; and the diversity of climates and soils, inviting the introduction of all the various productions of the other quarters of the world. (emphasis original)
The infectious enthusiasm with which Wigglesworth anticipated over a billion Americans contrasts sharply with his British colleague, Thomas Malthus, who would pen his gloom-and-doom Essay on the Principle of Population a few decades later, presenting a future of starvation and suffering. The American Wigglesworth saw exponential population growth as a sign of a heroic future for our country and people, while the old-world Malthus just saw people as more mouths to feed.
Why did America undershoot expectations? Why didn’t we keep up with Wigglesworth’s forecasts? It wasn’t a lack of immigration—in fact immigration rates were higher in the 19th century than in Wigglesworth’s day. Rather, it was a decline of fertility. In the late 1600s, American fertility rates were at least 5.5 and perhaps as high as 7.5 children per woman—far above birth rates in England, which ranged from 3 to 6 children per woman. As a result, while perhaps as many as 140 million people have immigrated to the United States since 1776, at least 550 million have been born here, a ratio of 4 births per immigrant. Even in the era of mass migration from 1840 to 1925, births outnumbered immigrants by more than 4.5 to 1. In fact, it has always been the case that America is a family business of those born here—and that business likes to get some extra growth by incorporating new families through immigration, too. We are first and foremost a nation of families, and secondarily (though importantly!) a nation of immigrants.
Yet today, fertility has fallen sharply. The next page’s figure tracks American total fertility rates in the long run.
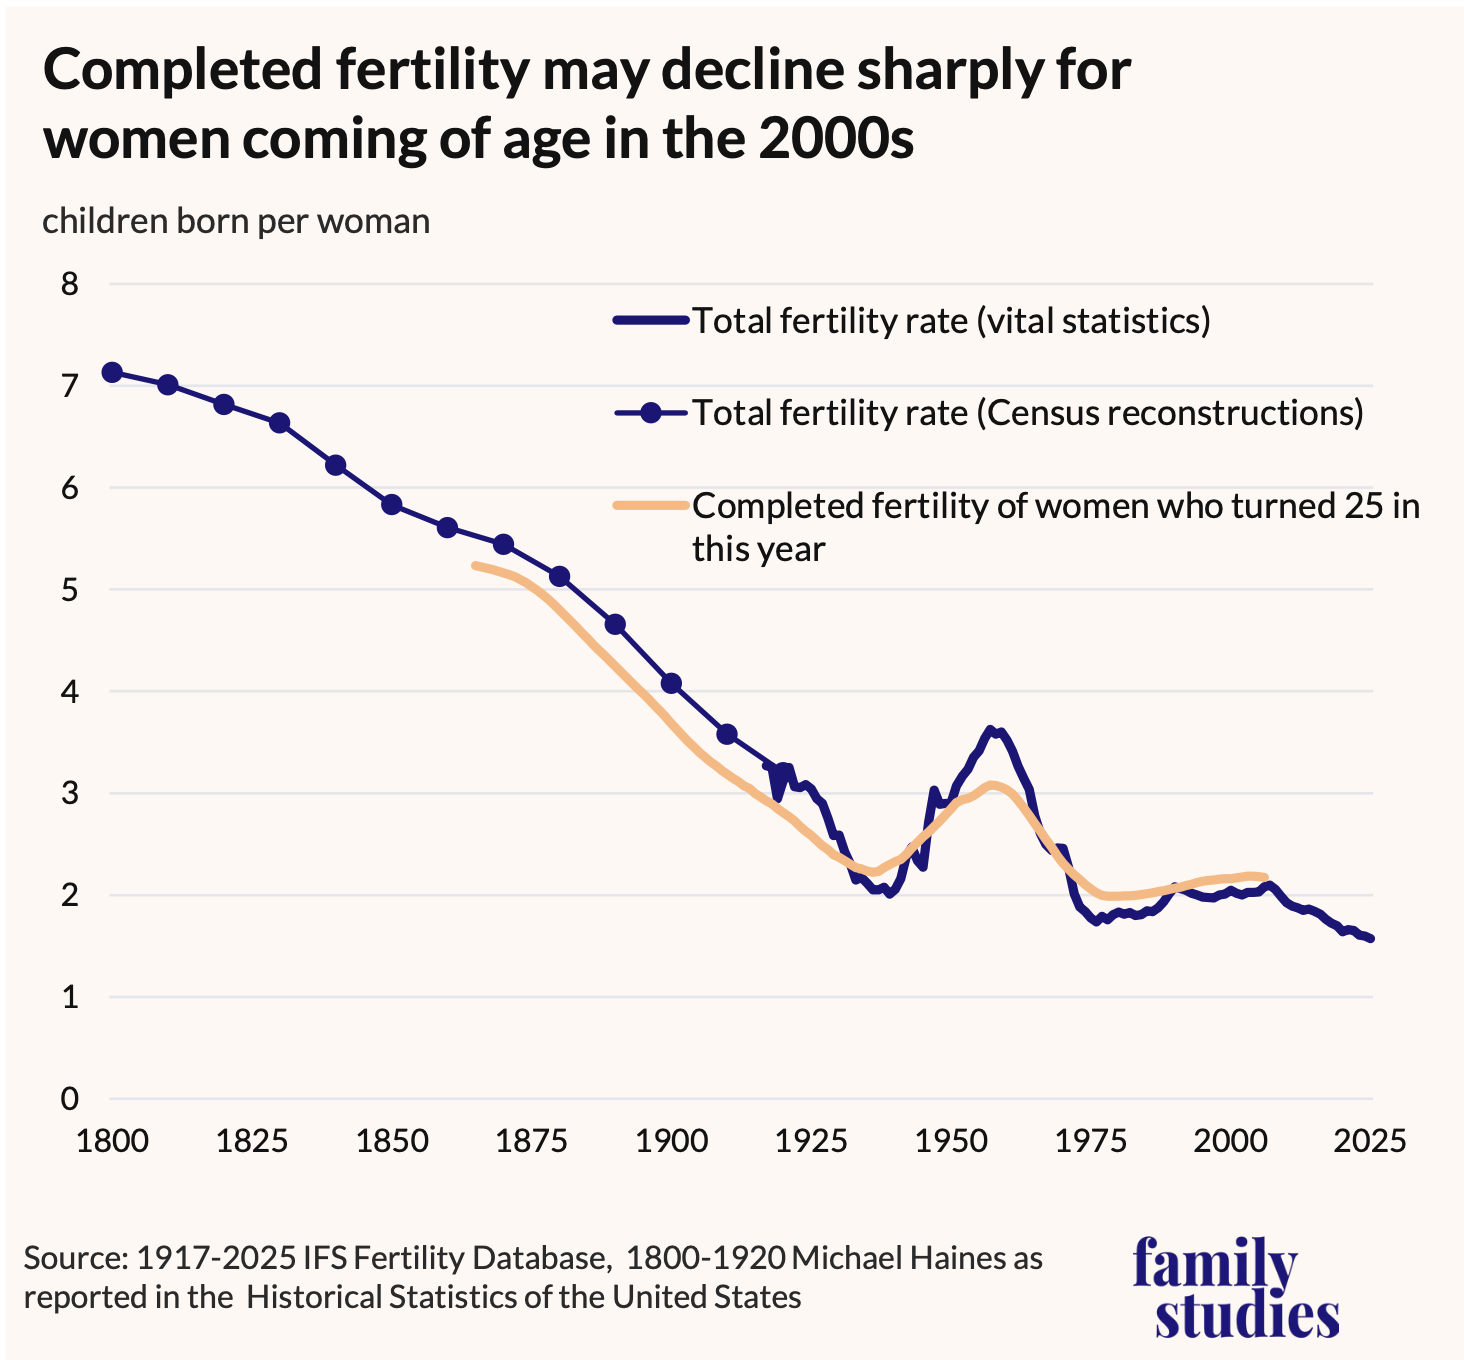
Figure 2. U.S. Total Fertility Rate and Cumulative Cohort Fertility, in children per woman, 1800-2025
Whereas in 1800, birth rates by age implied an average family size of seven children per woman, today the average young woman can expect to have fewer than 1.6 children. Annual fertility rates can be very volatile, and so we also show birth rates summed across women’s reproductive lives to estimate completed fertility.
As can be seen, while completed fertility is less volatile, across the decades it very closely tracks the total fertility rate prevailing at the time a given birth cohort of women was around age 25. The correlation between actual births per woman near the end of a cohort’s reproductive years and the total fertility rate prevailing when that cohort turned 25 is 0.96—nearly a perfect association of the two. Where the total fertility rate goes, completed fertility tends to follow.
Of course, back in the 1800s and before, many of those children who were born did not survive. The figure below uses the same fertility data as above but removes births of children who likely died before age 15.
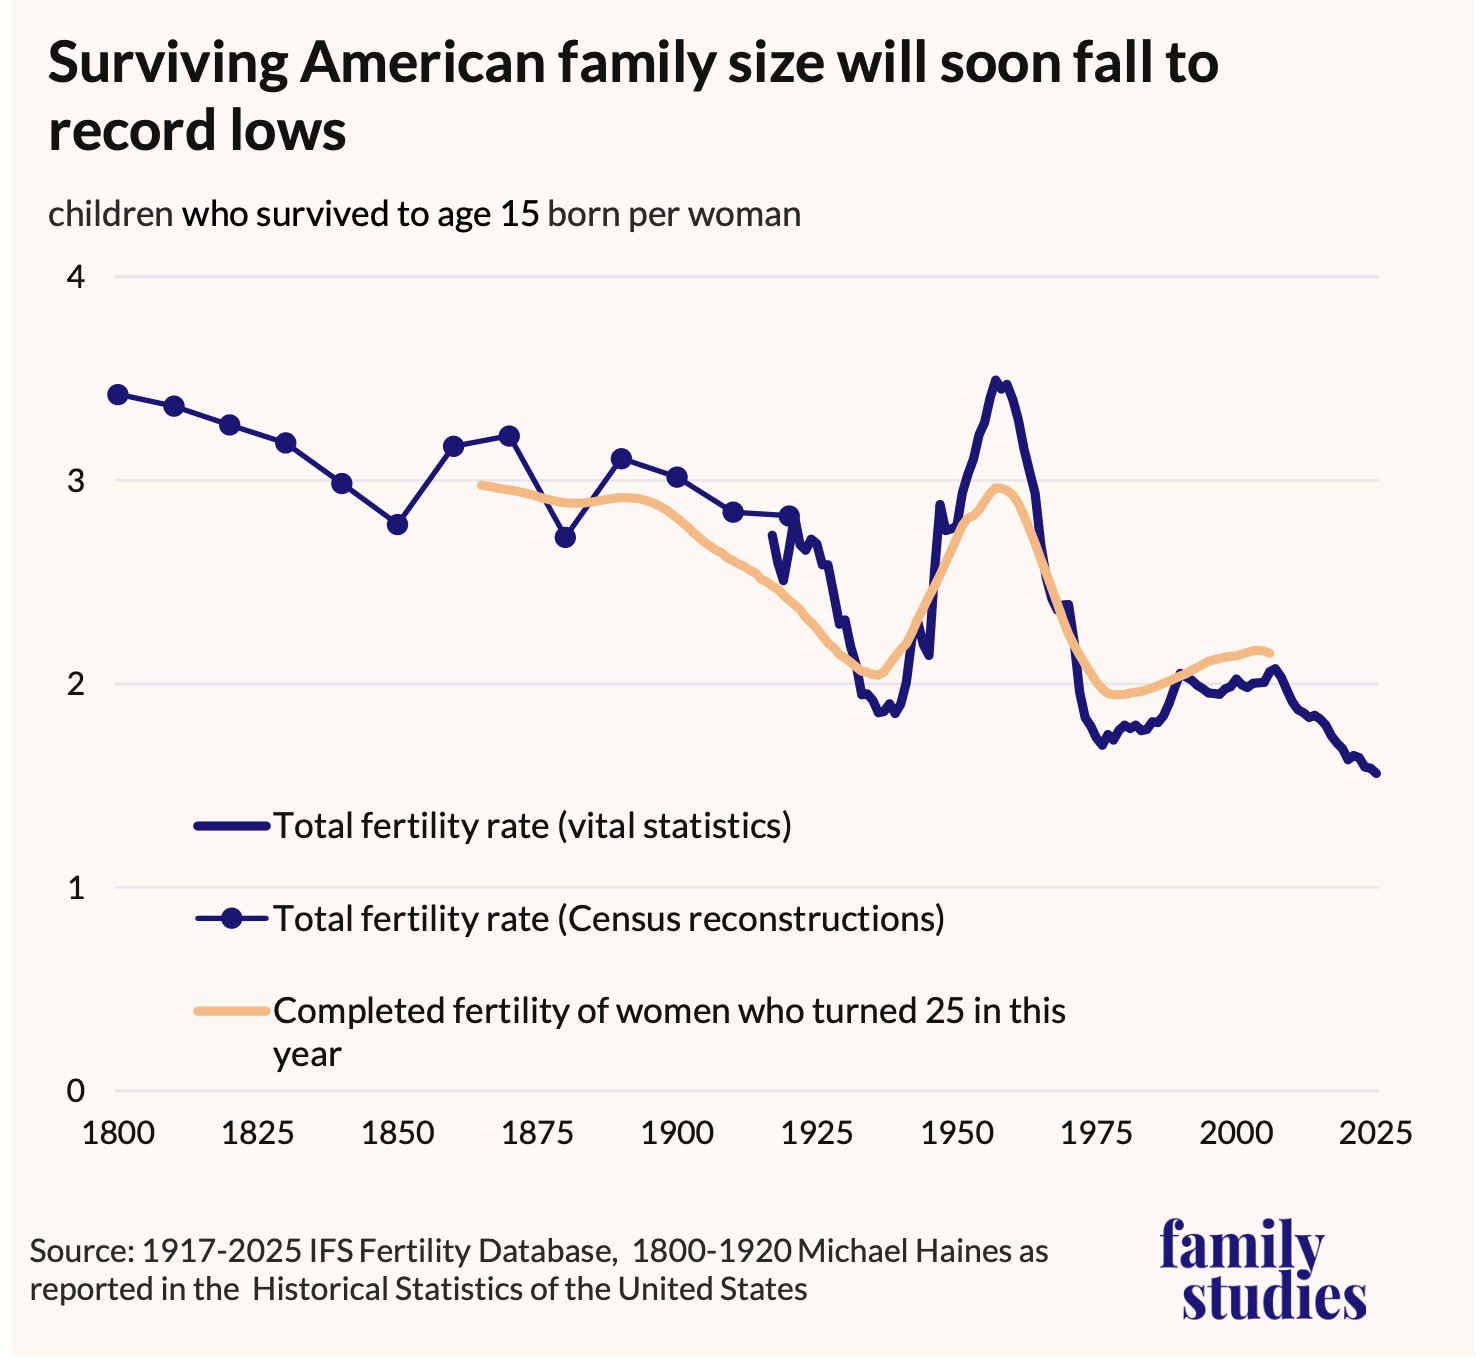
Figure 3. U.S. Total Fertility Rate and Cumulative Cohort Fertility, in children per woman, adjusted for child mortality rates, 1800-2025
Americans had many children, it’s true—but half of them died before age 15. Rates of child mortality in England in 1800 were likely even higher, and fertility lower. So, while America’s fertility advantage was still very real, the truth is that most people in the early days of the American experiment did not raise 7 children to maturity. They typically raised between 2 and 4 children. Moreover, the U.S. has seen three separate episodes of below-replacement fertility once we also account for the true replacement rate determined by child mortality: from 1933 to 1941 during the Great Depression, from 1972 to 1989 during a period of rapidly rising contraceptive uptake and abortion rates, and from 2009 to today. If the correlation between total fertility rates and completed fertility rates continues to hold up in the future, completed family sizes will plummet to new lows.
Finally, it is worth asking what kinds of families Americans actually want. The figure on the next page compares surviving fertility rates to survey-reported family size ideals, both general ideals (i.e., answers to questions about the ideal size of a family), and personal ideals or desires (i.e., answers to questions about what individuals want for their own family lives).
As can be seen, fertility rates have tended to move in the same direction as stated fertility preferences over time: the correlation over time between general ideals and total fertility rates is 0.85, while for personal ideals and fertility rates, it is 0.94. In recent years, large numbers of surveys have been conducted, especially online, and online surveys in particular have tended to produce unusually low estimates of desired fertility. Even so, the gap between actual birth rates and survey-reported desires is the highest it has been since the early 1970s, and approaching levels not seen since the Great Depression. In other words, fertility is not just falling—it is falling further below the number of children Americans report wanting.
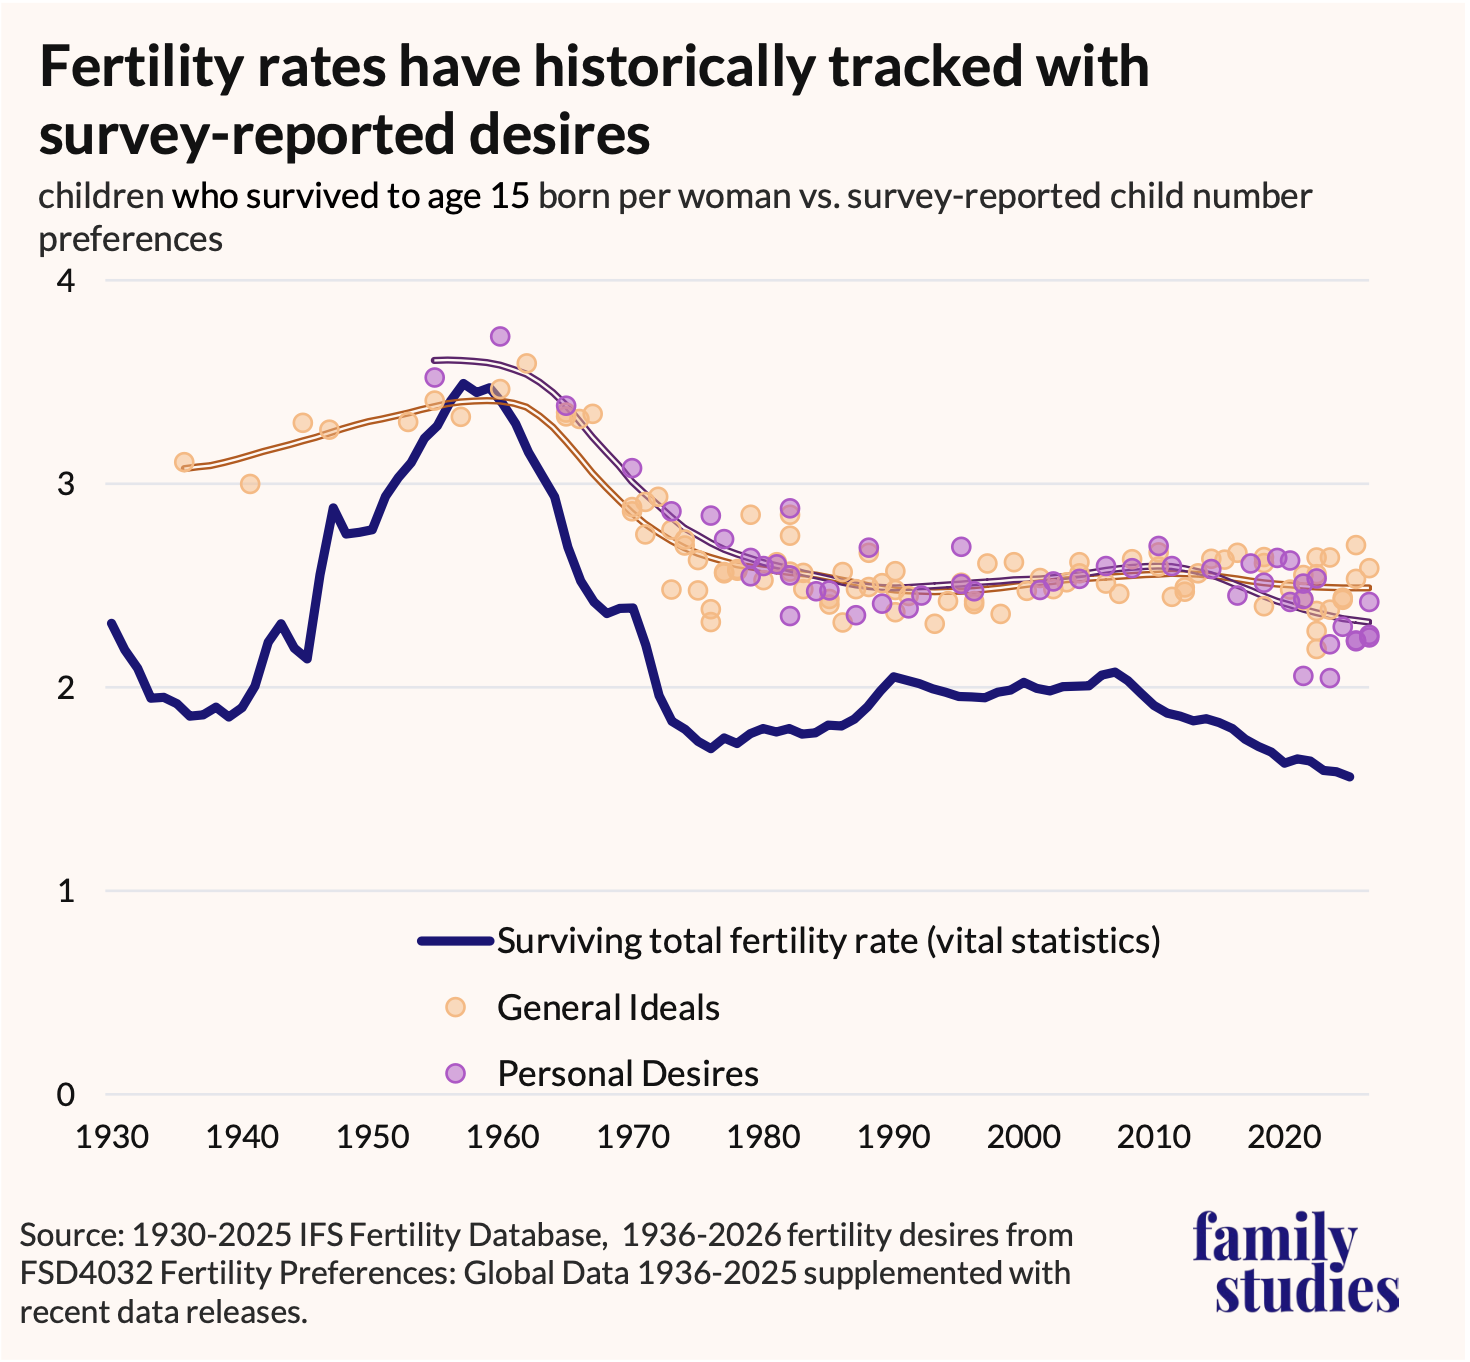
Figure 4. U.S. Total Fertility Rate and survey-reported family size ideals and desires, 1930-2025
In this report, the first edition of a new annual research report at the Institute for Family Studies’ Pronatalism Initiative, we present brand-new survey data about American family culture, as well as newly digitized data about the history of American fertility, in order to venture some Wigglesworthian hypotheses about the future of the American family. More importantly, we offer some suggestions on how our country can get back on course towards the fulfillment of its historic promise of growth and abundance.
Fertility in the 50 States
Birth rates vary appreciably around the country, and in fact, not all states even share the same trends in recent years. But Massachusetts first mandated that births be registered in 1639, though compliance was sporadic until 1841, when a reinforced law was passed. Modern genealogical databases have digitized these records, and we extracted a wide range of vital statistics data from Massachusetts annual vital statistics reports after 1840. In combination, these sources can be used to infer fertility rates for Massachusetts with relatively high reliability back to 1660.
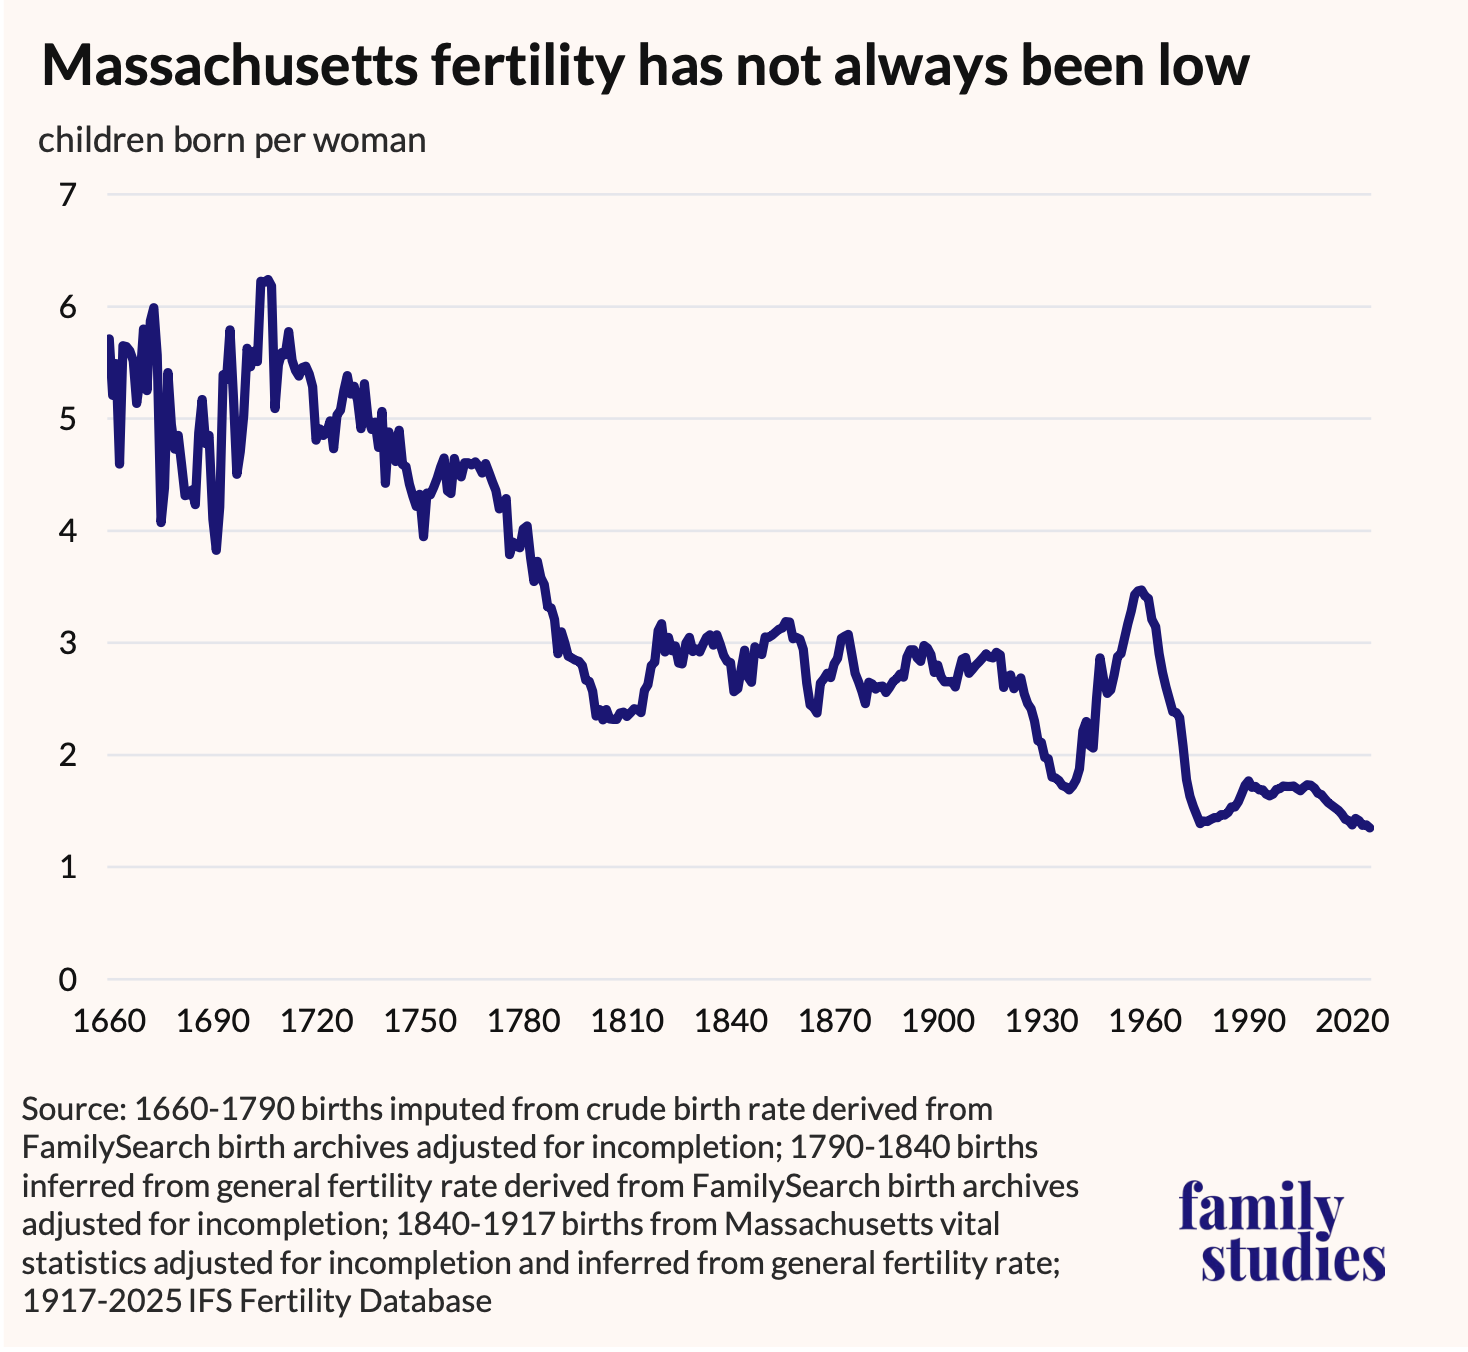
Figure 5. Massachusetts Total Fertility Rate, 1660-2025
Massachusetts had high fertility during the Puritan era, but fertility was already declining by 1720 and had entered a steep decline by the 1760s. It then stabilized at around three children per woman throughout the 19th century, before falling again in the 1920s and 1930s before the Baby Boom. Today, Massachusetts’ birth rate is around 1.35 children per woman—one of the lowest in the nation, and on par with rates observed in Europe. Massachusetts is far from the only state with a unique trend in fertility. The figure below shows trends for states which have, historically, had some of the highest birth rates.
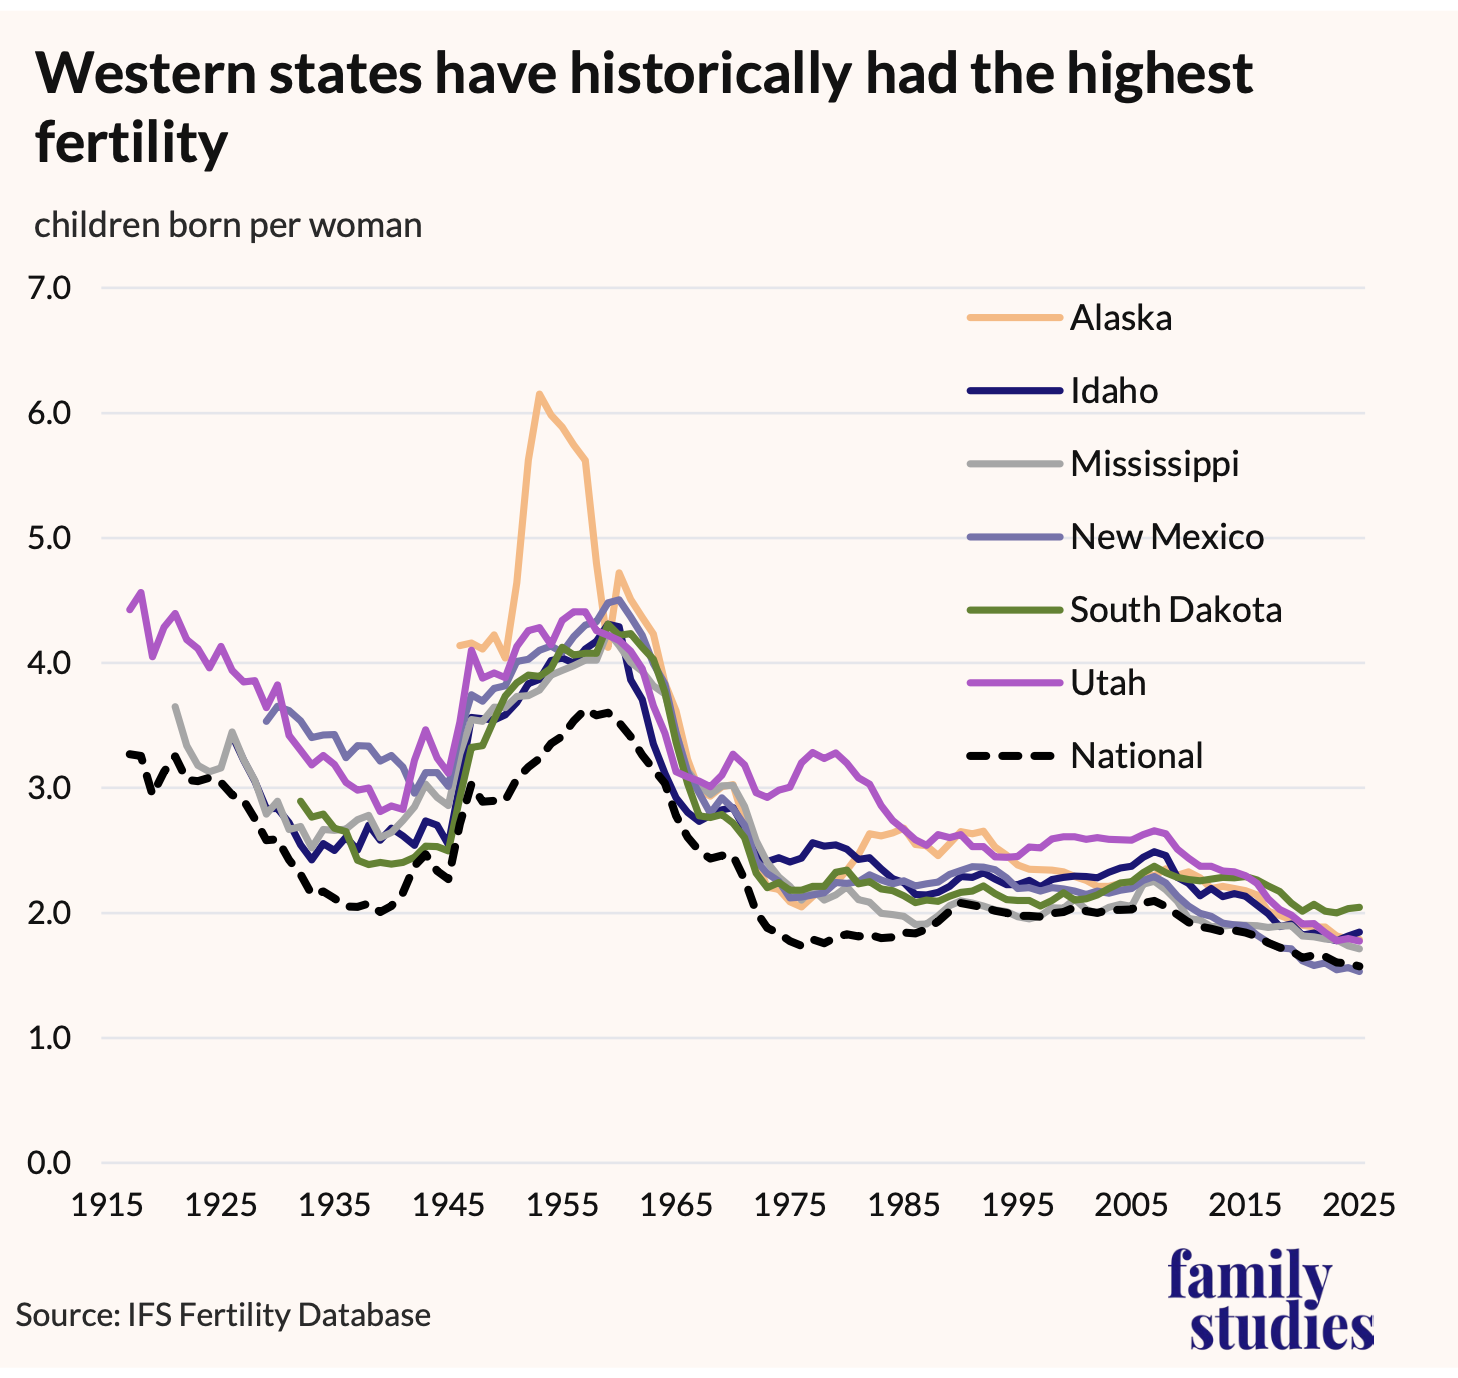
Figure 6. Total fertility rates for selected high-fertility states, 1917-2025
As can be seen, several western states have historically had the highest birth rates, especially Utah, Idaho, Alaska, and South Dakota. Mississippi and New Mexico have also historically had high birth rates, though, today, New Mexico has below-average birth rates, as Hispanic fertility rates have fallen rapidly. High fertility in the frontier states has long been an area of academic research. Recent research suggests that land availability for farmers may be part of the reason for this, but high marriage rates may be even more important.
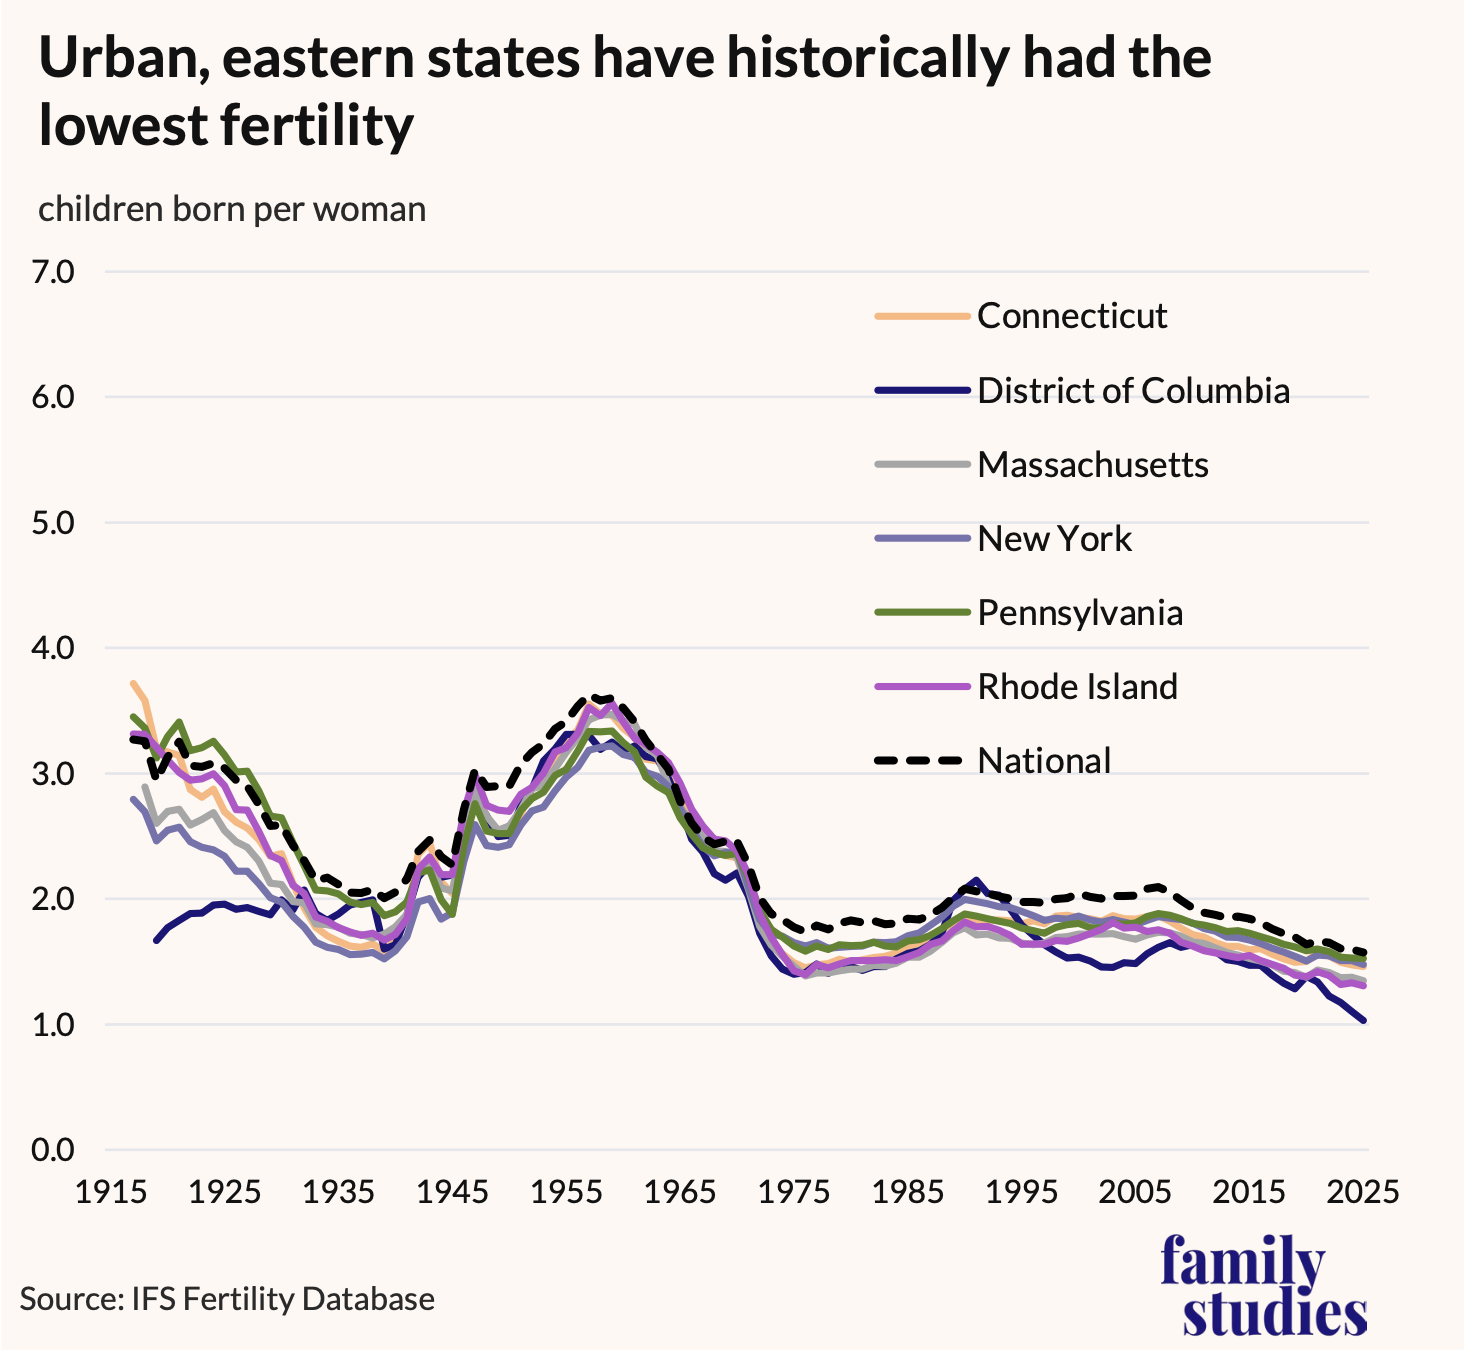
Figure 7. Total fertility rates for selected low-fertility states, 1917-2025
The set of states with very low birth rates is perhaps unsurprising: eastern, urbanized states.
The District of Columbia has almost always had a very low total fertility rate. But even less totally urbanized states like Pennsylvania, New York, and Massachusetts seem to have had low birth rates for a very long time. Even before accounting for child mortality, New York state had below-replacement-rate fertility in 1929, before the stock market crash that set off the Great Depression. The two figures above also clearly show that American fertility was declining from 1917 onwards, which suggests the Great Depression may have intensified fertility decline but did not cause it. Whereas some states have persistently had relatively low or high fertility, other states have seen major changes, as shown in the next figure.
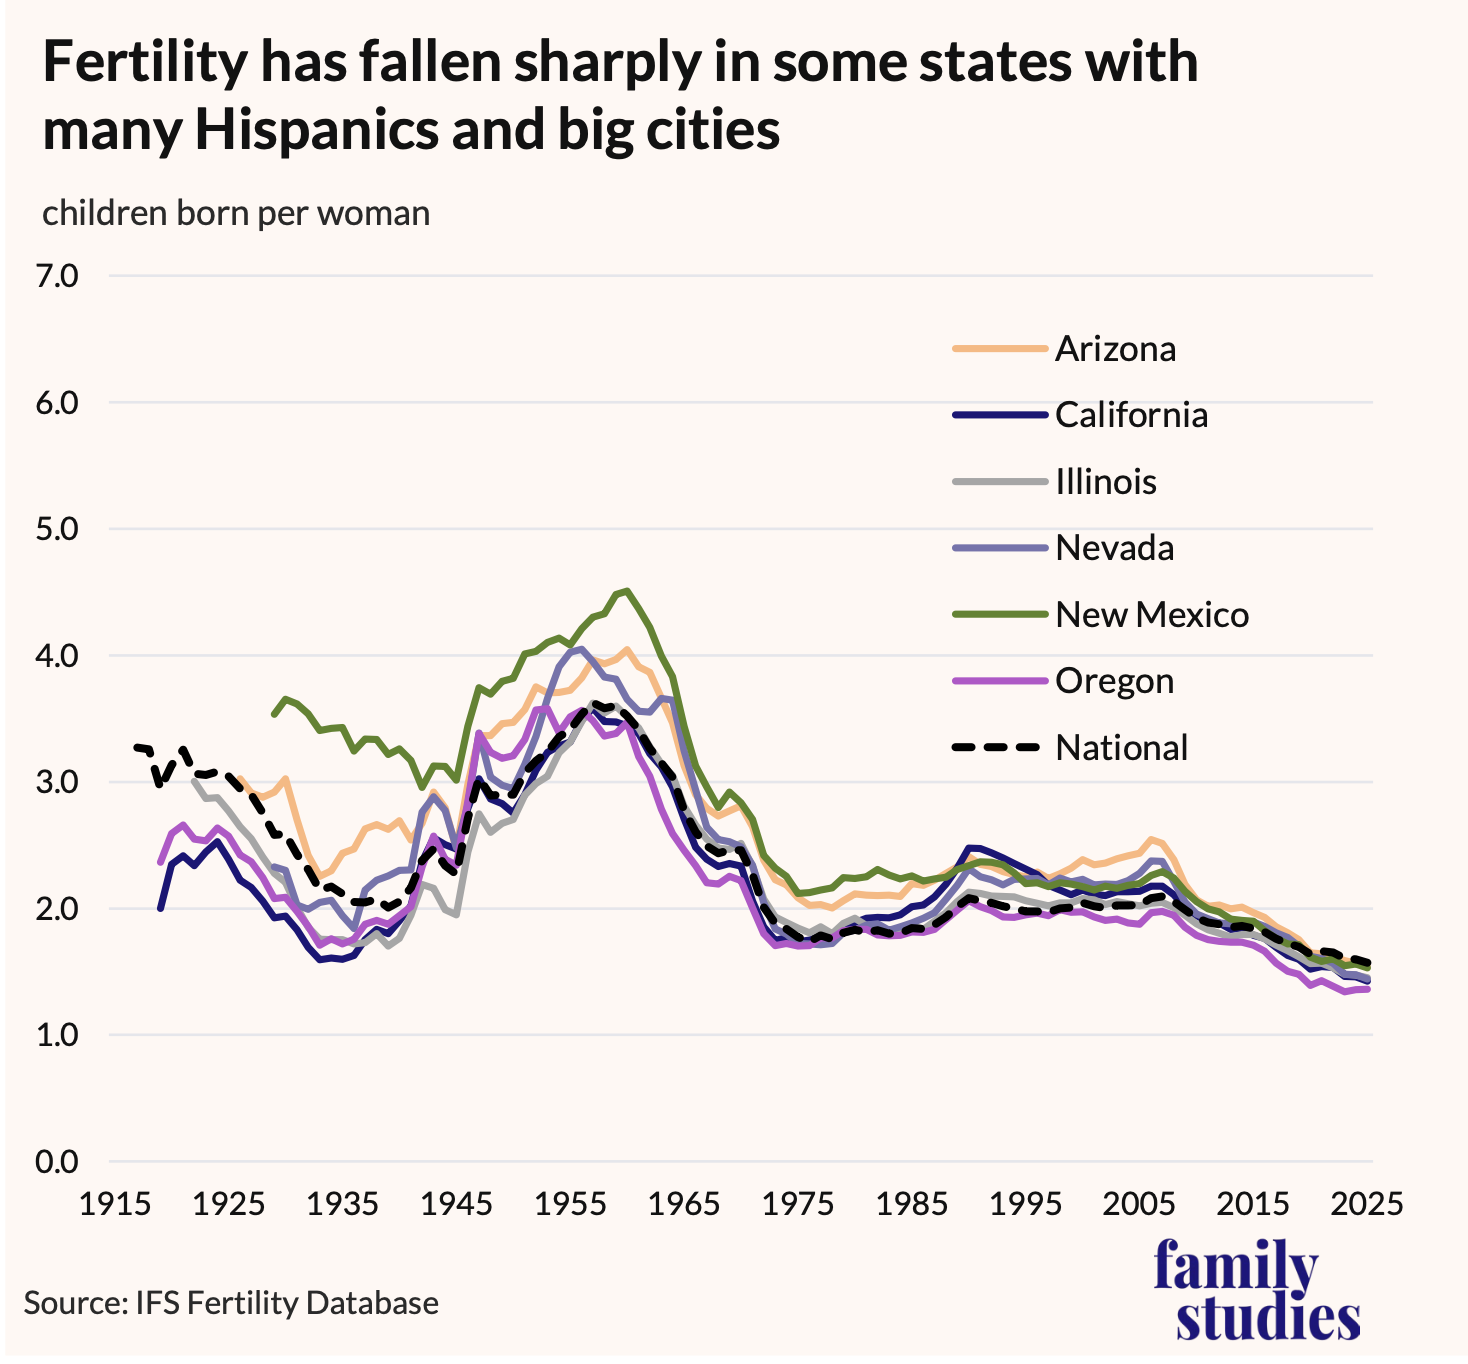
Figure 8. Total fertility rates for selected falling-fertility states, 1917-2025
The states in the figure above all had relatively high birth rates, vs. the national average, from 1980 to 2000—but today are all below the national average. Thus, whereas California was not a low fertility state in the latter 20th century, it is today, with a fertility rate of just 1.42 children per woman in 2025. Likewise, Nevada, Arizona, and New Mexico have seen their total fertility rates plunge. Interestingly, so have Oregon and Illinois, states with somewhat smaller Hispanic populations. In those states, fertility rates are especially low in large urban areas.
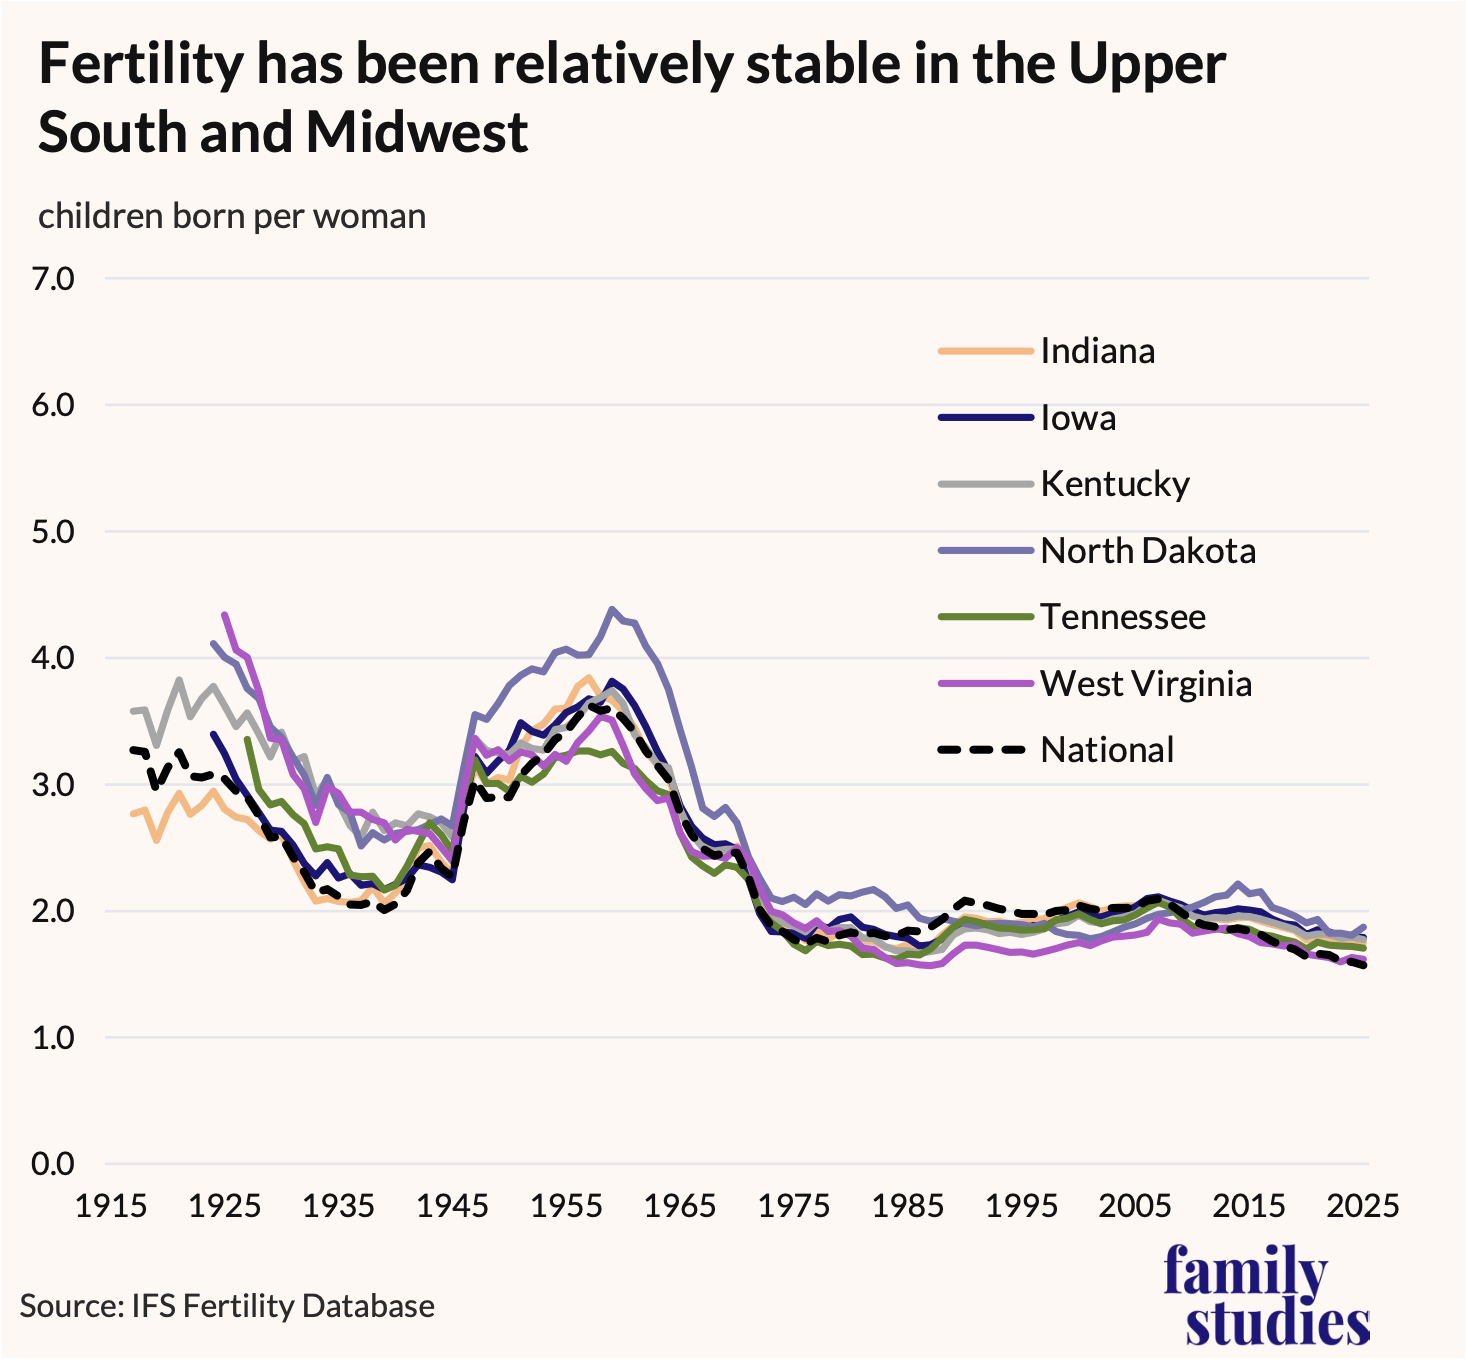
Figure 9. Total fertility rates for selected less-declining-fertility states, 1917-2025
Then there are, of course, states where fertility rates have seen a less negative trend, as in the figure on the prior page. North Dakota has famously seen its fertility rates move in a more positive direction than national averages, presumably due to the fracking boom fueling high incomes, high male employment, and ultimately higher marriage rates. Less remarked upon is how states like Kentucky, West Virginia, and Tennessee have largely bucked the trend of rapidly falling fertility and kept their fertility rates comparatively stable.
Finally, it is worth assessing American regions by their contemporary rates to get a sense of the overall geography of American family. The figure below shows the map of total fertility rates in 2025.
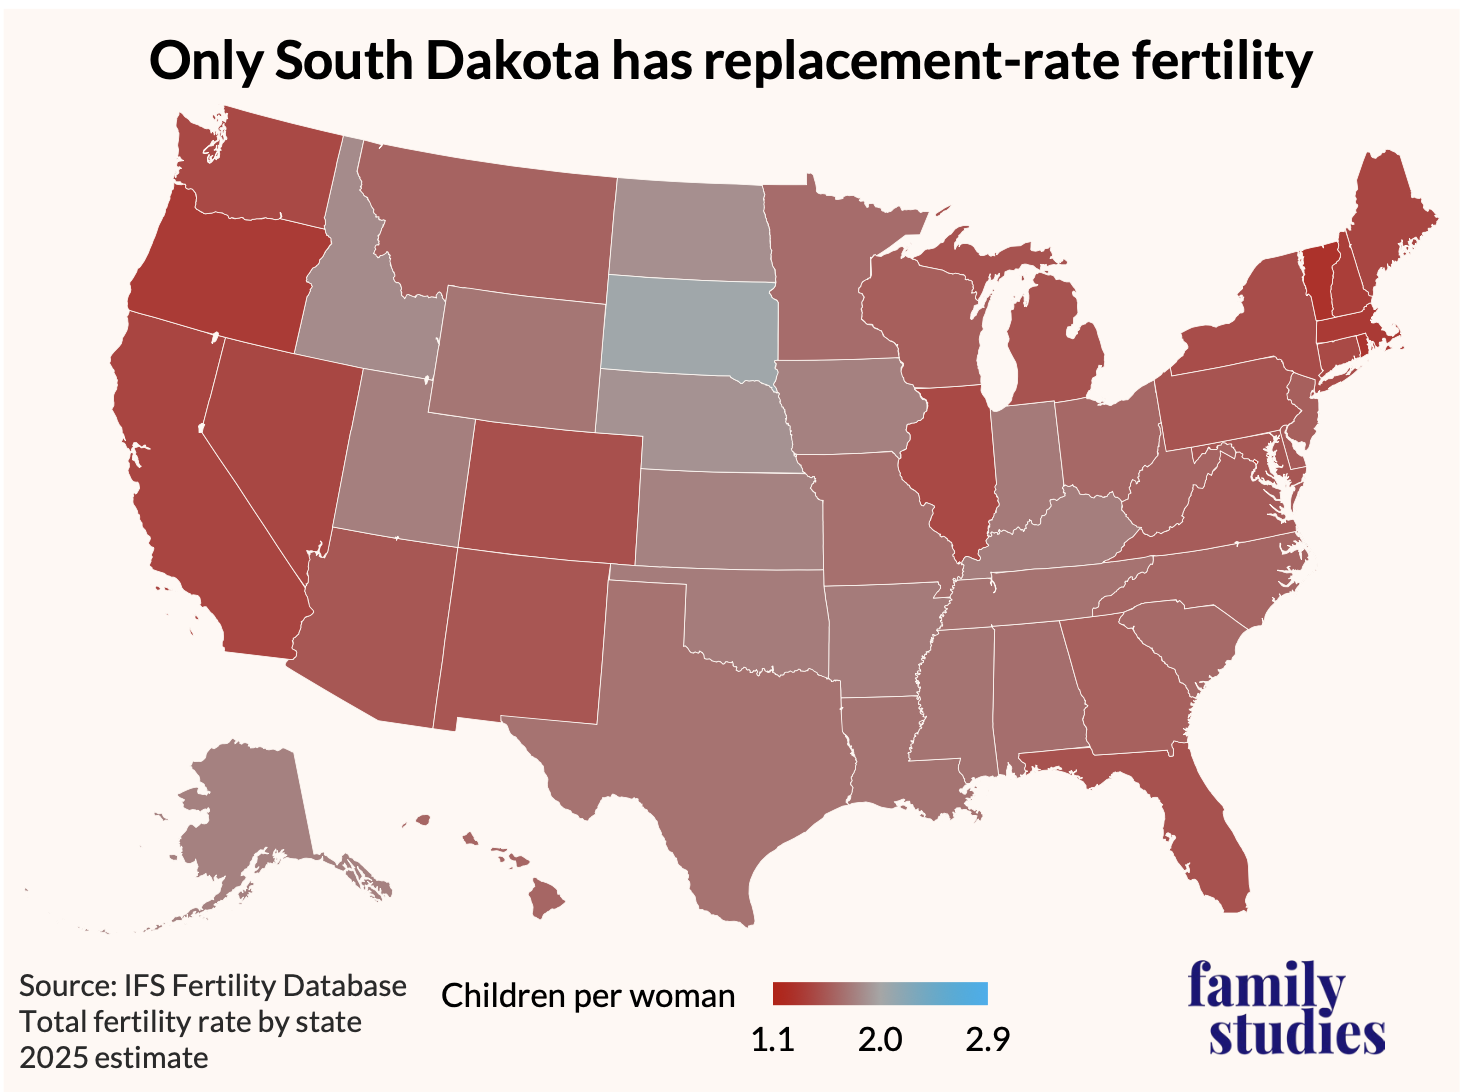
Figure 10. Total fertility rate by state, 2025
Around the country, just one state still has fertility rates high enough to be near or at the long-run population-stability level: South Dakota. Every other state is below, and some are far below. Along the West Coast, in New England, in Illinois, and in Florida, fertility rates are very low. Only in the upper South and the Great Plains does some vestige of the old American family culture still remain for reproductive-age people. But what of women who are no longer reproductive age? How does completed fertility vary around the country? Technically, women might continue having children into their 50s—but in practice, over 90% of births for recent cohorts have occurred by age 40. Thus, cumulative fertility rates experienced by women who were 40 in 2025 can give us a very strong sense of where in the nation small, completed family sizes might already be emerging. Total fertility rates are currently much lower than cohort fertility rates, which generally implies that future cohort fertility rates are likely to decline vs. present cohort fertility rates.
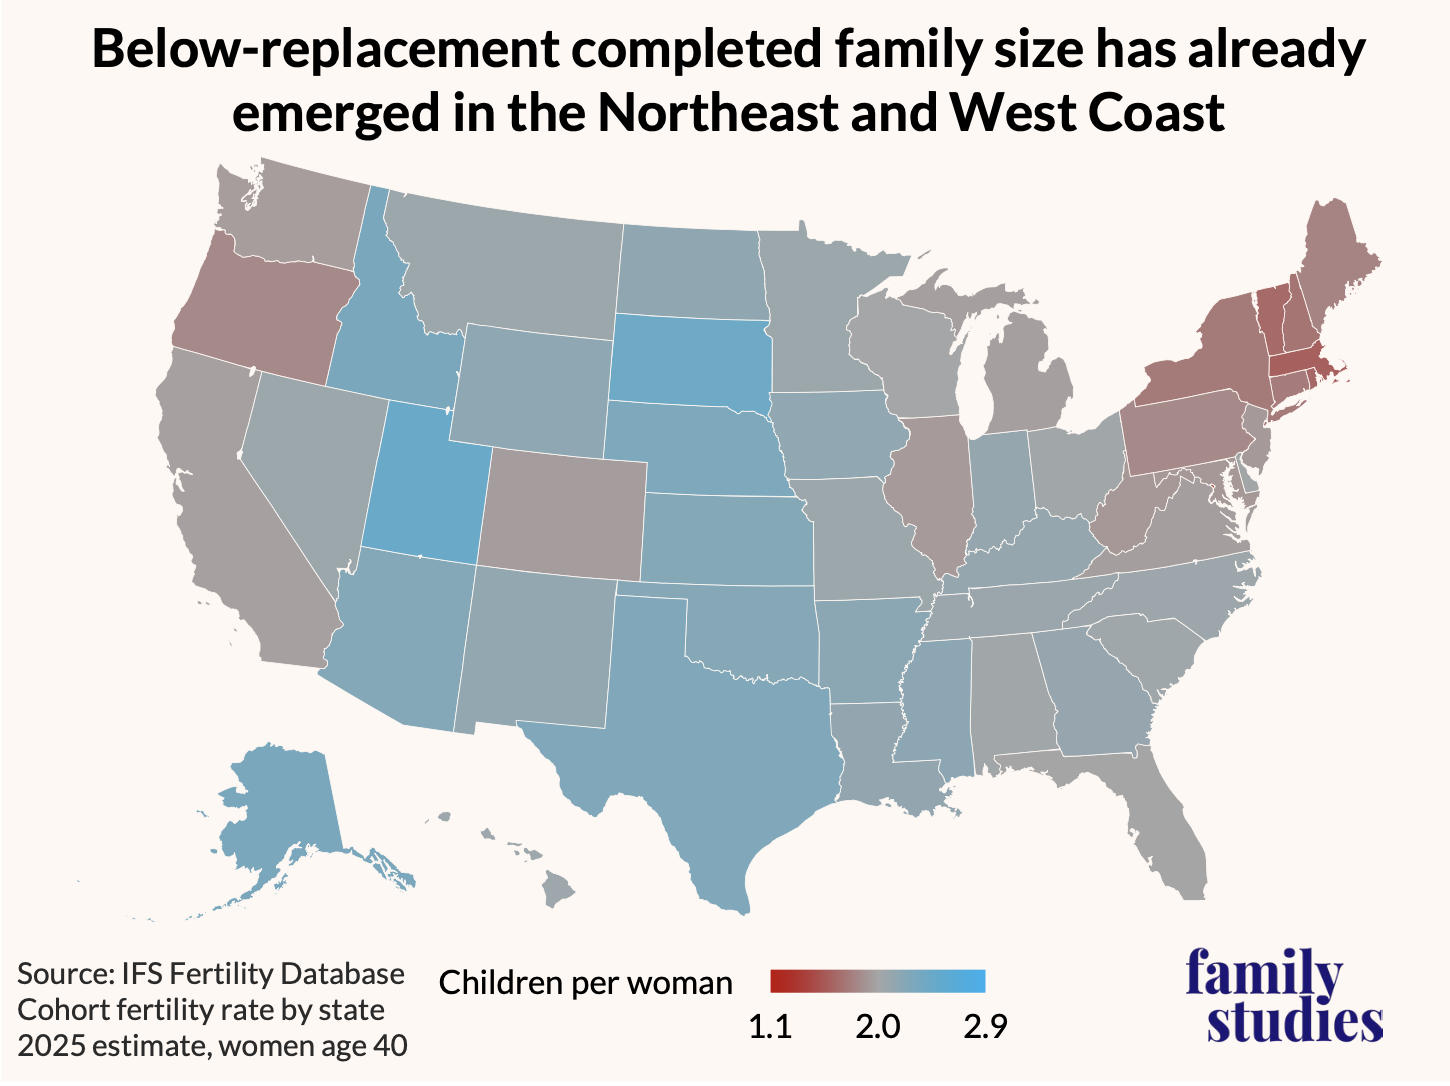
Figure 11. Cumulative cohort fertility rate by state for the cohort aged 40 in 2025
For women who are in their early 40s today, in much of the middle of the country and the South, actual fertility is near or just above replacement rates. But in the Northeast, and to some extent the West Coast, near-completed fertility rates really are very low. For women who turned 40 in 2025, cumulative Massachusetts fertility rates point to a completed family size of just 1.6 children per woman. Based on U.N. data, that’s lower than completed fertility for similar cohorts in over 200 of the 237 countries for which data exists. This low fertility rate is on par with many Eastern European countries. Eastern European women born in the mid-1980s came of age during the fertility collapse of the 1990s and 2000s after the fall of Communism. Apparently, family life in Massachusetts is about as successful as family life just after the fall of the Soviet Union.
Thus, the state of American fertility can be summed up in simple terms: not good. A nation once propelled to unprecedented heights of power by its rapid demographic expansion now rests at a fraction of its historically anticipated population because birth rates have crashed. While immigration has continued, falling fertility rates are a global phenomenon and such skilled migrants as do exist will be in demand by many countries. Reliance on migration for population growth is not a credible strategy in the long run. If current trends continue, American population may peak within the next few decades and then enter interminable decline, as we will lay out in greater detail below.
The State of Family Culture Today
In each annual State of Fertility report, we will present new data on cultural and social forces shaping American fertility. In this one, we ask a simple question: how is American friendship shaping American fertility? A growing body of research has suggested that the digital revolution may be reshaping American fertility as iPhones and social media and pornography replace social life, spread new ideas, and alter the landscape of American relationships.
The 2026 State of Family Culture Survey asked a range of new questions of Americans ages 18 to 50 and specifically explored how their social influences and friendships shape their fertility behaviors. We asked respondents how many children their three best friends had (excluding family members and romantic partners), as well as the sibling with which they have the closest relationship (if they have any siblings). This allows us to estimate the average parity of the respondent’s close social ties: up to three friends and a close sibling. Moreover, we then asked respondents how their social ties would react if they had another child. They could select from four different “positive” options (i.e., “My friends would offer to help me with my new baby,” or “My friends would cook meals for me after the baby was born”) and from four different “negative” options (i.e., “My friends would worry about my career,” or “My friends would not invite me to socialize as much”). We assessed how these and a few other social variables shaped desired family size (the number of children respondents said they’d be happiest having), as well as intentions to have any more children conditional on not yet having reached desired family size. In other words, we measured how friendship dynamics shape overall family size desires, and then, separately among respondents who hadn’t yet achieved their desires, how friendship dynamics shape their concrete intentions to achieve their goals.
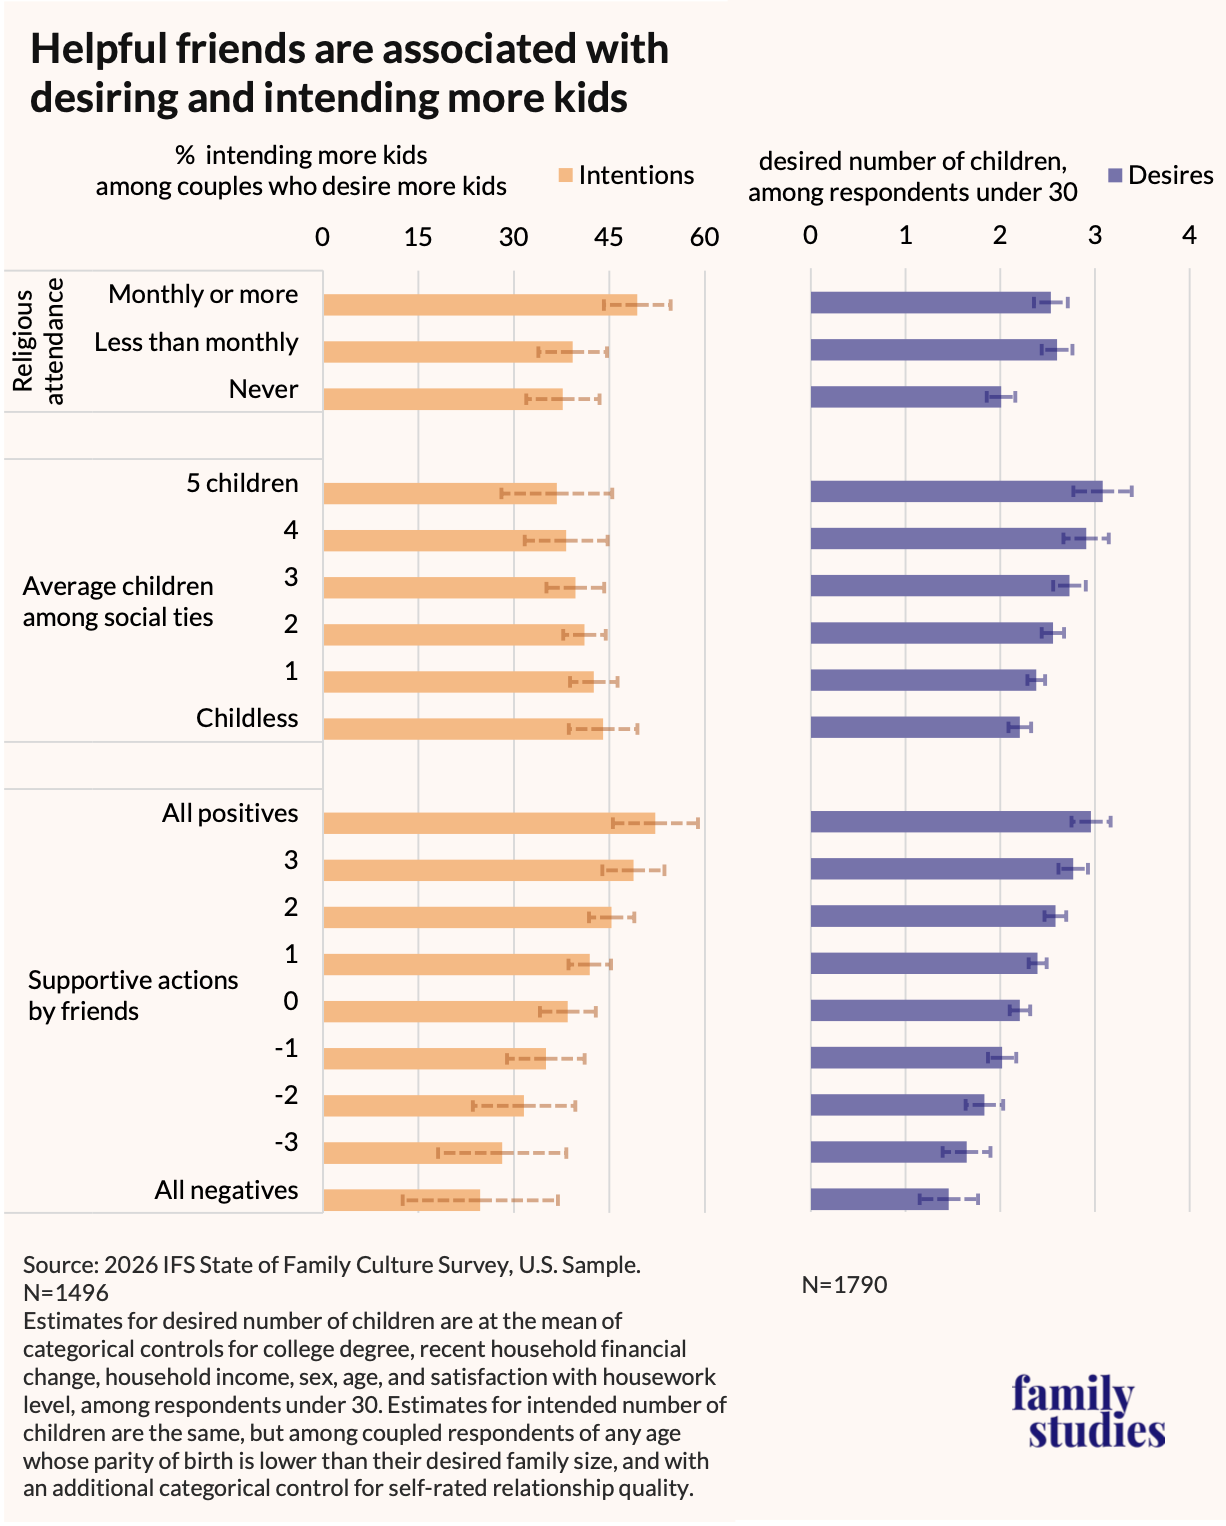
Figure 12. Children desired among under-30s and share intending children among couples interested in having more children, by religious attendance, children among social ties, and supportiveness of friends
It is well known that religiosity is closely related to fertility desires and outcomes. Indeed, as can be seen in the figure above, religious attendance predicts higher desired family size among Americans under 30 (~2 children for never-attenders at the mean of control variables, vs. 2.7 for others), and also predicts higher intentions to make progress towards desired fertility (50% for regular attenders at the mean of control variables, vs. under 40% for others).
But the associational effect of helpful friends is similar to or larger than the effect of religion. Since the estimates shown are from a model including all presented variables, we can be fairly confident that the linkage between helpful friends and fertility is separate from the effect of religion: it’s not just that religious people have more helpful friends.
For Americans under 30 with the bottom 10% least-helpful friends (i.e. those scoring -2 or less), desired family size is around 1.7 children per respondent. For those with the top 10% most helpful friends, it’s around 2.8 children—helpful friends are associated with an entire extra child in desired family size. When it comes to intentions to have more kids among couples who ideally would like more, there are similar effects: only 20-30% of those with unhelpful friends intend to have more children, vs. 40-50% of those with the most helpful friends.
Indeed, passive social influences from peers matter, too: simply having more friends with kids is associated with desiring more children. Again, while we can’t rule out reverse-causality (people who want kids may seek out friends with kids), most people form their friendships well before they start having kids, and our results are similar if we only include sibling child numbers. Our results are also unchanged if we include controls for the number of siblings respondents had (i.e. family culture of origin) and are also unchanged if we exclude nonreligious individuals (i.e. a possible source of confounding selection), or if we limit it to just childless respondents under 30. Moreover, we find that the average family size of peers has twice as much of an effect on an individual’s family size desires as their number of siblings in childhood.
Other questions we asked about parent-child relationships and extended family ties had little or no association with fertility desires. For example, we find no association at all between an individual’s number of cousins and their family size desires: big families do not intrinsically create kids who grow up to have big families. Closeness to extended family, and even stronger relationships with parents, are not strongly associated with differences in family size desires. Rather, fertility desires are more about peer culture than family culture.
Another topic we surveyed also points to the importance of peer and popular culture: publicly admired figures. We asked every respondent to report a public figure whom they most admired and why. We then collated these reports and identified how many children each figure was publicly known to have based on public celebrity or Wikipedia pages. We find that each additional child born to an admired public figure predicts higher desired family size for the survey respondent. The effect is about as big as we find for an individual’s number of siblings, suggesting mere celebrity fandom is almost as important as origin family size. Notably, these effects are larger for women and more statistically credible.
Celebrity family sizes are about as influential for family size desires as the number of siblings. Women in particular appear to have family desires meaningfully associated with the family sizes of celebrities they admire, which again suggests that popular, peer, and public culture shape family size desires at least as much as family of origin or religion.
Notably, having lots of peers with kids does not predict actual intentions to have kids among couples whose ideals exceeded their current parity (i.e. those who might be open to intending more kids). An admired celebrity’s number of children also has only a small and statistically weak association with actual intentions.
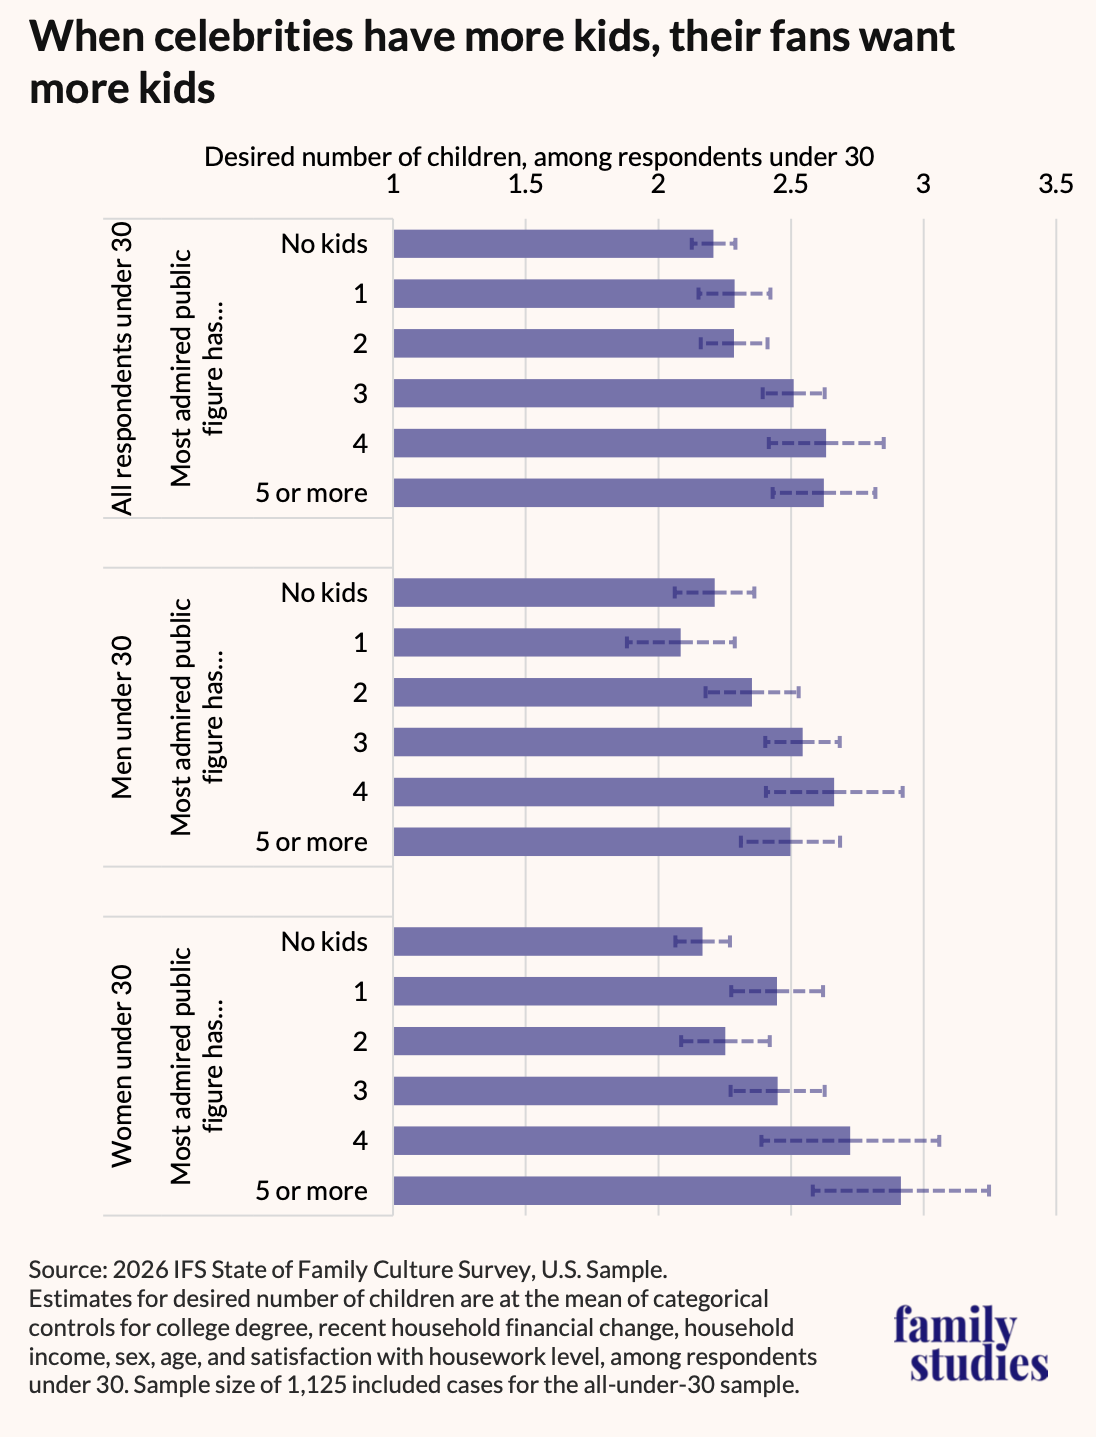
Figure 13. Children desired among under-30s, by sex and number of children of most admired public figure
To shape behavioral intentions, it is not enough to passively have friends with kids or to admire an influencer with kids—prospective parents need peers who are genuinely helpful and supportive, not just those who demonstrate big families. Demonstrative exposure to family life shapes aspirations, and those aspirations might have various knock-on-effects, but behavioral intentions among individuals whose aspirations exceed their current family size require more than just a pro-family public culture. They require peers who show up to change diapers. Moreover, given the apparently large role of social ties in shaping fertility behaviors, the idea that the digital revolution might be reducing American and global birth rates by reducing the extent to which Americans are exposed to family life is entirely plausible.
The Future of the American Family
Given what we have shown thus far about American fertility trends, and given the range of cultural norms shaping fertility, we next consider the possible range of futures for American demography.
To start with, it must be noted that existing population forecasts, such as those produced by the U.N. Population Division, the Congressional Budget Office, the Social Security Trustees, the Office of Management and Budget, or even the Census Bureau, are often too cautious and uncreative. These forecasting bodies adopt two sets of unrealistic assumptions.
First, they tend to adopt a very standard, yet unjustified, approach to forecasting net migration: a fixed, flat future net migration rate. This assumption itself is unjustified for at least two reasons. First, under President Trump, net migration has already fallen to near-zero rates, and this is likely to continue through his presidency—and he is unlikely to be the last restrictionist president of the 21st century. Second, in the very long run, immigration is very likely to decline due to declining global birth rates and ongoing changes in immigration policies. Falling fertility means there will be fewer excess young people looking to emigrate from their homes, and more countries competing to get them as immigrants, and so the default assumption should be that any given country’s immigration rate will tend to decline over the 21st century. Our assumption about migration is simple: net migration remains only a few hundred thousand people per year during the Trump Administration, then rises through the mid-21st century to around 1.5 million, then gradually declines until it is just a few hundred thousand again by 2100.
The second unrealistic assumption in most public forecasts relates to fertility. Other forecasters tend to assume various degrees of fertility recovery in the long run (except the latest CBO forecasts, which are more realistic), even though no such recovery is guaranteed.
To rectify these issues, we produce three new population projections using a cohort-component model of the same type that other statistical bodies would use, except that we assume that over the next century, immigration cannot remain permanently at a high positive level, and we model different fertility trajectories. Our fertility assumptions (Continuation, Recovery, or Revival) for these scenarios vs. public projections are shown below.
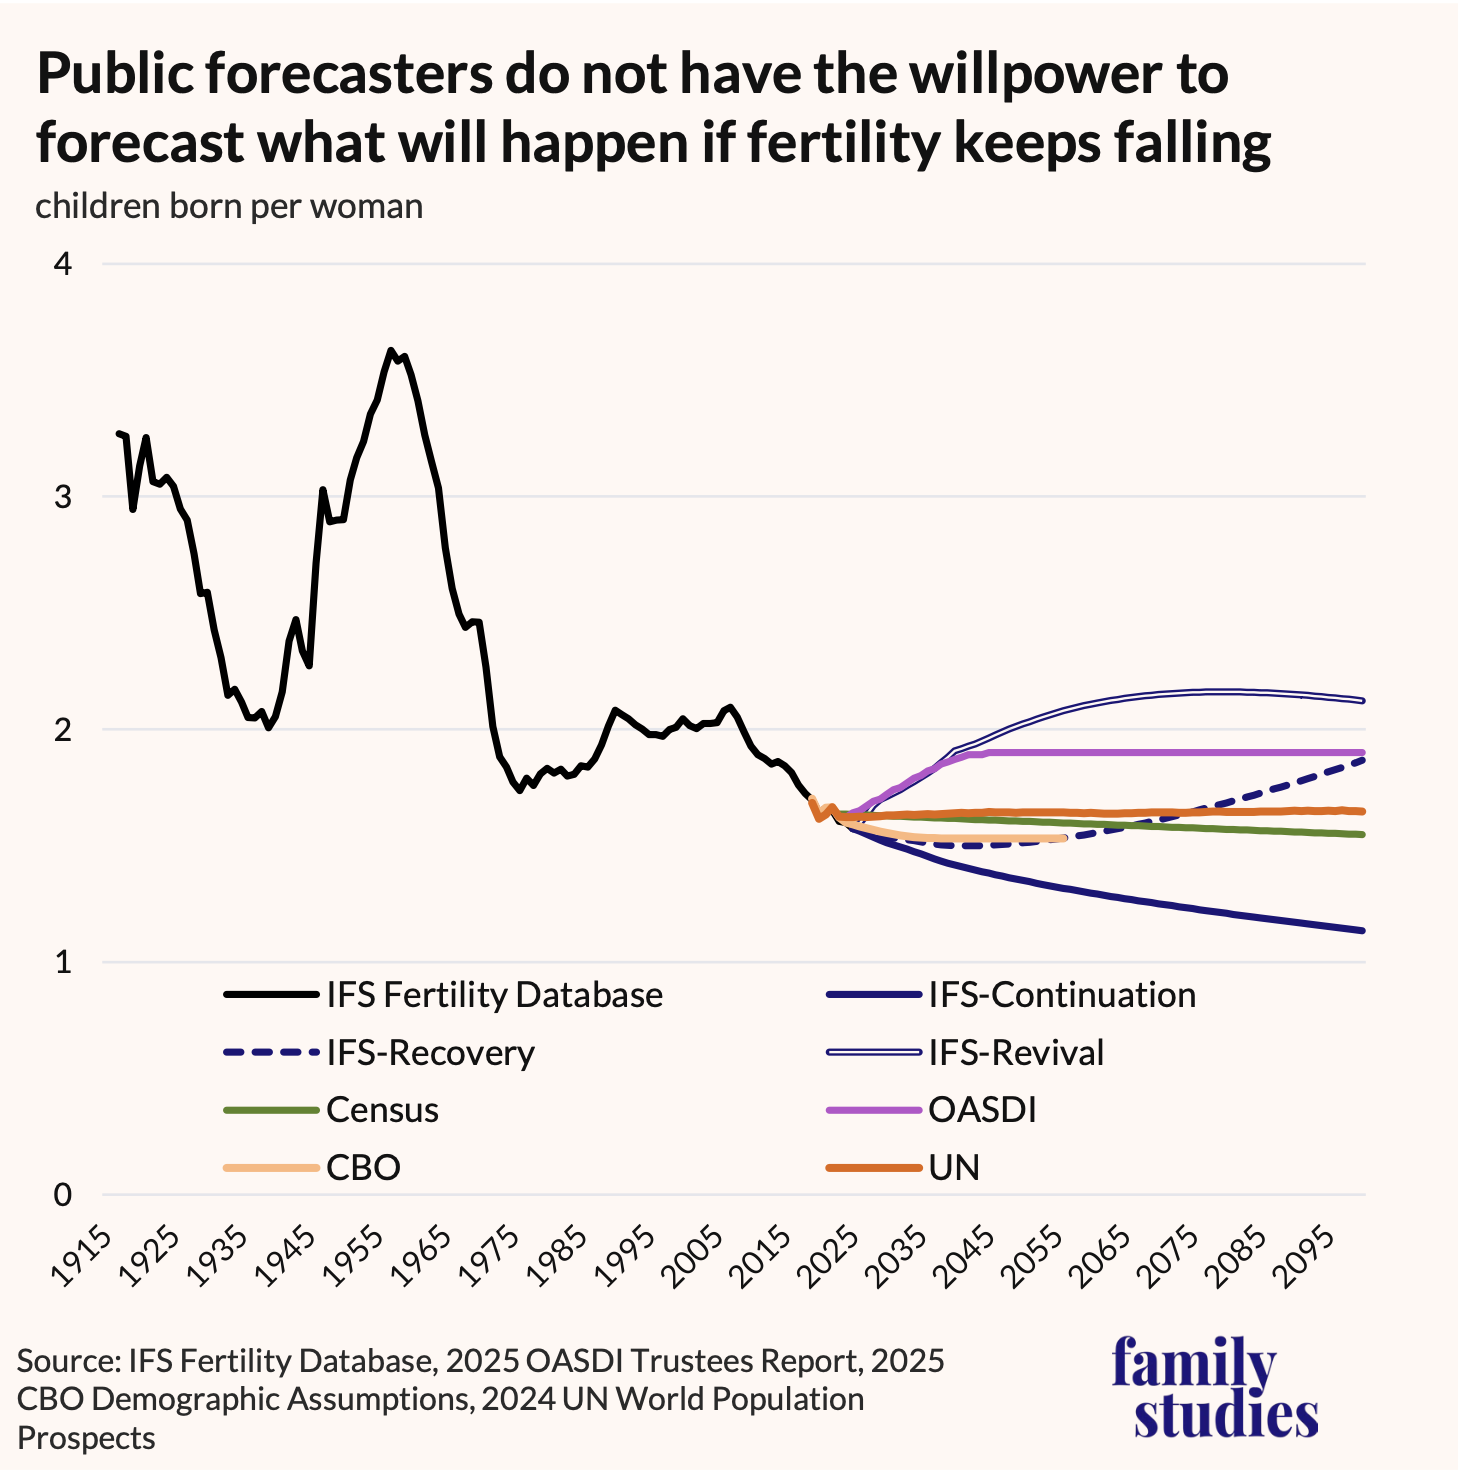
Figure 14. Historic and projected future fertility, 1915-2100, by source of projection
The Social Security Trust Fund (OASDI) does consider a scenario where fertility is stagnant at 1.6, but they do not even countenance the possibility that fertility might continue to decline. The base scenario for Social Security, Medicare, and Medicaid budget planning assumes a rapid fertility increase similar to what we call our “Revival” scenario. On the other hand, the UN and the Census Bureau more-or-less straight-line birth rates at recent levels, while CBO, almost alone among the forecasters, offers a plausible scenario where fertility falls, then recovers a bit as women delaying fertility rush to make it up. CBO’s scenario is similar to our “Recovery” scenario—but no forecaster has had the political capital and resolve to actually tell the American people what will happen if fertility keeps falling.
We do so here. In the next figure, we show what will happen to American population if, as in our “Continuation” scenario, fertility drops to 1.35 by 2050 and 1.15 by 2095; or, at the other extreme in our “Revival” scenario, what will happen if fertility rises to 2 by 2050 and 2.1 by 2060.
If something like what CBO expects, or what we term a “Recovery” scenario occurs, then population growth will continue at a low level until the 2080s. The U.S. may continue to barely eke out a slow pace of growth well into the 21st century. Growth would be far lower than it has been for most of our history. Edward Wigglesworth’s ghost would be infinitely disappointed in us, but the American experiment would not go into reverse for some time yet.
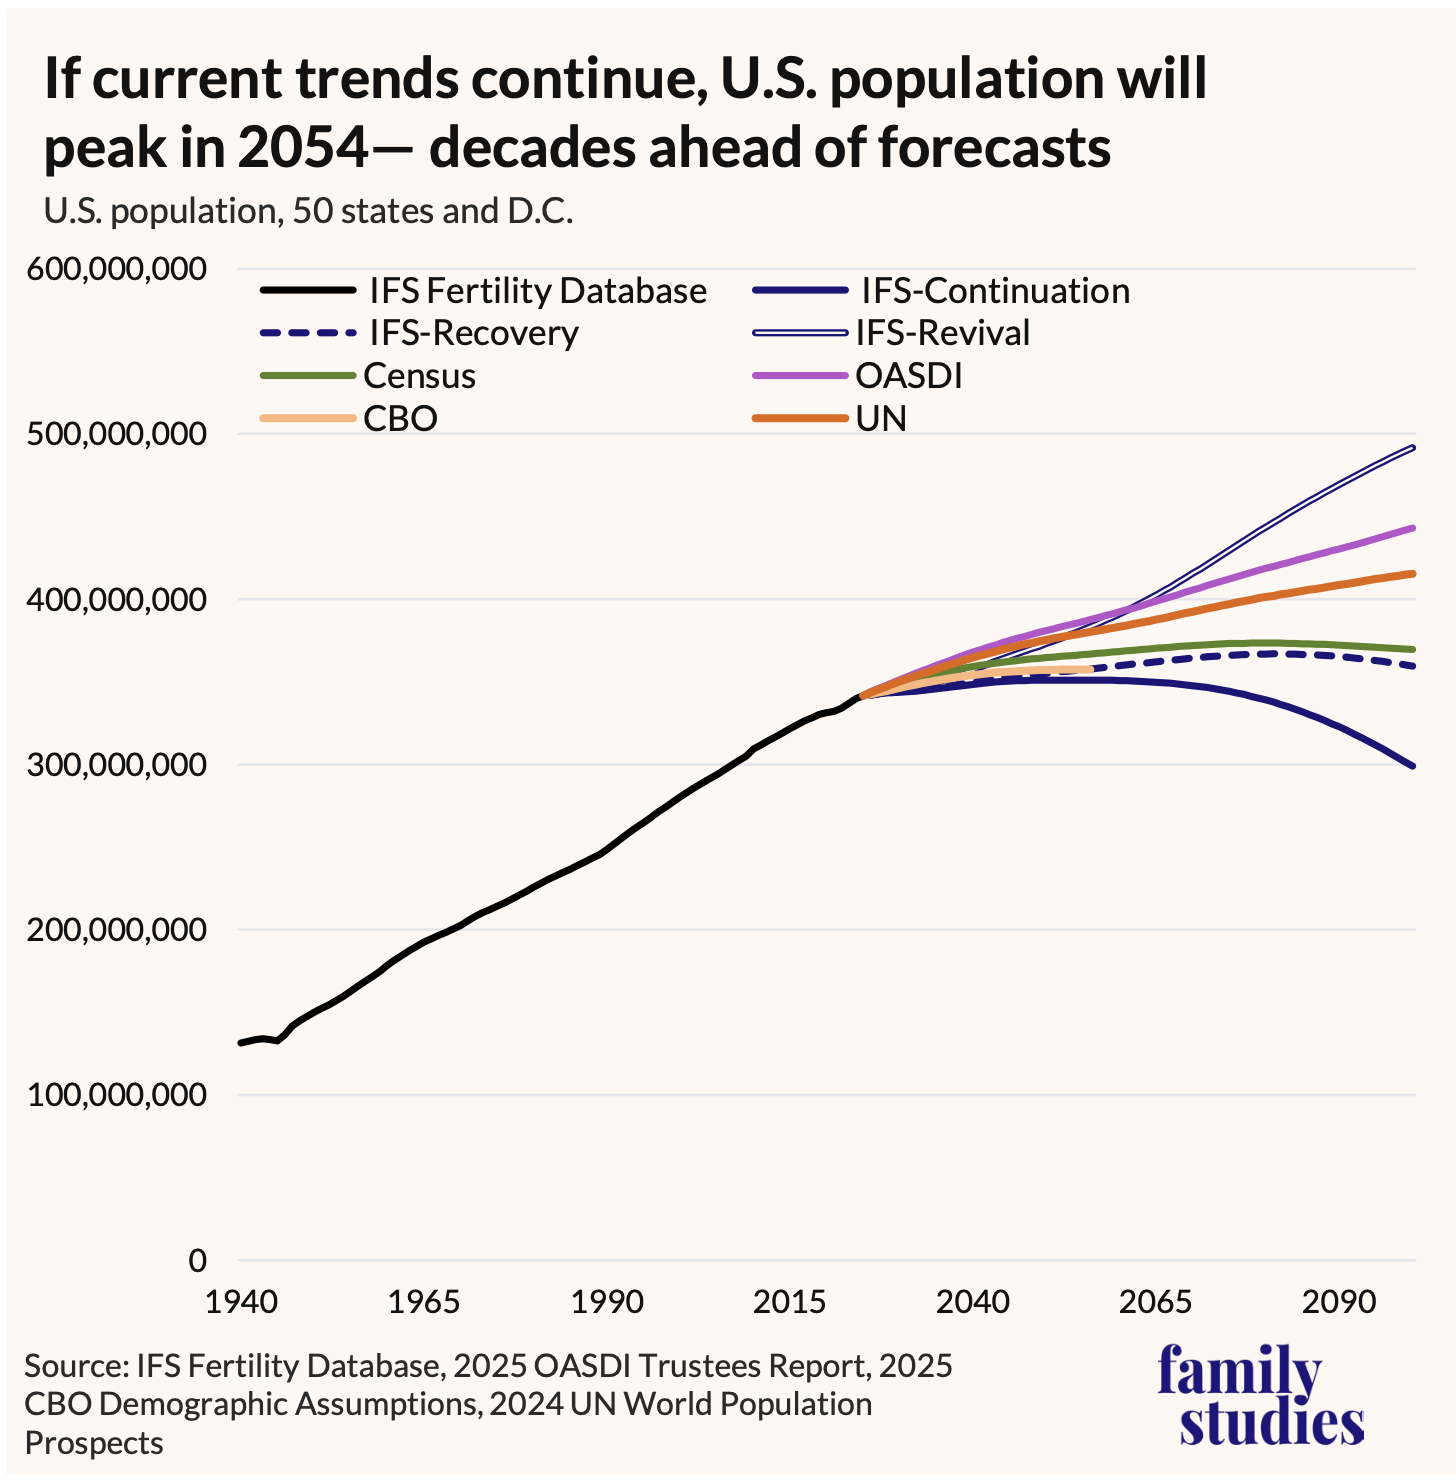
Figure 15. Historic and projected future population, 1940-2100, by source of projection
But if current trends in fertility rates continue and if births keep getting postponed later and later, then population will peak in the mid-2050s and then go into relatively rapid decline. In this scenario, the latter 21st century will see America in demographic—and therefore economic and political—retreat.
That’s the bad news. But the good news is that there are ways to avoid this outcome, and to make the Recovery scenario more likely—perhaps even to achieve the trends we list as a Revival, i.e. a return to replacement-rate fertility or better.
How To Restore American Family Growth
There are five major reforms which, in combination, could restore the fortunes of American fertility. Beyond these five major reforms, we describe three key cultural domains where, if Americans want to see population revival, the culture will need to change.
Pronatal Policies
Reform 1: American Birthday Accounts
President Trump launched a small savings account seeded with $1,000 to give emerging adults a leg up in his “Trump Accounts,” passed in the One Big Beautiful Bill. The Heritage Foundation has proposed a larger investment intended to mature upon marriage. These ideas are good starts. But the most complete proposal in this regard is a recent proposal in Finland called Vauvasampo. Adapted for the American case, this proposal is simple: every child born as a U.S. citizen in 2026 or any future year would have some amount of money, perhaps $15,000, invested in their name, which we call “American Birthday Accounts,” in honor of our 250th year of independence.
Beneficiaries could not touch these accounts until they have a child; that is, until they are the legal and custodial parent of a related child born in the United States or under U.S. jurisdiction abroad, and coresiding with that child or else deployed on U.S. government business. At the first birth (or, if preferable to avoid risks of early child abandonment, at the child’s 1st birthday, if still coresident and full custodial), they would gain access to, say, 50% of their account’s value, and the residual 50% would continue growing. At the second birth, 75% of the fund’s remaining value at that time could be claimed. At a third birth, all remaining funds can be claimed. Assuming funds are invested in something like a mutual fund, a $15,000 investment could easily lead to a married couple receiving a baby bonus worth $100,000 for a first birth, with smaller additional payments for subsequent births. Recipients could be permitted to cash out their benefit over multiple years if they preferred, and any new funds gained through subsequent births would be added to this continuing fund.
This baby bonus money could be counted as income, which means that part of its cost would be directly recouped through interactions with means tested programs and income taxes: beneficiary families at both very low and very high incomes would receive smaller after-tax-and-benefit returns. All families of any income would be eligible, but in practice the real benefits would be most generous for middle-income married families, subsidizing fertility the most for working- and middle-class families. Because only children born in the U.S. would be eligible for the investment, concerns about subsidies for children of immigrants would also be alleviated: it would be essentially a subsidy only for U.S.-born individuals to have their own children. Because married couples would be eligible for each parent’s baby bonus, the benefit would effectively double for married couples. To avoid creating subsidies for teen pregnancy, fund accessibility could be set aside until parents reach an appropriate age (perhaps 21 for a first birth, and a slightly higher age for subsequent births).
Bang-for-buck, American Birthday Accounts are the single best way to get more babies born in stable families than almost any other policy imaginable. In the long run, since many individuals will have fewer than 3 children (and many will be childless, thus leaving many funds unclaimed), those unused funds can be reinvested in the program to create a rolling national family trust fund, which would render the program zero-cost to taxpayers after the first eligible generation had completed their childbearing. Even without that reinvestment, the budgetary cost for an investment of $15,000 to $20,000 per child would be between $45 and $80 billion per year. For comparison, U.S. public schools spent just under $19,000 per year per student in 2021, so this program amounts to the public investing just one year of schooling worth of public resources into children’s future family life.
Assuming American fertility responds to cash incentives the way fertility has responded to cash incentives that we studied in other countries, these American Birthday Accounts would likely boost fertility by between 20 and 40% for the cohorts eligible to receive the benefit. If reproductive-age Americans today already had such accounts, birth rates would be somewhere between 1.9 and 2.2 children per woman—essentially at replacement rate.
Reform 2: Child Caregiver Credits
When a family has a child, they face new expenses. One parent may also stay home from work. The result is that after having kids, families save less. Childcare, diapers, and work disruptions cause parents to approach retirement with fewer resources than they should have had based on their human capital. In dozens of countries around the world, this problem has been addressed through care credits. These credits have a simple principle: if a person has a child under the age of 5 at home, for the purposes of future Social Security benefit calculations, they should be “credited” as if they were still working at their income levels 1-3 years before birth, adjusted for inflation. This gives stay-at-home parents (especially mothers) slightly better retirement benefits, reduces the harms that women especially face from employment disruptions, and helps recognize that parents are doing the real work of keeping Social Security solvent by raising future payers.
While we cannot estimate exactly what effect this change would have on fertility, back-of-the-envelope calculations suggest that a four-year care credit of this sort could plausibly boost the Social Security benefit by 1% to 3% for a mom who took five years off work to have two children. For a mom who took 15 years off to have four children, care credits might boost her social security benefits by 5-10 percent. Converting these benefits to their net present value at time of childbearing, and using that to infer fertility impacts, only implies a fertility increase of perhaps 1% or 2%, but ensuring basic fairness for parents is a benefit in its own right.
Reform 3: End Marriage Penalties
Nearly every means-tested program in America creates marriage penalties one way or another, and this discourages family formation. Policymakers must establish a simple principle: getting married should never cause anybody to lose a benefit. In practice, this amounts to suggesting that the U.S. should adopt fully individualized tax and welfare programs. Sweden, Canada, and the U.K. have all changed from joint-filing to individual-filing systems in the past, and in all three cases, fertility rose sharply afterwards.
The reason is simple: household-filing and household-benefit systems have a strong tendency to punish marriage for working-class people. If switching to an individual system is a bridge too far, policymakers should simply go through existing tax and benefit programs, line-by-line, and remove marriage penalties, especially in Section 8 housing benefits, Medicaid, the Children’s Health Insurance Program, WIC and SNAP nutrition programs, the Child and Dependent Care Tax Credit, interest deductions for mortgages and student loans, FHA loan eligibility rules, and the Earned Income Tax Credit.
We are unable to provide a specific effect estimate for how marriage penalty elimination might influence fertility, since the academic literature does not currently contain standardized effect estimates for either how marriage causally shapes fertility, nor how marriage penalties causally influence marriage. Nonetheless, we believe that these effects could be substantial. In Sweden, Canada, and the U.K., a switch to individualized tax systems was associated with about 0.05-0.15 more children born per woman.
Reform 4: Build Family Housing Now
American young people face a housing crisis. There has been zero increase in residential square footage per capita in 25 years according to federal data. New houses are shifting heavily towards small apartments. Home prices have skyrocketed to many multiples of young adult incomes. America must build more family-suitable houses.
The federal government can encourage this by adopting an extremely simple program: allocate municipalities and states alike a fixed sum per bedroom of housing completed each year. A moderate portion of existing block grant funds could be repurposed and reallocated on the basis of bedrooms being constructed, justified by the simple notion that places building more housing and thus anticipating more population growth really do need and deserve more block grant funding to prepare for a more populous future. Places refusing to build housing can make do with the federal funding they currently have.
Reform 5: Institute Family-Impact Budgeting
At the structural level, Congress and state legislatures must begin to undertake “family budgeting.” Legislators must ask not only how a bill might impact revenues and spending, but how it will impact marriage and fertility. Every bill that receives a cost score should also be scored for how it impacts incentives to marry and have children, giving legislators a constant reminder that their choices have consequences for the physical survival of the nation, not only of its financial accounts.
In combination, we believe instituting these reforms could raise U.S. birth rates to at least 2.1 children per woman and perhaps as high as 2.4 children per woman if marriage effects prove to be substantial.
Family-Friendly Cultural Norms
Norm 1: Enlist Celebrity Culture
Our survey results imply that enlisting celebrities to promote American family life may work—celebrity fertility really is associated with the fertility of fans. Governments interested in boosting fertility should consider enlisting the support of celebrities popular in their jurisdictions, or perhaps even finding a way to obliquely encourage those celebrities to marry and have more children.
While we would not endorse or recommend such a policy, it is empirically possible that paying Taylor Swift a billion dollars to have children might produce more children in society than spending the same money on child tax credits, if her choice sways her wide fanbase. More broadly, to the extent that social and cultural elites set the tone for family life, large tax breaks for parenthood at high incomes (of the sort which France implemented through its family quotient system) might stimulate elite fertility, thus, creating downstream cultural spillovers to fans and followers.
Outside of government, it would be worthwhile for churches and community actors to consider the social role of parents and families: are they nudged into the back pew, their children sequestered in Sunday school where they can’t bother anyone? Or are parents full participants in community or church leadership—with their children at their side?
Norm 2: Encourage Supportive Friendship
Helpful friends make a difference. The first thing governments can do to support more supportive friendship is to ensure that informal care arrangements are not punished. Liability and negligence laws and enforcement norms should not punish parents for leaving children with friends. Safe-harbor and Good Samaritan-style liability protections, as well as “free range parenting” laws may be advisable.
More broadly, governments could consider creating “civil godparents,” that is, legally recognized roles for specifically designated friends or kin of parents, giving those friends broader in loco parentis rights to care for children.
Likewise, hospitals could modify antenatal and postpartum care such that nurses making postpartum visits encourage new parents to call friends to come visit the hospital, or prenatal care includes efforts to help expecting parents produce a list of friends they can call to help. This method of “legitimating the request” may help parents overcome embarrassment to ask for help.
Beyond this, governments often confer status through public campaigns—blood donation and organ donation is almost entirely motivated by appeals to conscience and moral status. Governments could emulate these campaigns for care donation: watching your friend’s kids. This approach would effectively confer honor and status on the individuals who do the helping.
Further, local municipalities could experiment with subsidies and liability protections for small, designated play areas in coffee shops, grocery stores, and restaurants, where parents can socialize amid productivity.
While the government cannot mandate supportive friends, it can create conditions where parents and their friends get helpful nudges into helpful behaviors. Needless to say, the kind of supportive friendship described here can only be nudged by government—but they can be supported by book clubs, mom groups, churches, running clubs, pick-up basketball leagues, and other social groups. They can celebrate one another’s family additions, create schedules for babysitting, drop off meals or DoorDash gift cards, and help each other in any number of ways.
Norm 3: Promote Real-Life Socializing
Simply having more friends with kids matters for fertility, but a key driver of having more friends with kids is simply having more friends. Indeed, the average number of children in an individual’s social circle is strongly correlated with their average number of close friends: individuals under 30 with fewer than 4 close friends average around 0.7 children per friend; whereas those with 5 or more average around 1-1.3. And yet, the number of close friends Americans have is in persistent decline. Moreover, Americans are spending less and less time together with their friends. These changes are part and parcel of a long-term decline in American social lives. Reversing this decline must be a central part of any project of cultural change.
Schools can certainly restrict mobile devices during school hours and at extracurriculars as one step, and should also consider expanding recess time. Limiting how many assignments require devices, reducing solo-homework assignments, and instead assigning group projects requiring in-person collaboration, may also be a useful avenue.
Expanded public funding for public sports and athletics fields alongside higher usage fees charged to pay-to-play teams, alongside reduced liability for volunteer coaching and informal play, could help restore neighborhood sports and reduce the all-consuming professionalization of travel sports.
Policymakers should also at least consider more creative options: reinstituting Blue Laws requiring business closures on Sundays might help create more in-person community, for example. And what about “Digital Blue Laws”—laws which impede access to non-essential digital services on certain days or at certain hours? Could such laws be implemented? One possible vehicle might be to charge excise taxes on data usage on Sundays, or excise taxes on digital advertising expenditures on Sundays, essentially encouraging platforms to nudge users offline at those times.
Laws around existing physical spaces could be tweaked as well—would higher taxes on alcohol sold for home consumption alongside lower taxes on alcohol sold in bars and restaurants lead to more spontaneous friendships? Would raising taxes on restaurant delivery while reducing taxes for in-restaurant dining create new communities? Could expanding the supply of quality park shelters and other bookable spaces be part of a broad “in-person friendship agenda?”
The exact pathway to restoring American friendship is not clear, but policymakers should consider bold experiments.
Conclusion
American population growth has already slowed dramatically and is likely to grind to a halt or even go into reverse in the relatively near future. Some current workers may see population decline before they reach retirement, if current trends continue. This is a serious problem and is not the family future most Americans desire.
Unfortunately, tackling this decline is not just a problem of fixing one or two small issues—fertility is shaped by innumerable factors, including many cultural and social norms governments may struggle to change. Nonetheless, if policymakers will consider policy changes equal in magnitude to the size of the problem we face, Americans need not have anything to fear. Demographic decline is a choice, one that our nation’s leaders can choose to avoid, if they will invest in the future of family. Perhaps, with luck, at our 350th anniversary, we might finally reach Wigglesworth’s billion.
Editor's Note: For Data and Methods, author information, and references, please download the full report below.