Executive Summary
The federal government collects a wealth of data to help us understand what drives child outcomes in student learning, health, and economic security. Yet the government often leaves out a critical factor in its public reporting: family structure. In this report, we focus on education as one example of this exclusion. The National Assessment of Educational Progress from the US Department of Education disaggregates student performance by factors such as race and ethnicity, sex, and poverty. However, it does not report student scores by family structure on the official Nation’s Report Card—even though it has been systematically collecting these data since 2013. This omission deprives policymakers, educators, professionals, and parents of valuable insights into one of the most powerful predictors of academic success.
Indeed, this report’s analysis of the National Survey of Children’s Health demonstrates that children raised in “intact” families (in which the biological or adoptive parents are together and married) are far more likely to thrive in school and life than are their peers from other households. We find that children in non-intact households—where children are living with stepfamilies, cohabitating parents, single parents, or foster or kin-based families such as in grandparent-led homes—are 13 percent less likely to receive A’s and B’s than those raised in an intact, married-parent home, 47 percent more likely to have their parents contacted for problems at school, and more than twice as likely to be depressed. We also find, in this instance, that family structure is a more powerful predictor of school problems, academic performance, and depression than are race and poverty.
These are important findings because public policies, research, and discussions related to education, human services, and health policy often focus on race and poverty but neglect family composition. Indeed, despite the federal government’s commitment to reporting outcomes by different demographic groups, family structure is often ignored. Though our findings in this analysis are not necessarily general results, they indicate that family structure ought to be studied further to determine the extent to which its predictive strength is a general result.
To remedy this, key federal reports from the Department of Education and other federal agencies that monitor child well-being should make family structure a standard and consistent data category used to report child outcomes. They should also make sure standard family-structure categories are included in reports that analyze surveys on child well-being. Doing so would shed light on the impact different family compositions have in shaping student outcomes and children’s well-being. These data insights would empower key stakeholders to move beyond incomplete or misleading narratives about the causes of educational, health, and economic disparities and enable them to better serve children in their care.
By providing the public with a clearer picture of how family structure influences children’s health, student success, and economic security, federal agencies can empower schools, communities, local and state governments, professionals who work with children, and parents to address family structure when they are dealing with issues related to children’s educational success, physical and emotional well-being, and financial security. Better reporting will also help policymakers, educators, and civic leaders educate the public about the family’s role in helping children flourish inside and outside of school. Finally, reporting student outcomes by family structure will help young people understand the impact that different family types have on a range of child outcomes, thus making them more proactive regarding their own future family formation.
Introduction
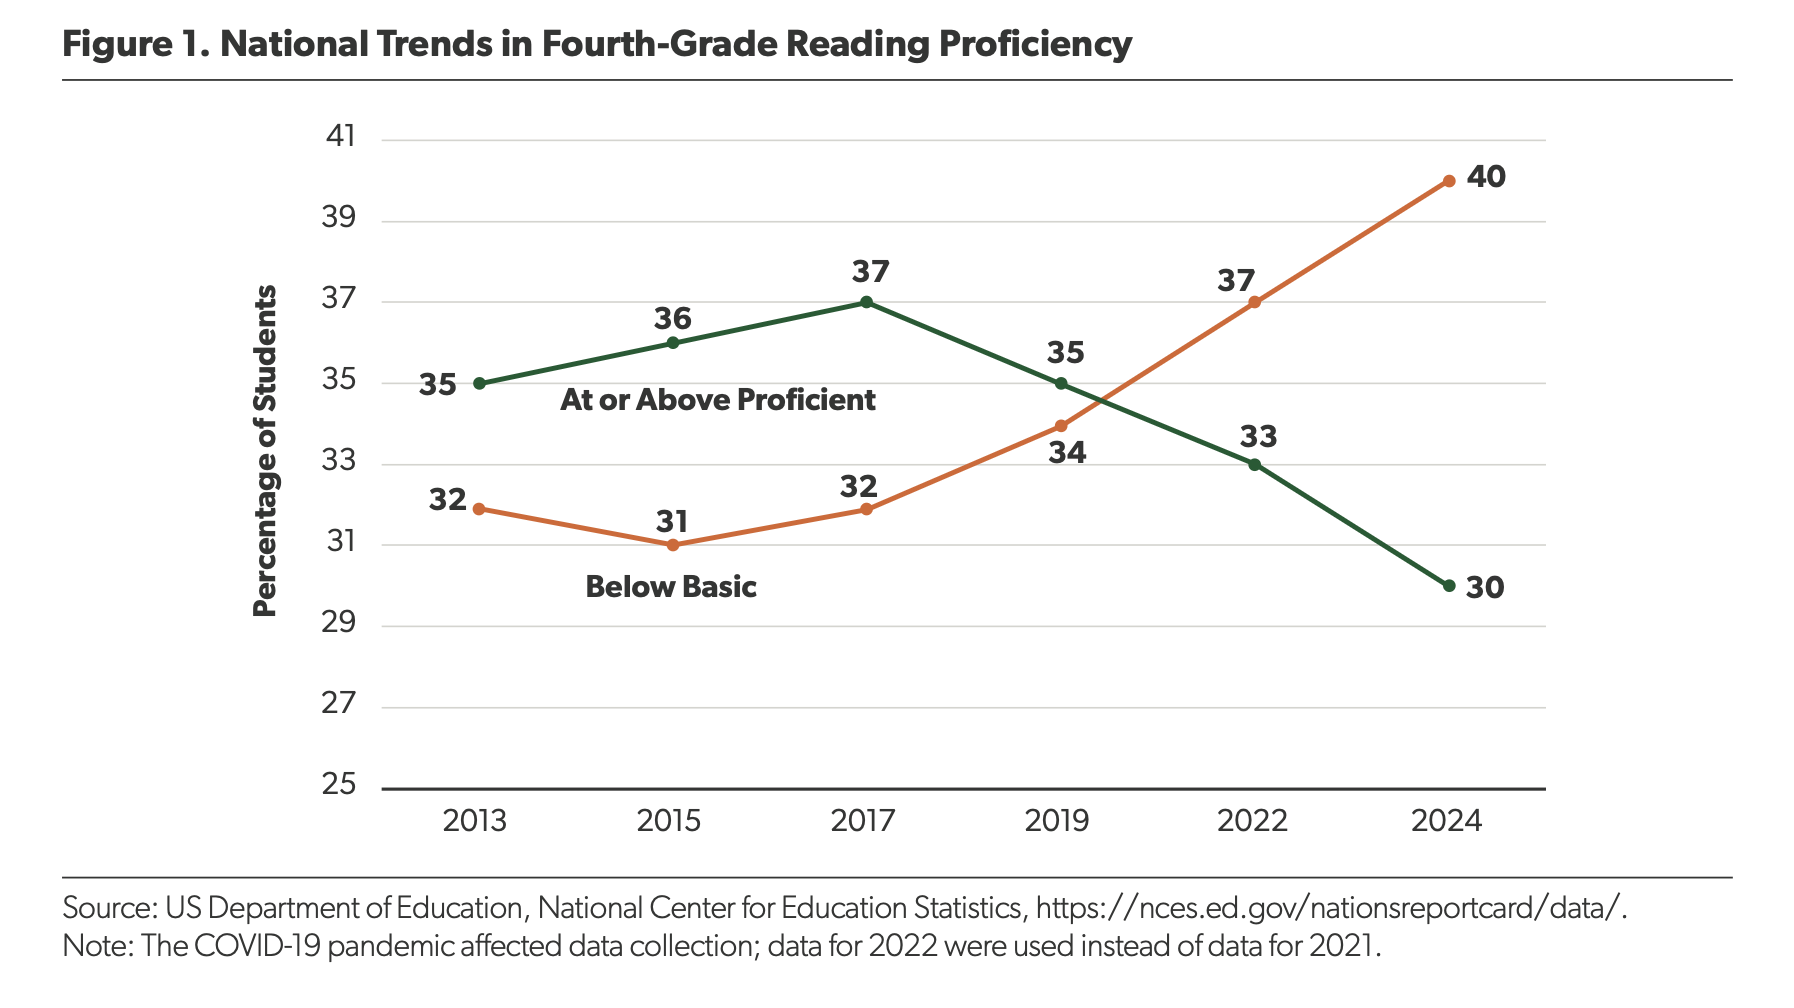
American education is in crisis. In the past decade, student performance in reading and math has fallen and reports of student misbehavior have risen. The problems are visible for younger and older students alike. Based on the 2024 National Assessment of Educational Progress (NAEP), for instance, the number of fourth-grade students scoring at the lowest category of reading capability (“below basic”) now exceeds the number of fourth-grade students reading at or above NAEP “proficient” levels. As Figure 1 indicates, this trend in fourth-grade reading began to accelerate in 2017.
Similar declines are visible for older students. According to the 2024 NAEP for 12th graders, the average percentile scores in reading and math were the lowest since the respective subject matter tests began in 1992 and 2005.
American students’ failing academic performance is just the latest evidence of American education’s current crisis, and it underscores why Secretary of Education Linda McMahon has prioritized improving reading and mathematical performance as the foundation for lifelong achievement.
Indeed, as the Trump administration reimagines the federal government’s role in K–12 education, the government has an opportunity to expand the essential data it provides to help educators, parents, professionals, and the general public understand the key factors helping children succeed or putting them at risk of failure in school. Toward that end, scholars from the American Enterprise Institute and the Institute for Family Studies wrote this report to focus on a crucial aspect of a child’s life that affects their academic trajectory but is often ignored: the structure of the family in which they are raised. Family structure reflects the various types of families children grow up in today, including those with married parents, single parents, stepfamilies, cohabitating parents, and foster and kin-based families such as grandparent-led homes.
While NAEP has collected information on family structure for more than a decade, it does not disaggregate student outcomes by family structure in its reporting. This should change. We argue that NAEP should regularly report family structure as a category alongside the legally required demographic categories of gender, race and ethnicity, socioeconomic status, disability status, and “English learner” status. While the latter data categories are required by law, NAEP is not necessarily prohibited from reporting student scores by additional categories.
What’s Missing from NAEP Analyses
Recent declines in NAEP scores underline the crisis unfolding in our nation’s schools. But our ability to address this crisis has been hamstrung by our inability to understand and address all the key factors in play. Many studies on students’ poor performance have focused on race, poverty, or economic inequality and excluded family structure.
For instance, Stanford University Sociologist Sean F. Reardon has explored the role of income- and race-based gaps in student performance using a range of datasets, including NAEP, to argue that income gaps are growing in student performance. Economists Erik A. Hanushek, Paul E. Peterson, Laura M. Talpey, and Ludger Woessmann conducted a landmark longitudinal study using data from four national assessments of student performance, and they came to a different conclusion. They argued that the “opportunity gap—that is, the relationship between socioeconomic status and achievement—has not grown over the past 50 years.” But these important studies did not explore family structure’s role in shaping student performance.
Likewise, other recent analyses of NAEP results have focused almost exclusively on the absolute achievement levels and categorical disparities for a set of “usual suspect” demographic groupings, such as race and ethnicity and socioeconomic status. For example, while 39 percent of all eighth-grade students performed below NAEP’s basic math level in 2024, a more detailed analysis disaggregated by race shows that 62 percent of black eighth-grade students scored below NAEP’s basic level, as did 54 percent of Hispanic eighth graders.
Missing from all these studies and federal reports of NAEP results, however, is disaggregated information about students’ family structure. This absence is a glaring omission in the effort to better understand the key factors that influence student learning and account for the current crises in American education. It is even more confounding given that since 2013, NAEP has consistently and continuously collected information on family structure from students, but it has never reported it.
According to the historical log NAEP has kept since 2000, the 2013 NAEP Student Questionnaire for Reading Grade 4 introduced a new question: “Do any of the following people live in your home?” The answer set allows children to choose multiple answers: mother, father, stepmother, stepfather, foster mother or other female legal guardian, or foster father or other male legal guardian. (See Figure 2.)
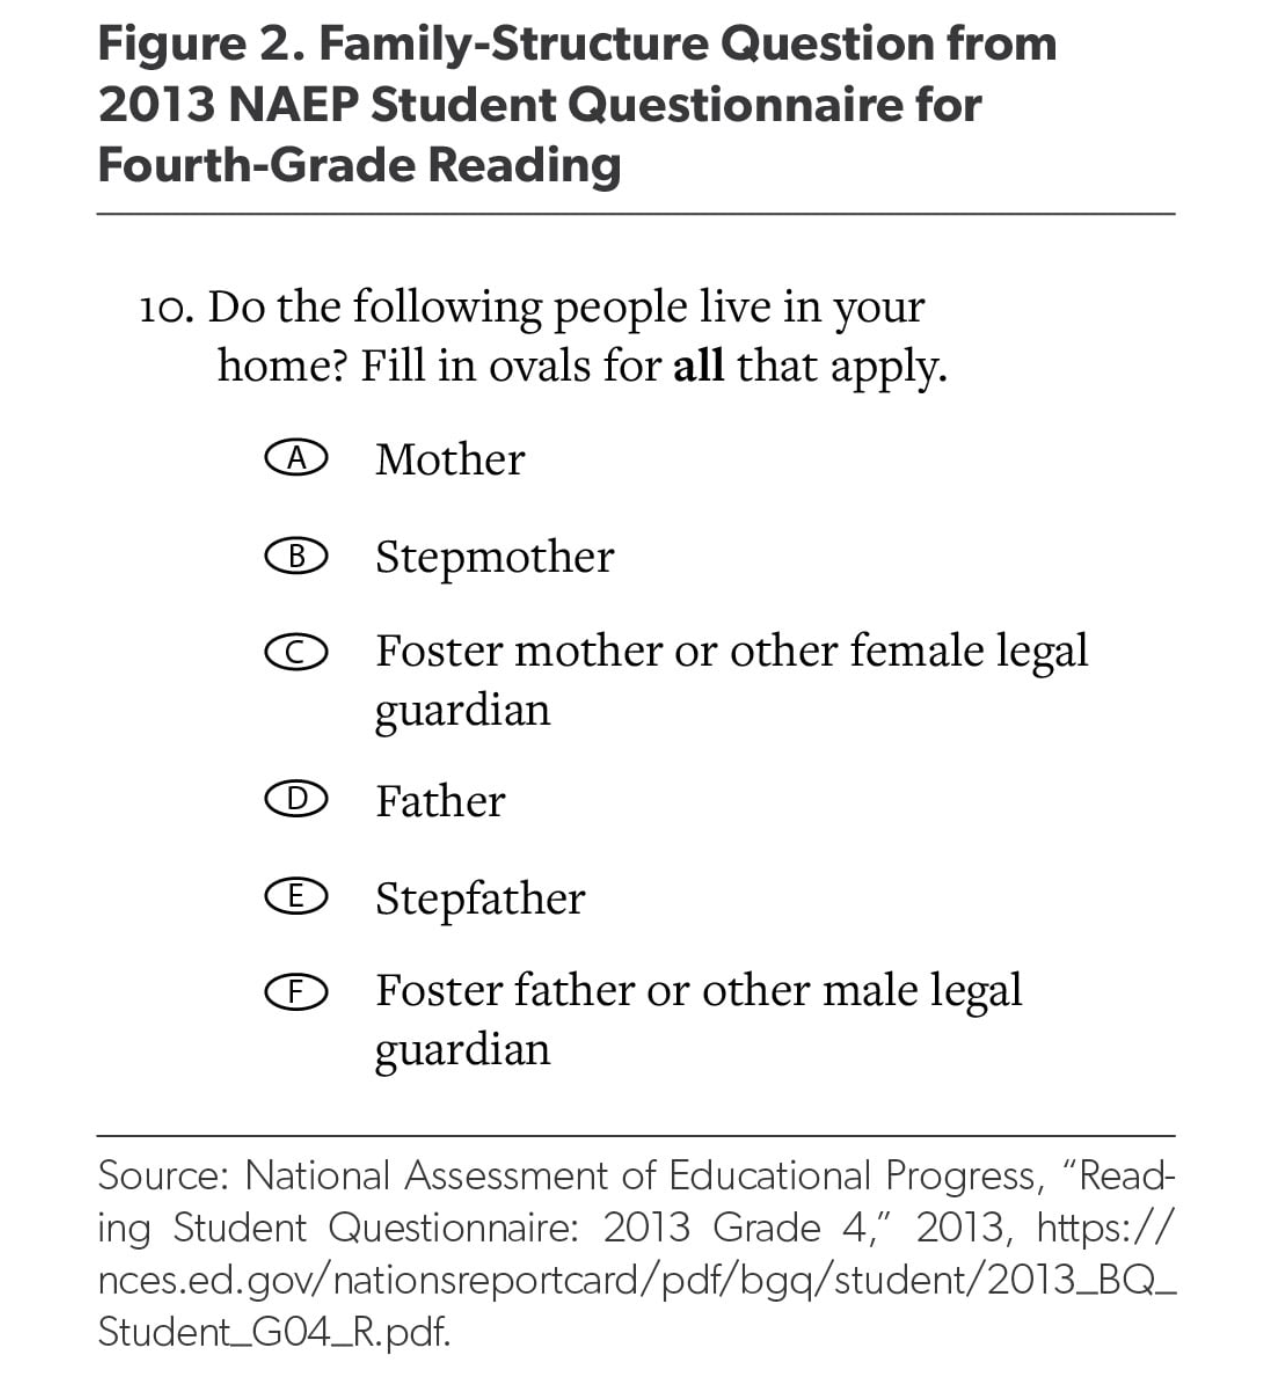
From 2013 to 2024, NAEP has included this same query on student questionnaires across mathematics, reading, science, civics, geography, and US history in grades four, eight, and 12. Recognizing that this information had previously gone uncollected, NAEP clearly made a deliberate choice to comprehensively gather family-structure information in more recent years.
Yet NAEP has not proactively reported student achievement information disaggregated by family structure, nor has NAEP made it easily accessible on the NAEP Data Explorer tool. While reporting student outcomes by broad demographic categories is valuable and necessary, it is insufficient. Omitting family structure in NAEP’s reporting could create three significant negative consequences:
- Crucial nuances related to other demographic factors may be obscured when key factors like family structure are excluded. This can lead to misdiagnosing the reasons children are succeeding or failing academically. For example, according to the American Community Survey, 80 percent of Asian children and 69 percent of white children live with their married birth parents. This compares with only 52 percent of Latino children and 30 percent of black children. More detailed analysis is required to show how disparities in family structure within the race category may be more relevant for student outcomes than the umbrella concept of race itself. In other words, when scholars, policymakers, and educators focus on race and ethnicity as key drivers of student outcomes and overlook family structure, they may unduly emphasize these drivers and miss how much family-related factors matter for student outcomes.
- There is a misguided school of thought arguing that any disparity in a broad demographic category must be due to discrimination within that category. This is a causal fallacy—mistaking correlation for causation. For example, some believe that racial disparities in student outcomes must be caused solely by racism, as opposed to other factors such as differences in family structure across race. These reductionist conclusions, particularly regarding race, have led to the embrace of diversity, equity, and inclusion initiatives focusing on race and ethnicity as the key drivers of student performance. But by overlooking important factors like family structure that shape student achievement, approaches focusing on race, ethnicity, or socioeconomic disadvantages may miss understanding and addressing family dynamics that are more consequential for students than their race and ethnicity or economic status.
- Omitting family structure squanders the opportunity to delineate how different family types within family structure affect student development. For example, in its 2010 report Family Structure and Children’s Health in the United States, the National Center for Health Statistics declared that “in view of the changing family-structure distribution, new categories of families such as unmarried families or unmarried stepfamilies need to be studied so that the health characteristics of children in nontraditional families can be identified.” The report defined seven distinct and mutually exclusive family structures: nuclear, single-parent, blended, unmarried biological or adoptive families, cohabitating, extended, and other—the last being a family consisting of one or more children living with related or unrelated adults who are not biological or adoptive parents (e.g., grandparents).
While NAEP doesn’t report on student achievement outcomes by family structure, analysis of other government surveys reveals the specific impact family structure can have on academic outcomes. For instance, in Virginia, the Good Fathers, Flourishing Kids report found there is no racial divide in academic performance between white and black children from intact families. (For the purposes of our report, “intact families” are homes headed by children’s married birth or adoptive parents, and “non-intact” families are households where children are raised by stepparents, single parents, cohabitating parents, foster parents, or kin such as grandparents.) This suggests that family structure may be more explanatory than race when studying some student outcomes. Likewise, the 1997 National Longitudinal Survey of Youth indicated that family structure is about as powerful a predictor of college graduation as family income or race is.
Here, we examine the National Survey of Children’s Health to explore the associations between family structure, race and ethnicity, poverty, and three key outcomes for students inside and outside of the classroom: the number of times a school contacts a household regarding their child’s behavioral or learning problems, student GPA, and depression.
Student Outcomes
Schools Contacting Households Regarding a Student’s Behavioral or Learning Problems
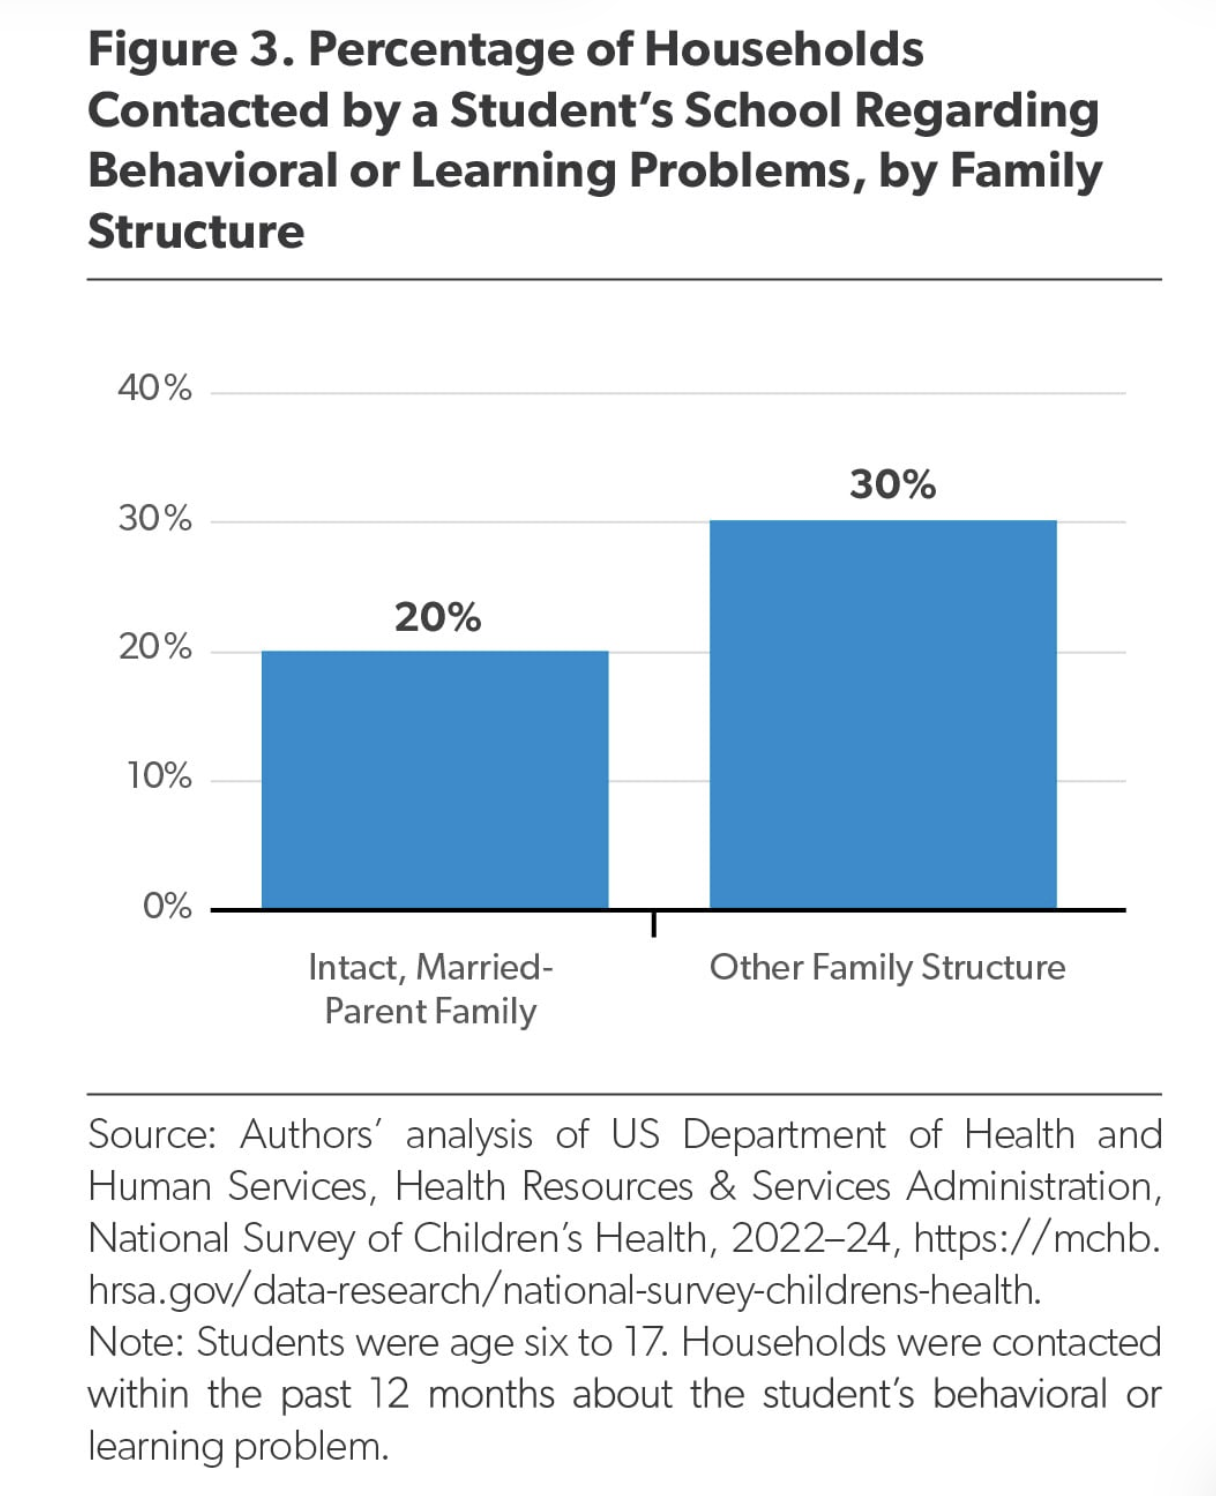
Family structure is a strong predictor of issues at school. Children from intact, married-parent families were the least likely to have their parents contacted by schools for behavioral or learning problems, as shown in Figure 3. Indeed, nearly a third of children (30 percent) who were from non-intact homes or had unmarried parents had their home contacted for problems at school in the previous year, compared with one in five children (20 percent) from intact, married-parent families.
These disparities persist when we control for student race, income, parental education, student sex, and student age. We find that across these factors, family structure is the strongest predictor of problems at school, as shown in Figure 4. Net of controls, children living in non-intact homes or with unmarried parents were 47 percent more likely to have their parents contacted by their school than were children from intact, married-parent families.
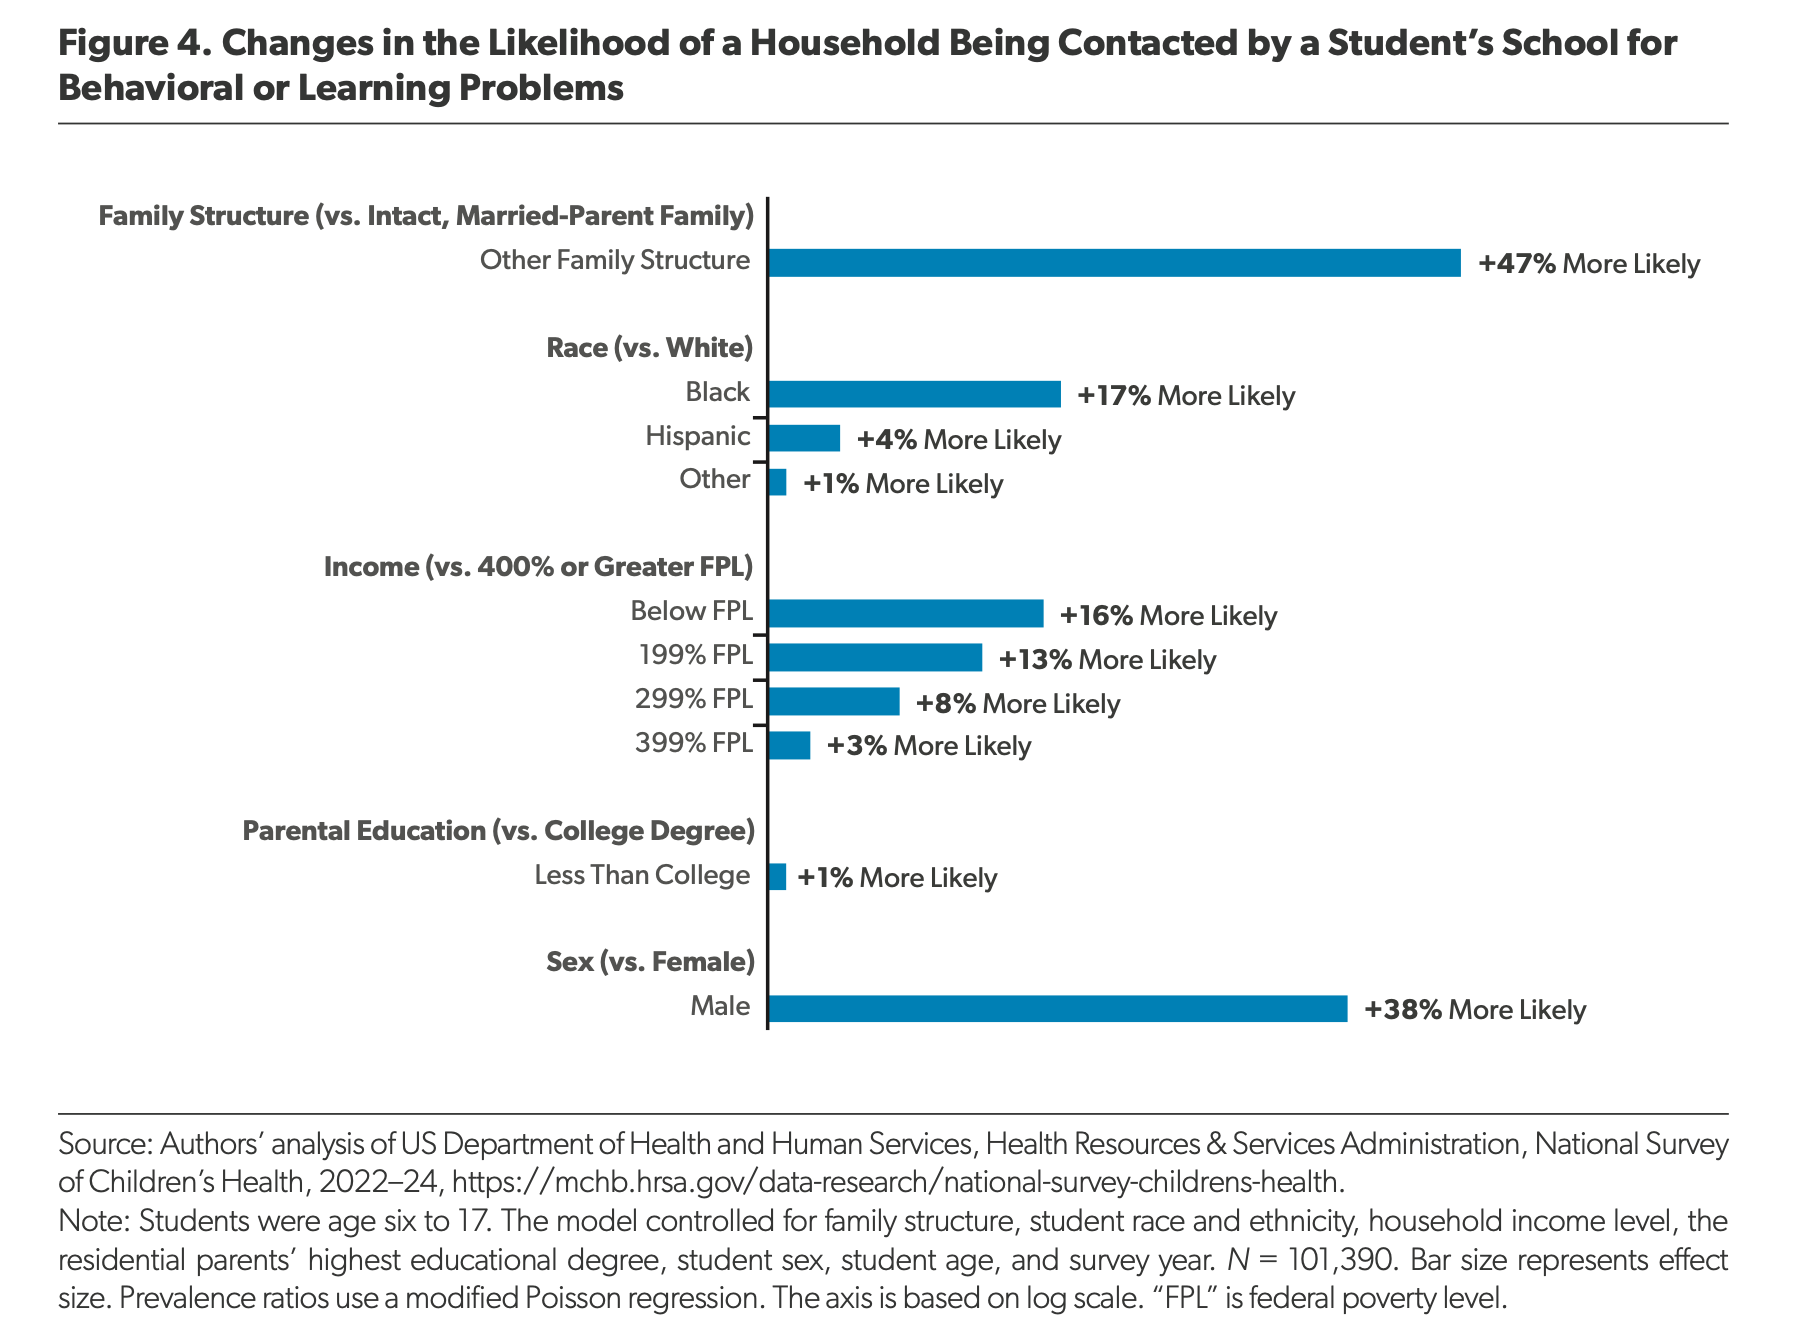
This disparity surpasses the differences between boys and girls, with boys’ homes being 38 percent more likely to be contacted by their school. Black children were 17 percent more likely to have their home contacted by their school than white children were; the effect was insignificant for Hispanic children versus white children.
Likewise, children from households earning below the federal poverty level were only 16 percent more likely to have their school contact their home net of controls than were higher-income families (or households with an income four times or more over the federal poverty level). We found no significant difference in the number of times schools contacted households when factoring for residential parents’ highest education level. This indicates that family structure surpasses race, poverty, and parental education as a predictor of school problems in the National Survey of Children’s Health.
Good Grades
The relationship between the classroom and homelife goes beyond behavior. We find that family structure is also associated with grade outcomes, with children from intact, married-parent families outperforming their peers from non-intact families.
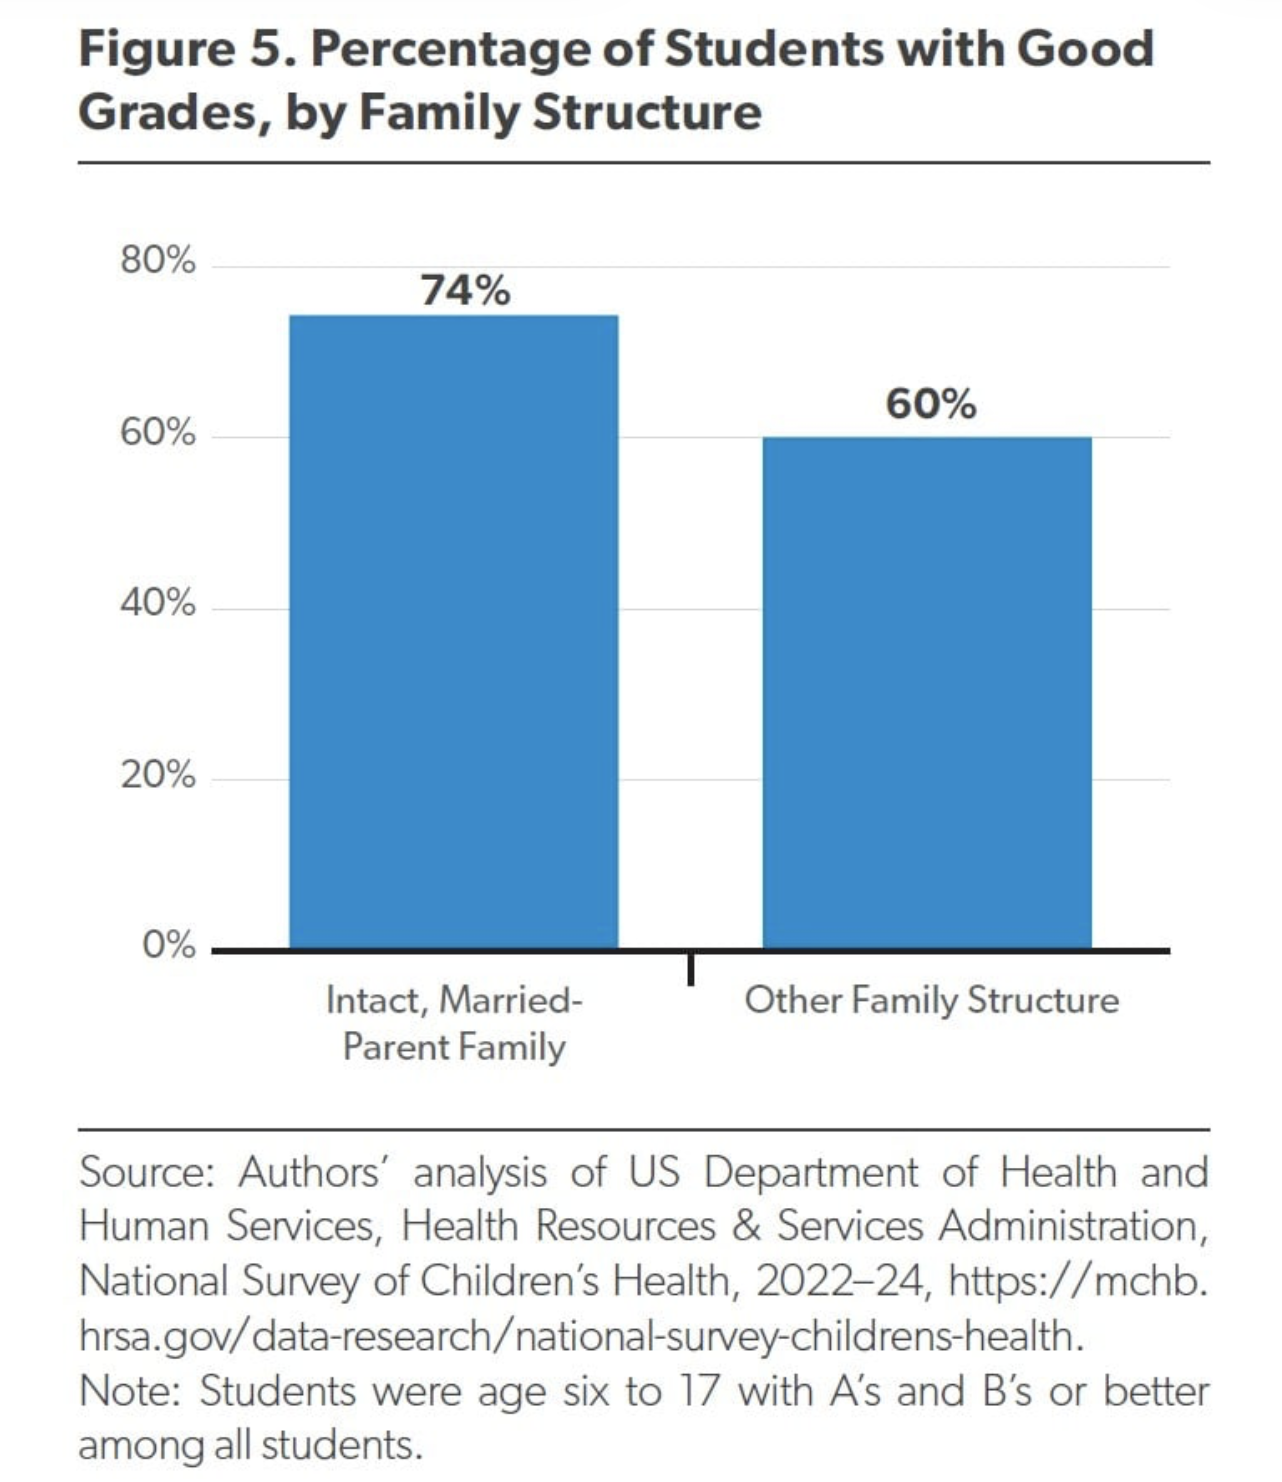
Note how family structure relates to student grades. We find that, as in the case of misbehavior in school, kids from intact, married-parent families tend to do the best (Figure 5). From 2022 to 2024, 74 percent of children age six to 17 from intact, married-parent families got A’s and B’s or straight A’s. This compares with 60 percent of those from non-intact homes or living with unmarried parents—a 14 percentage point gap.
This GPA premium for intact, married-parent families holds even with demographic controls. After controlling for race, income, the residential parents’ highest education level, student sex, and student age, we found that parental education and family structure were the two strongest predictors of grade outcomes for children in the United States (Figure 6). Children from non-intact or unmarried-parent households were 13 percent less likely to have received A’s and B’s or better, compared with children from intact, married-parent families. Students who did not have a residential parent with a college degree were 13 percent less likely to get A’s and B’s, compared with those who had a college-educated parent.
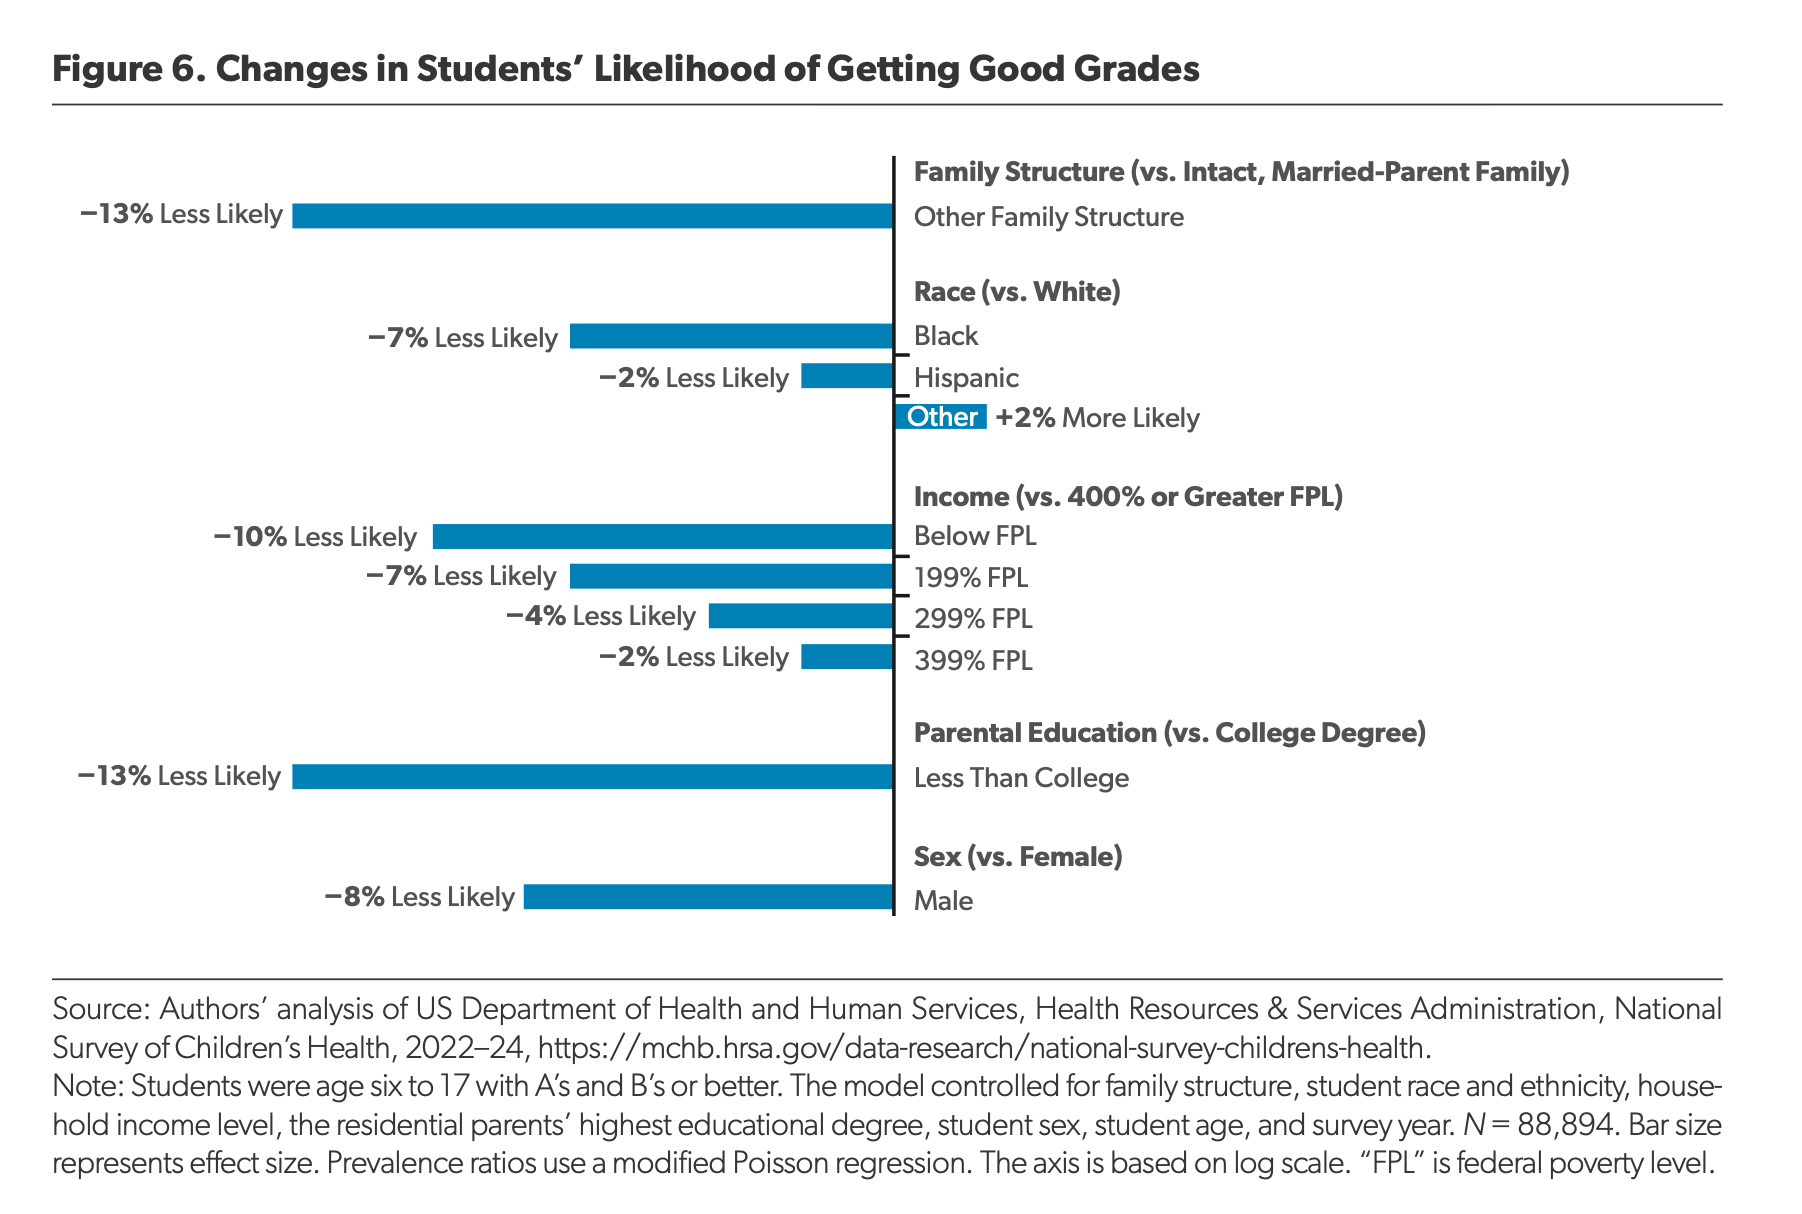
The family-structure effect is greater than that of family income and child race. After controlling for other factors, children living below the federal poverty level were 10 percent less likely to have good grades compared with those 400 percent above the federal poverty level. Black children were 7 percent less likely to have received A’s and B’s or better than were their white peers, and Hispanic children were 2 percent less likely. To summarize, growing up in an intact, married-parent home has an effect on GPA comparable to that of growing up with a college-educated parent. Family structure is more predictive of success in school than race, income, and sex.
Depression
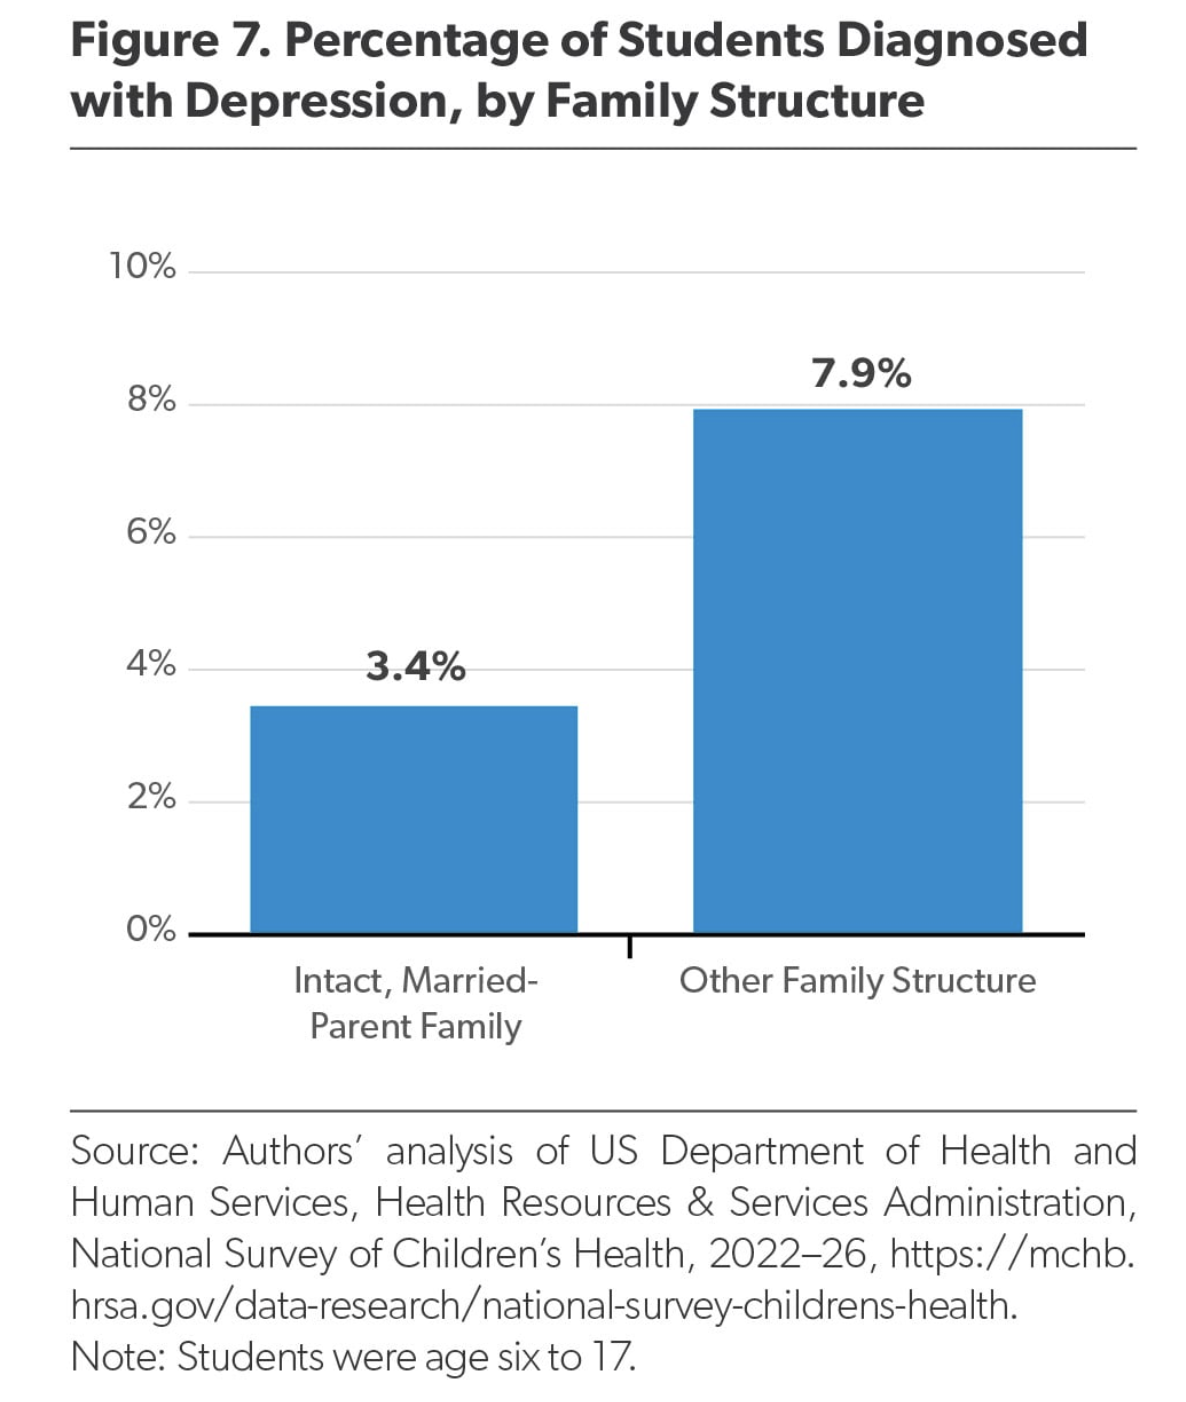
There is a substantial difference in children’s depression rates across household structure. Children from intact, married-parent families have the lowest rates of diagnosed depression (Figure 7). More specifically, just 3.4 percent of children age six to 17 from intact, married-parent families had been diagnosed with depression from 2022 to 2024. On the other hand, children from non-intact or unmarried-parent homes had over twice the rate of depression (7.9 percent).
As shown in Figure 8, these effects hold after controlling for race, income, parental education, and student sex and student age. Of these factors, age was most predictive: Depression is substantially more prevalent among children in their late teens compared with younger children. After age, however, family structure was the most predictive of a child having depression in our sample.
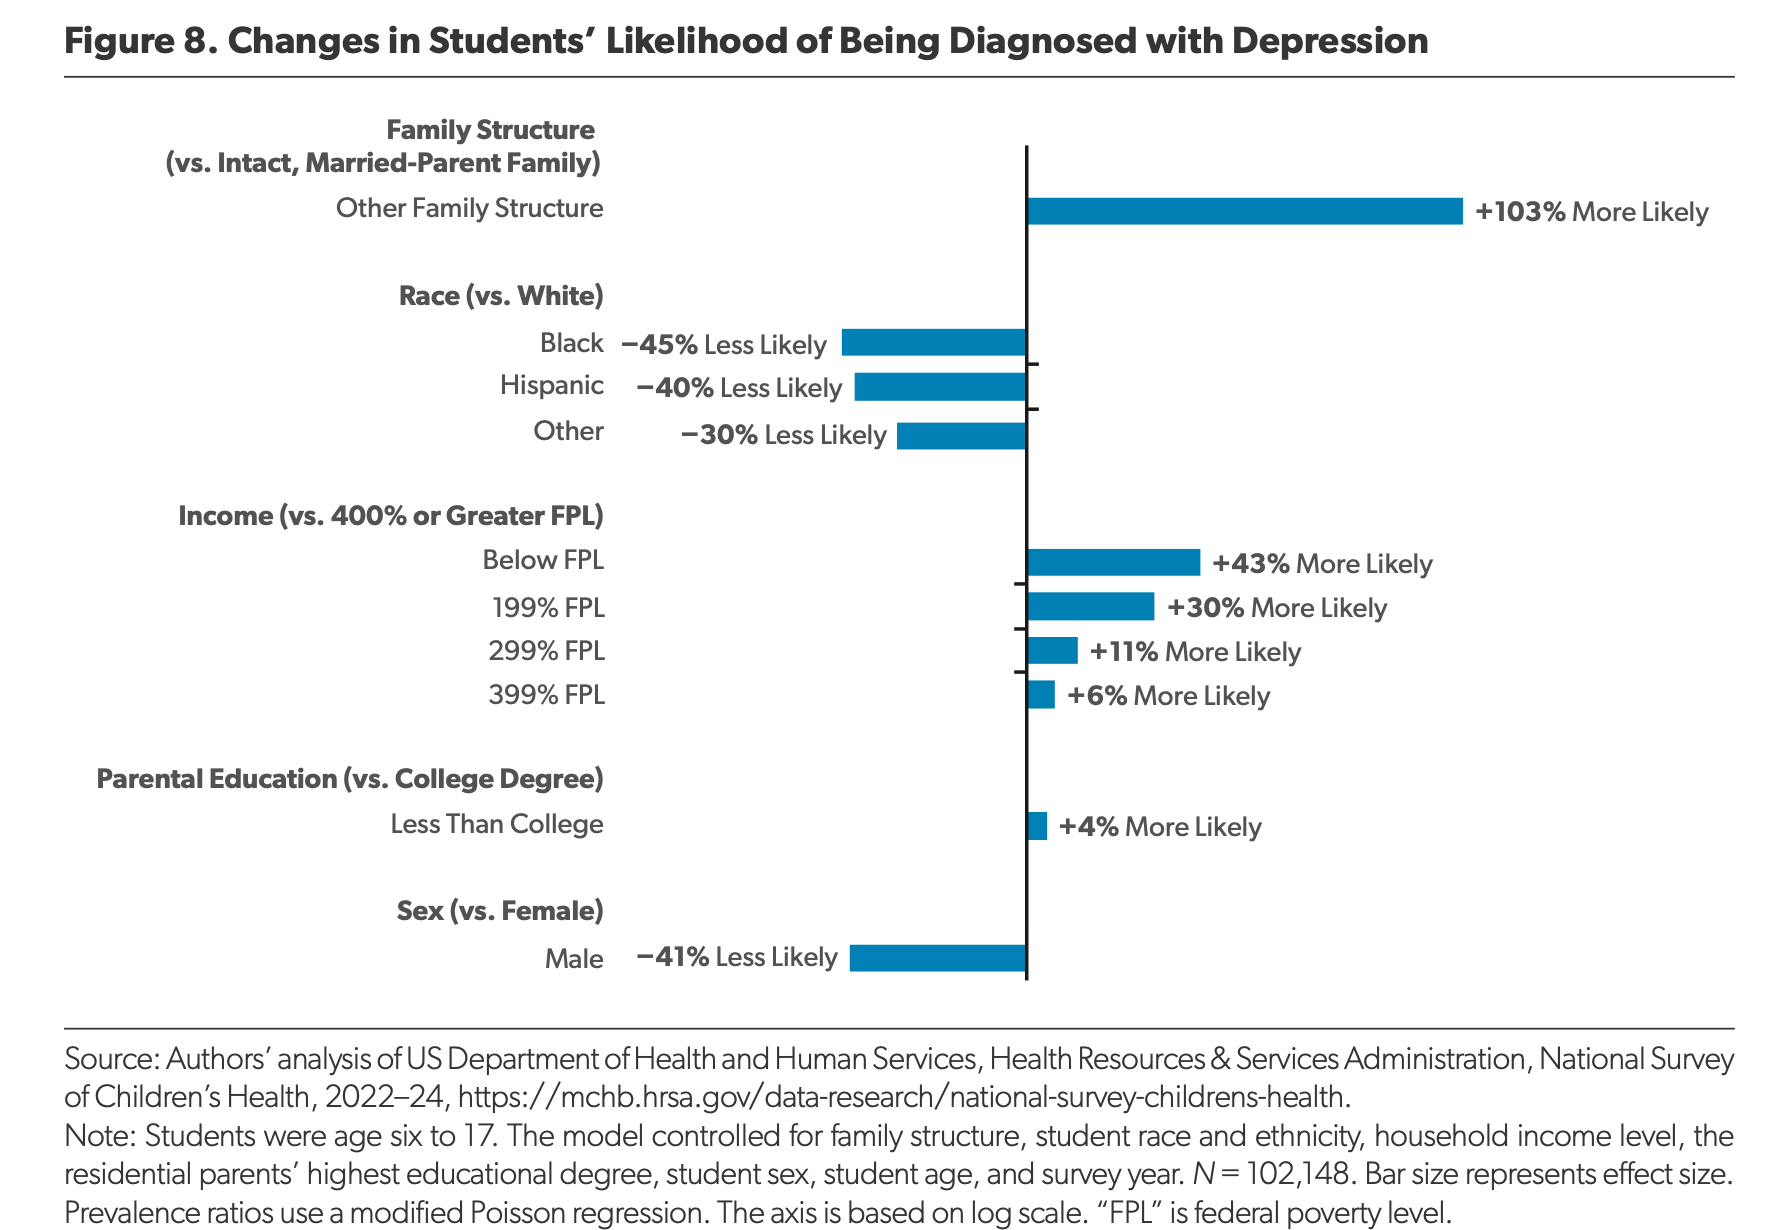
Children from non-intact or unmarried-parent households were over twice as likely to be diagnosed with depression as their peers from intact, married-parent homes. This is comparable to children from lower-income households, who were 43 percent more likely to be diagnosed with depression compared with children from higher-income households, net of controls. Boys were 41 percent less likely to be diagnosed with depression than girls, and black and Hispanic children were 45 percent and 40 percent less likely to be diagnosed with depression than white children, respectively. In summary, family structure is more predictive of childhood depression than race, income, and sex.
Discussion and Conclusion
In 1966, the landmark Equality of Educational Opportunity report by James S. Coleman established that a student’s family structure and background remains a—if not the most—dominant factor in driving academic achievement. Despite 60 years of evidence that has often reinforced that finding, government data analyses at the federal and state levels systematically ignore family structure’s signal role in student learning. We can and must change that.
NAEP must begin reporting family-structure information it is already collecting from students. At the least, NAEP can make the broader range of data it has been compiling since 2013 more easily accessible to the public.
Tens of millions of young Americans continue to struggle with fundamental reading and math skills. It does not have to be this way. Better information can help us understand why. Using a broader range of family characteristics reveals great heterogeneity within the broad, conventionally emphasized subgroups such as race and ethnicity and family income. Knowing this information will benefit current and future generations.
The point of reporting student outcome information by family structure, of course, is not intended to be an opportunity to demonize certain family types. Rather, it is to give policymakers, educators, parents, and the general public the opportunity to understand the factors most relevant to student development. Among other things, this information could be used to help educators understand the need for lending additional assistance to children from non-intact families.
In light of this research, the universe of interventions could be expanded to help young people think differently about their future. For example, it is true that educators cannot control or change the structure of the families that students are from. But we can influence how our students think about the families they form and the series of life choices that will likely lead to their life success—and that of their children.
One way of doing this is teaching middle and high school students the “success sequence”: 97 percent of young people who graduate with at least a high school degree, enter into full-time employment, and then get married before having children are not poor as adults, and the vast majority enter the middle class or beyond. Young adults who follow the sequence are also much more likely to forge stable families of their own. A recent Institute for Family Studies report, Advancing the Path to Success: How States Can Teach the Success Sequence to Youth, gives a comprehensive discussion of the research and debate around the success sequence and lays out feasible steps for states to begin teaching it or scaling it accordingly.
What’s more, the nation is witnessing a decline in its divorce rate and an upsurge in the share of children being raised in married-parent families—in general and among lower-income and African American children in particular. The share of children living in married families reached its nadir at 64 percent in 2012 before climbing to 66 percent in 2024. Likewise, the proportion of black children being raised in a married-parent family rose from 33 percent to 39 percent over that same period. In talking about the value of the success sequence and marriage, in particular, educators and policymakers could point to these family trends to give students hope that they can achieve better family outcomes than they may have witnessed in their families of origin.
Finally, if analyses of student success indicate that poor performance is concentrated among children being raised in non-intact families, this would enable educators, policymakers, and parents to focus their attention on kids by family structure rather than by factors that may be less salient. It would also spur policymakers and parents to consider new policy and cultural efforts to augment the family stabilization pattern that is already playing out across the nation.
About the Authors
Ian V. Rowe is a Senior Fellow at the American Enterprise Institute, where he focuses on education and upward mobility, family formation, and adoption.
Brad Wilcox is a Nonresident Senior fellow at the American Enterprise Institute, where he directs the Home Economics Project; the Melville Foundation Jefferson Scholars Foundation Distinguished University Professor of Sociology at the University of Virginia; and a Senior Fellow at the Institute for Family Studies.
Grant Bailey is a Research Fellow at the Institute for Family Studies.
Editor's Note: For a list of references and the Appendix, please download the full report below.