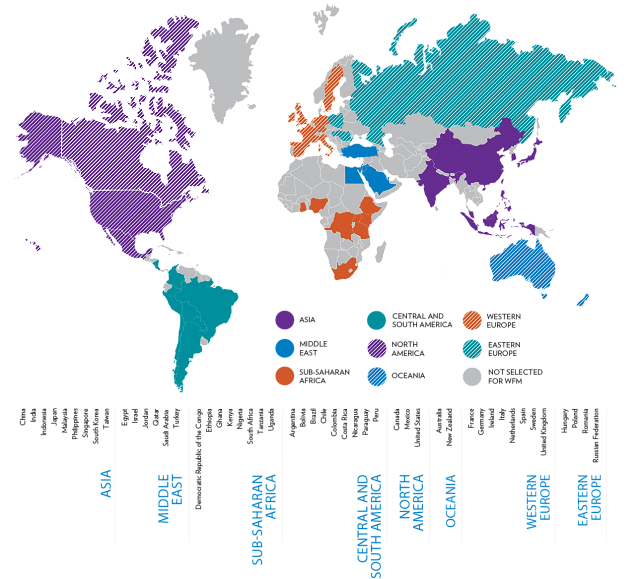
FIGURE A: Countries in the 2019 World Family Map
Selecting indicators: Along with advisors representing every region of the world, the study team selected indicators using a research-based conceptual framework of family strengths. We generated indicators in the following four domains: family structure, family socioeconomics, family process, and family culture. Indicators were chosen for each domain based on their importance to family and child well-being and on data availability, as well as a concern for regional representation and balance in the number of indicators across domains.
Selecting countries: When designing this report, it was necessary to select a set of countries for which comparisons could be made. While it was not possible to include all of the approximately 200 countries in the world, countries were selected to ensure regional representation of high-, middle-, and low-income countries. Data availability for the desired time period was also considered. These factors resulted in focusing on 49 countries—an increase from 45 countries in the original 2013 report—that account for over 75 percent of the world’s population.2 Figure A displays the countries by region. As more data become available on key indicators of family well-being, the World Family Map will be able to include more countries.
Data sources: Numerous data sources track indicators of family well-being. The sources presented here, which are listed below, were selected for their quality, their coverage of countries, and their indicators. These sources have a reputation for using rigorous data collection methodologies across countries, or in cases where they collected data from individual country sources, such as censuses, they harmonized the data to ensure comparability across countries. In addition, we chose data sources in which multiple countries were represented; however, data from the same source may not be available for all countries or for the same year across countries, so caution is needed in making comparisons. For each indicator a primary data source was chosen. When data for a particular country were not available from that source, other sources were used to supplement. When data are available from the same source for multiple years, we note changes in indicators that are five percentage points or larger.
Data Sources
Country-level sources: When data were not available from an international survey, country-level data sources were sought. Examples include data from national statistics bureaus and country-level surveys.
Demographic and Health Surveys (DHS): DHS is a survey of more than 90 developing nations, focusing on population and health information. This report uses the most recent data available for each country, ranging from 2005 to 2017.
Food and Agriculture Organization (FAO): As part of the United Nations, FAO compiles statistics on food and agriculture-related indicators, including undernourishment. The most recent data are projected for 2014 to 2016 and were extracted from their statistical division’s online database FAOSTAT.
Integrated Public Use Microdata Series-International (IPUMS): IPUMS is a compilation of harmonized censuses from countries throughout the world. This report uses the most recent data available for each country, ranging from 2000 to 2017.
International Social Survey Programme (ISSP): ISSP is a collaboration among annual national surveys to ensure data comparability on social science questions. This report uses their 2012 collection on family and changing gender roles. These surveys were fielded around 2012, but not necessarily in the 2012 calendar year.
LIS (formerly known as the Luxembourg Income Study): LIS is a collection of harmonized data on the income and wealth of individuals in middle- and high-income countries. Data from LIS used in this report date from 2002 to 2013.
Organization for Economic Co-operation and Development (OECD): OECD’s Family Database provides cross-national statistics on the well-being of families and children throughout the member and partner countries of the OECD.
Program for International Student Assessment (PISA): PISA is an international tri-annual assessment of literacy in reading, mathematics, and science. PISA is administered in all OECD member countries as well as additional self-selected countries. This report uses data from the contextual part of the 2012 parent survey. Unfortunately, the items of interest were asked in a small group of countries in this iteration of the survey.
United Nations (UN): The UN’s World Marriage Data provides comparable data on the marital status of the population by age and sex for countries around the world (compiled from national sources and nationally representative multi-country surveys). This report uses the 2017 update.
World Bank: The World Bank provides a wealth of information on their databank at
data.worldbank.org. This report utilizes their data on absolute poverty.
World Values Survey (WVS): WVS is a survey of political and sociocultural values in more than 50 countries. This report uses the most recent data available for each country, from the fourth through sixth survey waves, which date from 2001 to 2014.
For more information on specific sources, see e-ppendix at
http://ifstudies.org/the-ties-that-bind.
FOOTNOTES:
1 Renee Ryberg and Laura H. Lippman contributed to sections of the “World Family Indicators” that have not been updated since our 2017 report.
2 United Nations, Department of Economic and Social Affairs, Population Division (2013). World Population Prospects: The 2012 Revision, DVD Edition.