Highlights
- Poorly-designed welfare programs not only discourage work, but also thwart the formation of stable two-family households of the kind that keep children out of poverty, out of prison, and in college. Post This
- The marriage penalty, like work disincentives, hits the near-poor the hardest. Post This
- Although the welfare system gives a small marriage bonus to couples who are in deep poverty, it imposes a large marriage penalty on households that are just past the official poverty line but still striving to reach full self-sufficiency. Post This
America’s tangle of overlapping welfare programs raise many families and individuals out of poverty, but too often, there is a tradeoff. By clawing back benefits as earnings rise, they discourage work. As I discussed in a recent commentary for the Niskanen Center, these work disincentives tend to hit the near-poor the hardest. In the income range from 100 to 200% of the official federal poverty level (FPL), benefit reductions, combined with income and payroll taxes, can create effective marginal tax rates (EMTRs) that approach, or even exceed, 100 percent.
But that is not all. This post shows that poorly designed welfare programs not only discourage work, but also thwart the formation of stable two-family households of the kind that keep children out of poverty, out of prison, and in college. As we will see, the marriage penalty, like work disincentives, hits the near-poor the hardest.
Work Incentives for Singles With and Without Children
Let’s begin with a review of the patterns of work incentives and disincentives created by the most widely-used public assistance programs. The following chart, based on the Atlanta Fed’s on-line benefit calculator, shows the situation faced by two hypothetical households with a single parent—one with children and one without. Both are assumed to live in Boston, Massachusetts.
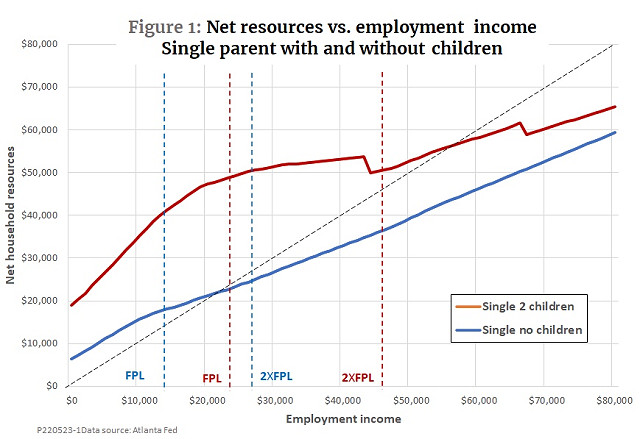
The red line in the figure shows how net household resources (earned income plus value of benefits minus taxes) varies as employment income increases for the parent with two children. Benefits come from a common combination of programs, namely, Medicaid, SNAP, the Child Tax Credit (CTC), and the Earned Income Tax Credit (EITC). The blue line charts net resources for the single person without children who participates in Medicaid, SNAP, and EITC. The dashed vertical lines show federal poverty levels for both household types. Note that these official FPLs are based on employment income and cash benefits. They do not count the value of the in-kind benefits and tax credits.
In both cases, the slope of the net-benefit line varies with employment income. Steeper sections indicate good work incentives and low effective marginal tax rates. Along flatter sections, EMTRs are higher, so there is less incentive to work. Keep in mind that an incentive to work does not necessarily mean that a person will in fact achieve desired employment goals. Suitable jobs may not be available. Even if they are, noneconomic considerations, such as caregiving obligations, school, or ill health, may keep people out of the labor force.
At incomes below the FPL, the parent with children has strong work incentives. As earnings increase from zero to the federal poverty level of $23,000, net resources, including all benefits, increase by $1.29 for each $1 earned. That translates to an EMTR of minus 29 percent. Beyond that level, however, further earnings do little to improve living standards. As earnings increase from $23,000 to $46,000, net income increases by just $1,857. The “benefit cliff,” visible at an income of $44,000, corresponds to the final cutoff of SNAP benefits. Taking all taxes and benefit reductions into account, the family keeps just 9 cents of every dollar earned over the income range from 100 to 200% of the FPL—an EMTR of 91 percent.
The situation facing the single individual is very different. At all income levels, benefits are much less generous. SNAP benefits are smaller because they depend on family size, EITC benefits for single workers are very low, and, with no children, there is no CTC. The result is a different pattern of work incentives. Below the single person’s FPL of $13,590, the EMTR is 14 percent. That is higher than the EMTR for the family with children, but it still offers a fair incentive to work. Between the FPL and twice the FPL, the EMTR for the single person rises to 47 percent. That implies a net take-home pay, including benefits, of 53 cents per dollar earned, which looks daunting by middle-class standards, but it is much better than the 9-cent take-home per dollar earned for the parent of two children.
On the whole, then, the chart shows a pattern found to prevail widely in earlier research. The American tax and welfare systems create good work incentives for households that are in deep poverty and just entering the labor market. However, for the near-poor—those who have made it to the poverty line but are still struggling to achieve true self-sufficiency—incentives are far weaker to take on more hours or seek promotions that would bring higher wages.
Welfare, Taxes, and the Marriage Penalty
Let’s turn now to the issue of household structure. What would happen if the two adults represented in Figure 1 moved in together to form a single cohabiting household with two adults and two children? What would happen if the cohabiting adults then married?
Figure 2 shows the answer. It assumes that the two adults live in the home previously occupied by the parent with children, pool their incomes, and share all expenses. This time, the vertical lines are based on an FPL of $27,750 for a four-person household. For convenience, the figure assumes that each of the two adults has approximately the same earnings.
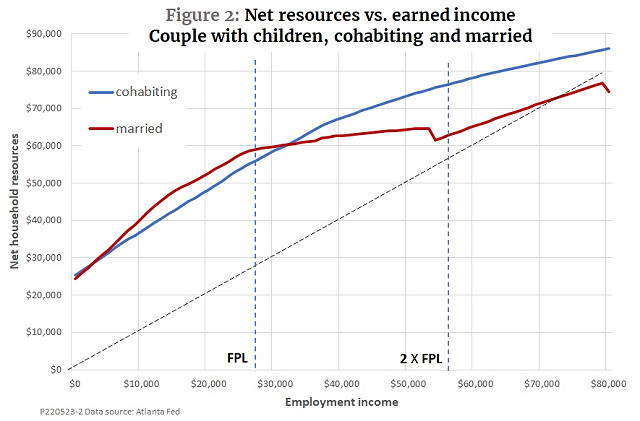
The relation of net household resources to employment income differs dramatically for the two household configurations. Beginning from zero, the married couple at first does better. Total household resources are higher over most of the range up to the FPL. The married couple’s work incentives are also stronger. Over the range from zero to 100% of the FPL, net household resources rise by $1.28 cents for each dollar earned compared with $1.13 for the cohabiting couple. These advantages come partly from the fact that the EMTR and CTC phase in faster for the married couple, and partly because SNAP and health benefits do not phase out as quickly.
Beyond the FPL, however, the situation is reversed. Between earnings of $28,000 and $56,000, the red curve flattens dramatically as the married couple’s EMTR rises to a confiscatory 88%, compared to just 30% for the cohabiting couple. That is because SNAP, the EITC, and health benefits phase out simultaneously over this income range for the married couple. For the cohabiting couple, the phase-outs are spread over a much wider income range and overlap less. Due to the higher EMTR, net household resources for the married couple drop below those for the cohabiting pair soon after reaching the FPL.
After earnings rise past twice the FPL, the difference in EMTRs essentially disappears, but the household resource gap never closes. Even when earnings reach $80,000 per year, the married couple is still worse off by more than $10,000.
Yes, the Marriage Penalty Is Real
In short, although the welfare system gives a small marriage bonus to couples who are in deep poverty, it imposes a large marriage penalty on households that are just past the official poverty line but still striving to reach full self-sufficiency. Furthermore, the chart understates the marriage penalty in one way, since it assumes that each adult works roughly the same hours and has about the same earnings. In reality, the high EMTR means that when one of the adults is able to command an even slightly higher wage, there is a big incentive for the high earner to work more hours while the lower earner stays home with the children.
For example, suppose the low earner’s job pays the Massachusetts minimum wage of $14.25 an hour. An EMTR of 88% turns that into take-home pay of just $1.71 per hour. That is far short of the cost of child care. It would not even cover a bus ticket to work plus lunch in the company cafeteria. Better for the low earner to stay at home, eat at home, and keep the kids at home while the higher earner works longer hours.
Of course, for some couples, the traditional pattern of a breadwinner and a stay-at-home mom or dad works just fine. But in the real world, that is not always the case. It is far from clear that a family made up of a stay-at-home mom and a dad who works long overtime hours to pay the rent is an ideal that public policy should actively encourage.
Can anything be done—anything affordable to the federal budget and politically palatable to a large enough bipartisan coalition to make some changes? That is the subject of my next post.
Ed Dolan is a Senior Fellow at Niskanen Center, writing on social policy, climate, and political economy.
Editor's Note: The opinions expressed in this article are those of the author and do not necessarily reflect the official policy or views of the Institute for Family Studies.