
Petula Dvorak in the Washington Post this week suggests that fertility is low primarily because women are choosing a childfree life. The truth is, when I write about fertility, and particularly the ongoing, precipitous decline in fertility, I commonly get this response: maybe women are having fewer kids because they just don’t want kids. When I respond, being a childless male, I run the risk of “mansplaining” women’s fertility. Thus, as I have been writing about fertility, I have also collected research on childbearing preferences: aside from anecdotes, is there any actual data about what women want with respect to the number of kiddos?
Highlights
- The decline in fertility is not due to women wanting fewer kids. It's mostly due to declining marriage. Post This
- Cut the data however you like, use whatever indicator floats your boat, and you’ll find the ship of American fertility sinking, steadily underperforming what women have been saying they want or intend. Post This
There turn out to be a large number of surveys asking about fertility preferences, and no matter how creatively it is sliced and diced, no matter what data source is used, women have fewer kids than they say they want, desire, intend, expect, or consider ideal—for themselves or for society on the whole.
Let’s start with the longest-running data available: Gallup polls on the ideal number of children. Gallup has been asking Americans, “What do you think is the ideal number of children for a family to have?” since 1936, with the most recently-reported data from 2013. The public data released isn’t broken out by age or sex, so I can’t say from it exactly what women want, but it’s a useful benchmark. This question is an example of what fertility-researchers call a general ideal. That is, the question does not ask respondents what they themselves want.
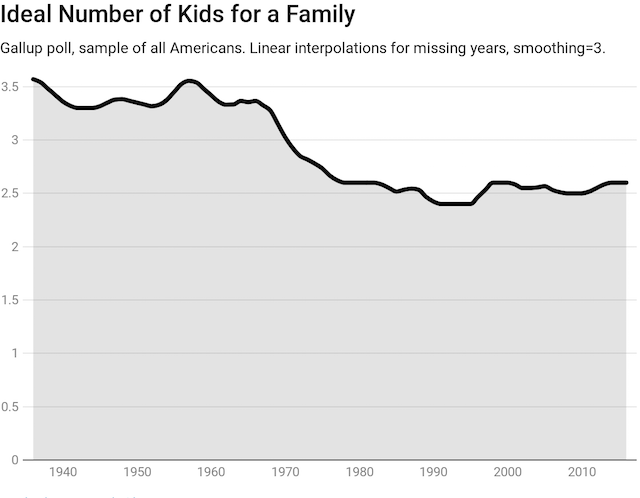
The trend shown by Gallup is pretty clear. The general ideal for childbearing was around 3.5 kids from the 1930s until the 1960s. In the early 1980s, it hit about 2.5 or 2.6 and has basically been stable since then.
But this figure isn’t very convincing to most people. First of all, questions about “general ideals” may tend towards pie-in-the-sky idealism. Second of all, it’s not clear whether we should include the opinions of 72-year-old men when we assess whether or not women are achieving their childbearing goals. What we really want to know, then, is what do potential mothers desire for themselves?
How Many Children Do Women Ideally Want to Have?
To answer this, we can turn to the General Social Survey (GSS), which has asked about ideal fertility since 1972. The GSS asks the same question as Gallup: “What is the ideal number of children for a family to have?” But because the individual-level data from the GSS is publicly accessible, we can break it down and make some adjustments to compensate for possible weaknesses in this “general ideal” framing.

Gallup and the GSS responses for reproductive-age women are very close to each other. But increasingly, some women respond to this question not by saying, “2” or “3,” but by simply saying, “As many as you want.”
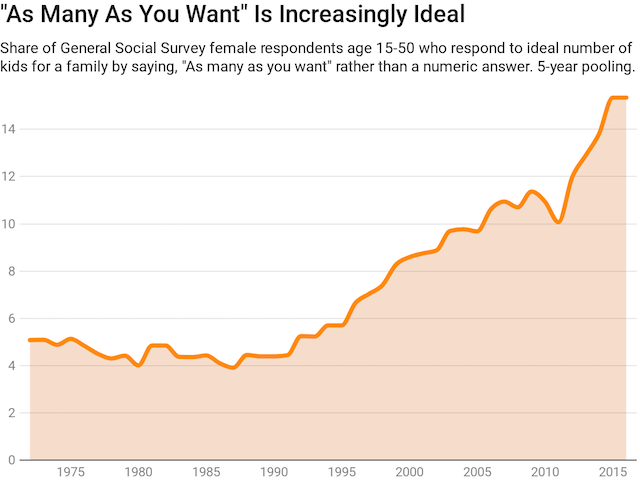
There are several ways we could treat this response. One option is to assume that these women are just doubling-down on the ideals expressed by other women; in other words, these women believe their ideal number is the average of other women’s ideals. That’s a convenient way to cut the data, as it means these women can simply be dropped from the sample. Alternatively, we could take an extremely pessimistic view of these responses, as some researchers suggest that “ideals” may represent castles in the air, not actual desires, and treat “as many as you want” as “zero,” which lowers the estimate of average ideal family size. We could be even more pessimistic and assume that women are extremely hesitant to give an ideal number less than their actual number of children. With both of these adjustments, we get a hardcore “minimum” estimate of ideal fertility.
We also have four other surveys from the past that ask about ideal fertility in different ways: the National Fertility Survey (NFS) from 1965-1975, the Growth of American Families Survey (GAF) in 1955, the old National Survey of Family Growth (NSFG) from 1973-1995, and the National Longitudinal Survey of Youth (NLSY) in 1979, all of which ask about desires. Conveniently, NFS, GAF, and NLSY ask about both general and personal fertility ideals, so we can see if there’s really such a big gap. It turns out, at least in the 60s and 70s, personal ideals are still well above actual fertility.
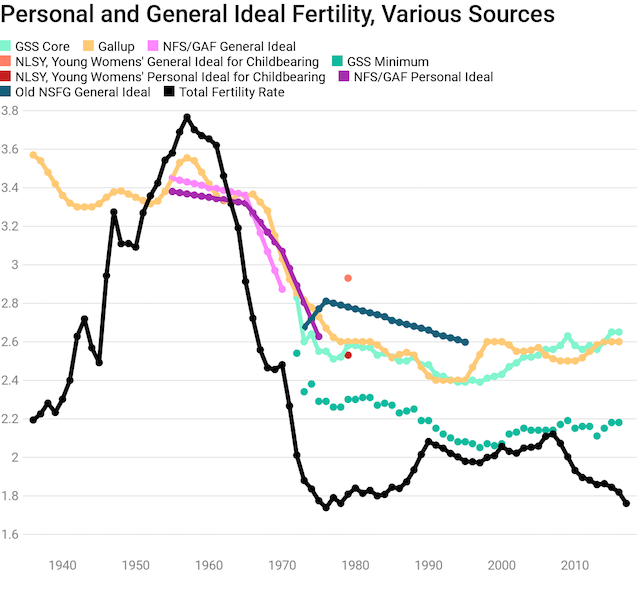
Combining it all together, we can see that every single estimate of ideal or desired fertility, including our hardcore minimum estimate from adjusted GSS data, is way above actual fertility. Additionally, the minimum estimate from the GSS ideal fertility data greatly undershoots NFS-measured personal ideal childbearing around their overlapping years, suggesting these adjustments are an over-correction. The same goes for the NLSY data: while personal ideals undershoot general ideals, personal ideals are roughly in line with other sources. That personal ideal may still be biased for various reasons, but the point is that no matter how you cut the data, every source we have reveals that women, on average, desire between two and three kids. Furthermore, recent surveys done in European countries suggest that there’s no systematic under- or overshooting between personal and general ideals. Across the European Union, personal ideal fertility among women is 2.28 children, while general ideal fertility is 2.26. In some countries, general ideal fertility is higher, in others, it’s lower.
For the remainder of this post, I’ll use a weighted average of these desired fertility estimates as a standard estimator of desired fertility.
Intentions vs. Ideals
But there’s a different line of questioning we can take as well. Even personal ideals may be, well, idealistic. It may be better to ask women a more conditional question: not how many kids they want, but how many kids they actually expect, or how many they intend to actually try and have. One reason demographers like this question is because it usually does a better job predicting actual fertility trends than desired fertility: it turns out, women’s concrete intentions and expectations are more useful for forecasting births than their desires or ideals because, of course, they are!
Several surveys track intentions or expectations. The chart below shows the results, as I showed for ideals.
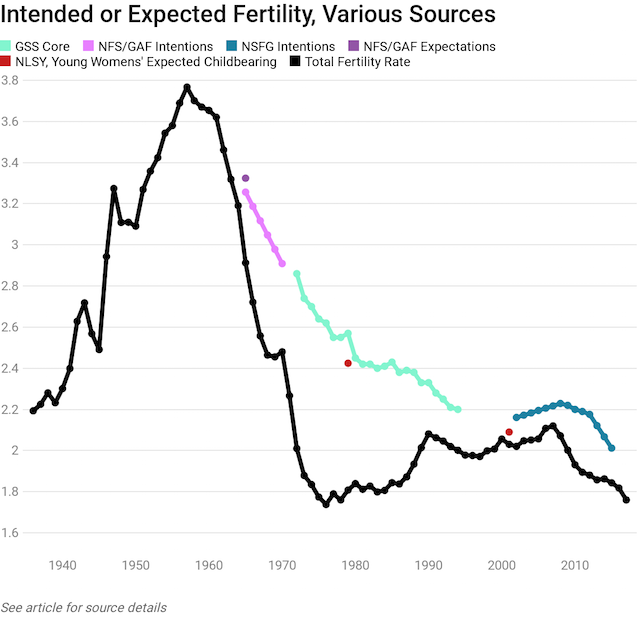
Many of the same surveys show up. The story they tell is one of a fairly smooth and steady decline in intended or expected fertility from 1960 until the 1990s, then basically some stability, and a more precipitous decline recently. But for the remainder of this research brief, I’ll use a composite “intentions” estimate based on all the various data sources for intentions, with simple interpolations through missing data years, similar to the composite ideal estimate I described above. The graph below shows these estimates, along with current fertility and another fertility indicator—completed fertility—which I’ll explain below.
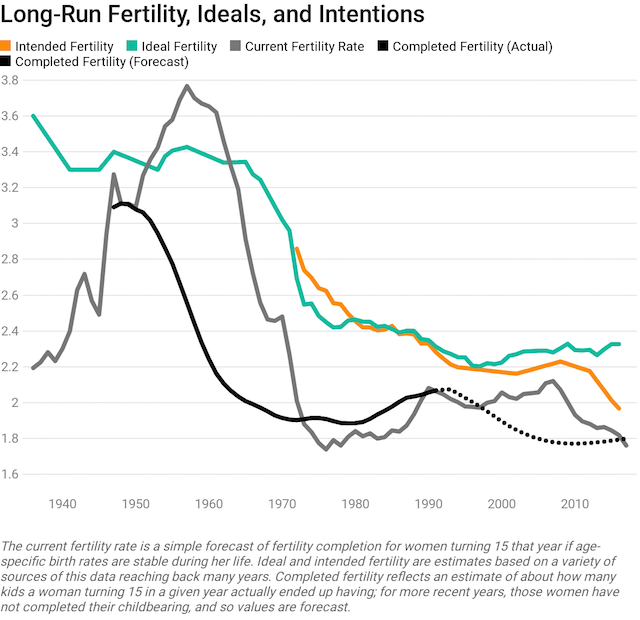
Until now, I’ve been comparing ideals and intentions to the year-specific total fertility rate, so basically an estimate of how many kids a woman today is likely to have in the future, compared to ideals. But that’s not necessarily the only way to cut the data. We could also look at women who are finishing their childbearing years, ask how many kids they had, and then look at what ideal or intended fertility was back when they were younger. In other words, I’m comparing how many kids that women said was ideal in a given year, to how many kids women who were just beginning their childbearing years in that year actually ended up having, or are likely to have by the time they end their childbearing.
What this comparison makes clear is that no matter whether you use intended or ideal fertility, women report greater childbearing ambitions than they have achieved or are likely to achieve, and this has been the case for a long time. Cut the data however you like, use whatever indicator floats your boat, and you’ll find the ship of American fertility sinking, steadily underperforming what women have been saying they want or intend. And for what it’s worth, across the pond in Europe, intended fertility in 2011 was around 1.8 to 2.3 kids, with the EU-wide average being about 2.05, even as European current fertility is about 1.5-1.75 kids per woman.
The Fertility Gap
While intentions and ideals followed each other fairly closely for a long time, they diverged after 2013. Today, we not only see a large gap between intended childbearing and actual childbearing, but also a large gap between desires and intentions! This yawning chasm between what women consider ideal and what they actually intend could reflect that the “ideal” is simply not very strongly held. However, that sounds too much like “mansplaining” female fertility preferences again. It seems a lot more plausible to suggest that these ideals and intentions have a rational basis.
In other words, women are simply settling for less than they want. They are in fact not“having it all.” Notably, the decline in intentions came after the actual decline in fertility, which suggests that the recession did permanent damage to fertility: it took a chunk out of childbearing, those births were not recovered later on, and now women have simply re-calibrated their expectations to the diminished circumstances of post-recession America. Longer hours, lower wages, less consistent employment, high childcare costs, poor access to credit, burdensome loans, all-too-few good husband candidates—take your pick of the problem—a growing number of women are simply lowering their expectations for their own family lives, even as they continue to believe that something like 2.3 kids would be ideal for them.
That explains the gap between ideal and intended fertility. But what about the gap between ideals or intentions, and actual fertility?
We can simplify this chart by taking the differences between these lines.
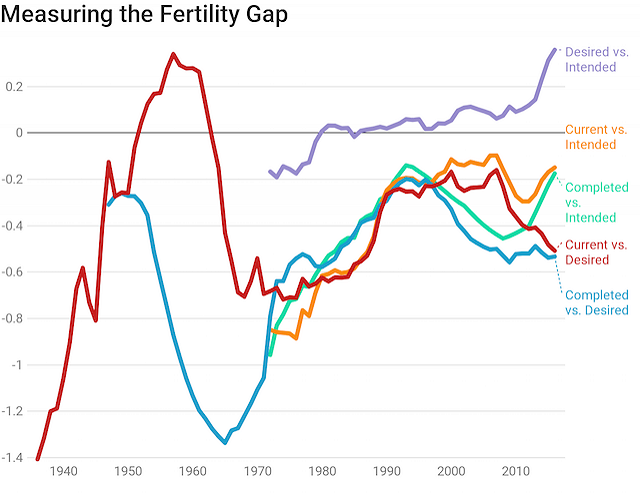
As you can see, current vs. completed fertility yield hugely different estimates of the “fertility gap” through the 1960s, as the baby boom was rising, and then receding. But by the 1970s, they converge and move together. The fertility gap got smaller and smaller through the mid-1990s whether you use completed or current fertility rates, or intended or ideal childbearing. But then things began to change.
Women beginning their childbearing years in the late 1990s—or Millennial women—experienced lower fertility, and have continued to experience reduced fertility rate to the present day. Current fertility rates were high in the 2000s thanks to elevated rates among older women, but by the time Millennial women are reaching those older cohorts, even 30-something fertility has begun to stall out. Based on desired fertility, both current and completed fertility shows a gap nearly as large as in the 1970s.
But the gap in intentions, while still negative, is near its lowest ever! That is to say, women who intend to have kids are basically having them at about the same rate as in the 2000s or the late 1990s. We can even reasonably expect that completed fertility for women turning 15 in the last few years will be close to their intended fertility. But this doesn’t mean women are getting the family life they want: it’s best to say women are simply being pushed to lower their expectations for themselves.
By any measure, the very best that can be said is that progress on helping women achieve their fertility intentions has stalled out since the 1990s, while progress on helping women achieve their fertility ideals has actually reversed.
If Not Changing Desires, Why the Decline?
The decline in fertility is not due to women wanting fewer kids. It also isn’t due to men wanting fewer kids, or to population aging. Nor is it due to abortion: abortion rates are actually declining. It may be partly due to the rising usage of longer-acting contraception, or diminished sexual frequency, or any number of social factors. It might also be due to economic pinches on household budgets. But the truth is, none of those are probably the biggest driver of declining fertility. The decline in fertility is mostly due to declining marriage.
Women who get married are overwhelmingly more likely to achieve their childbearing ideals and expectations, both in cross-sectional data and in panel data, as I have shown before. Thus, any debate about fertility has to begin with the question of why marriage is being delayed. To raise fertility, there are basically just two possible paths forward: increase marriage rates, or go the way of the Nordic countries and increase the non-marital fertility rate. Both options present serious challenges, and higher childbearing out-of-wedlock, in particular, isn’t usually seen as a good social outcome. But while policies oriented towards subsidizing childbearing may help to some extent, the reality is that no policy intervention is likely to produce durable results if women don’t spend more of their fertile years in marriages that are open to children.
Lyman Stone is a Research Fellow at the Institute for Family Studies, and an International Economist at the U.S. Department of Agriculture, where he forecasts cotton market conditions. He blogs about migration, population dynamics, and regional economics at In a State of Migration.